Download as PDF, PPTX
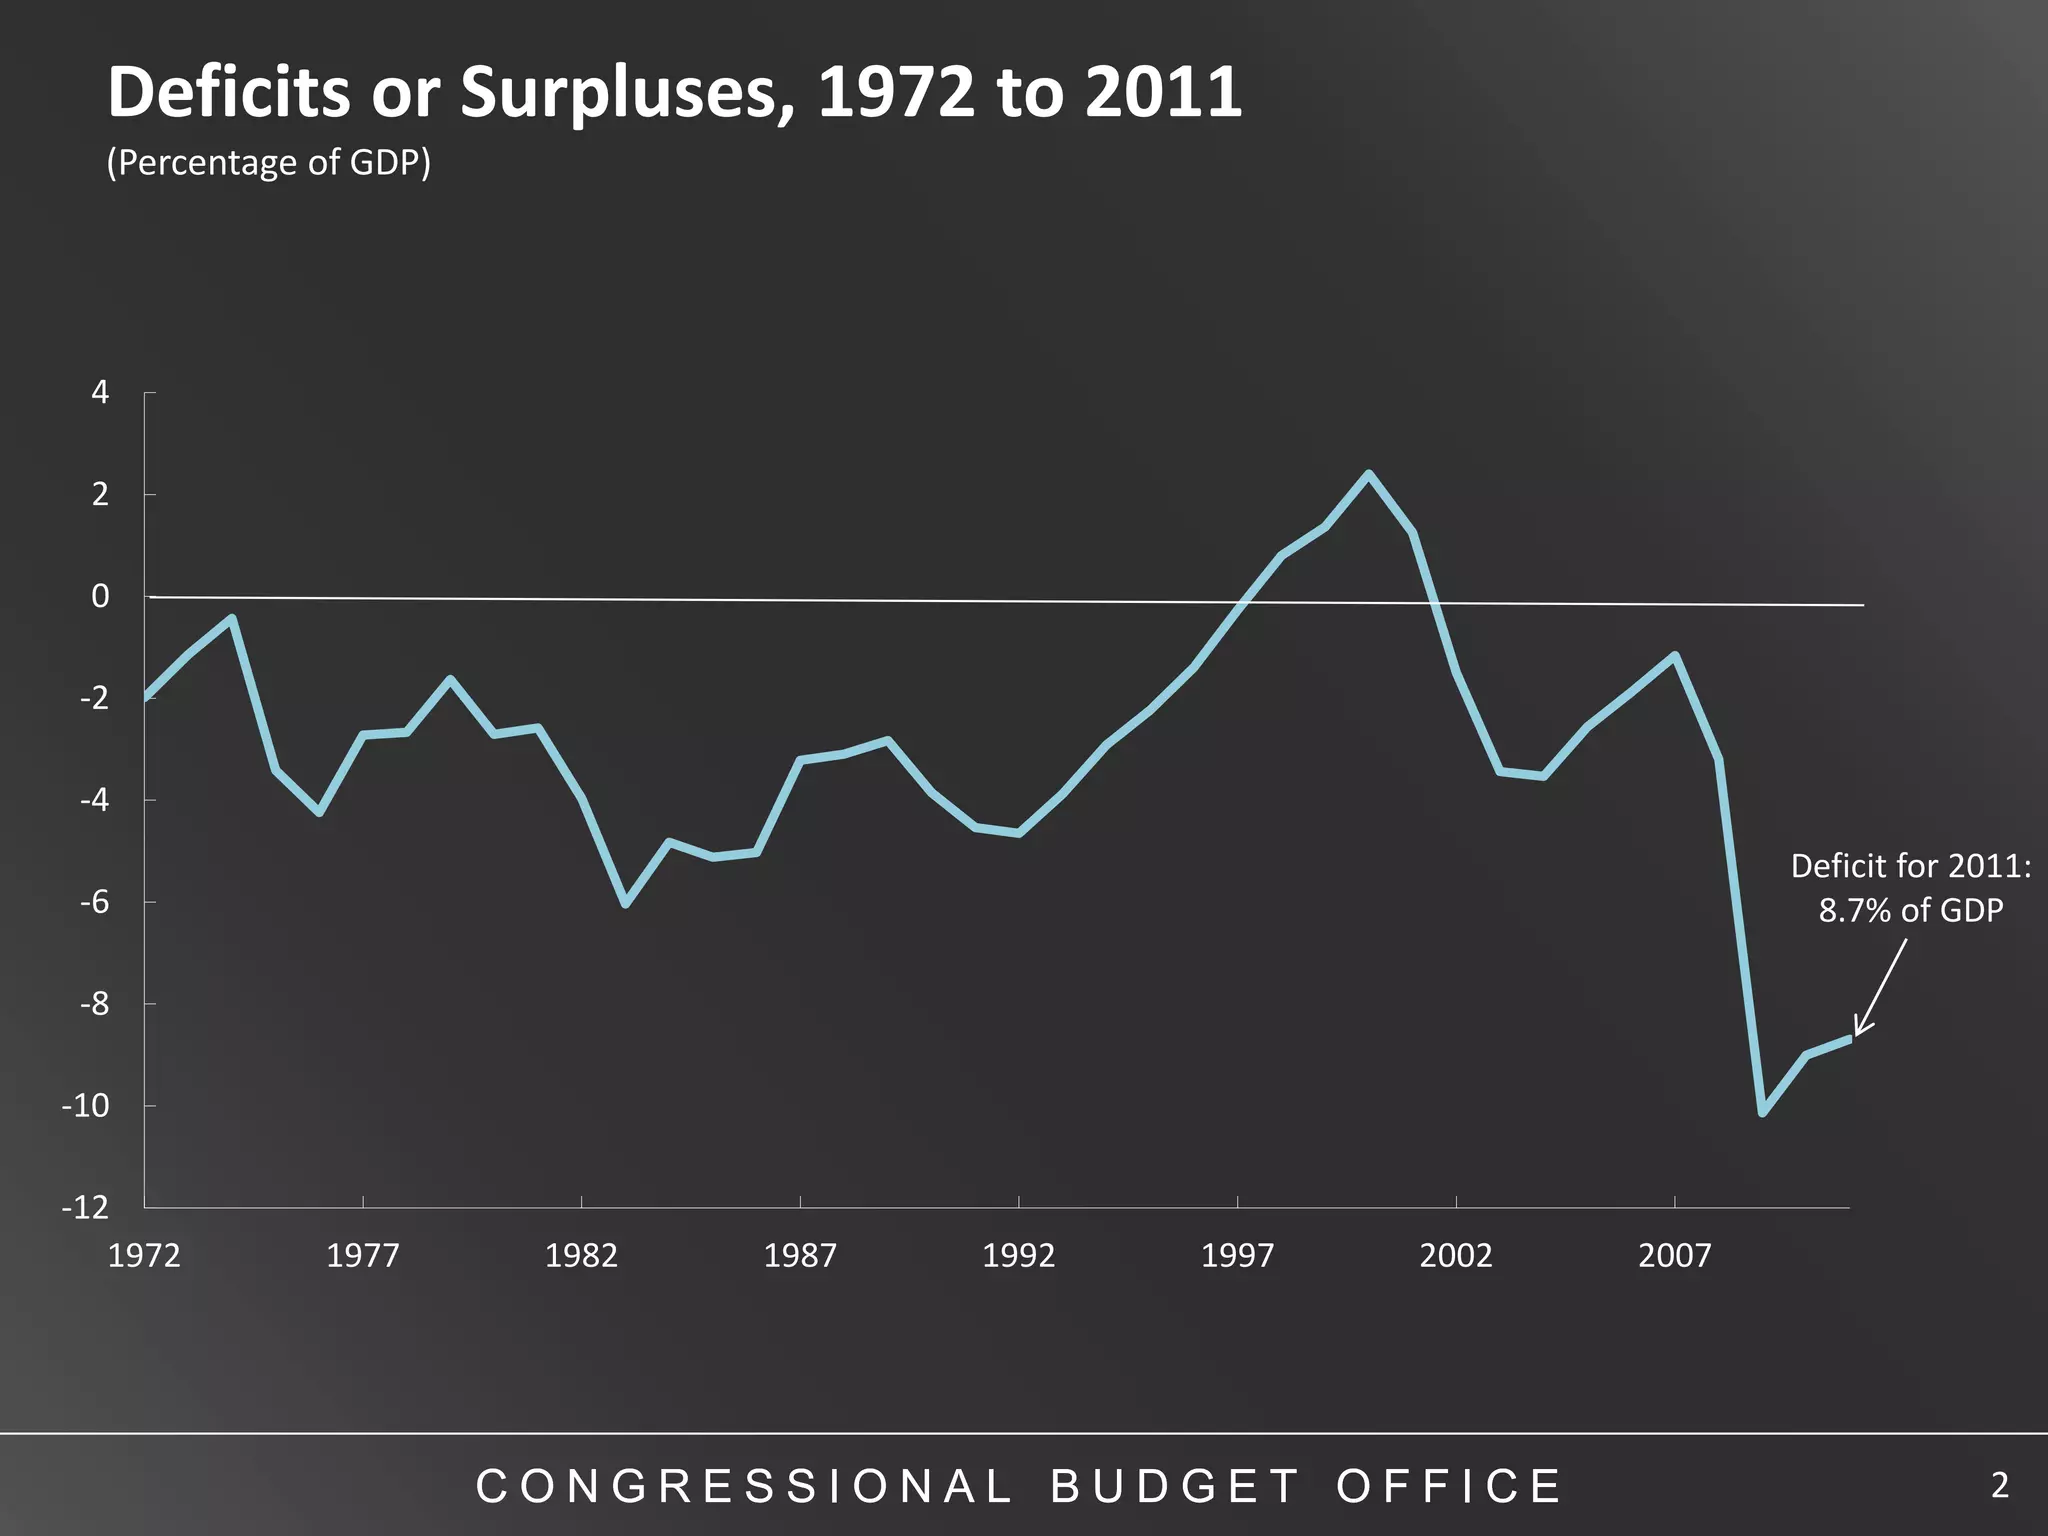
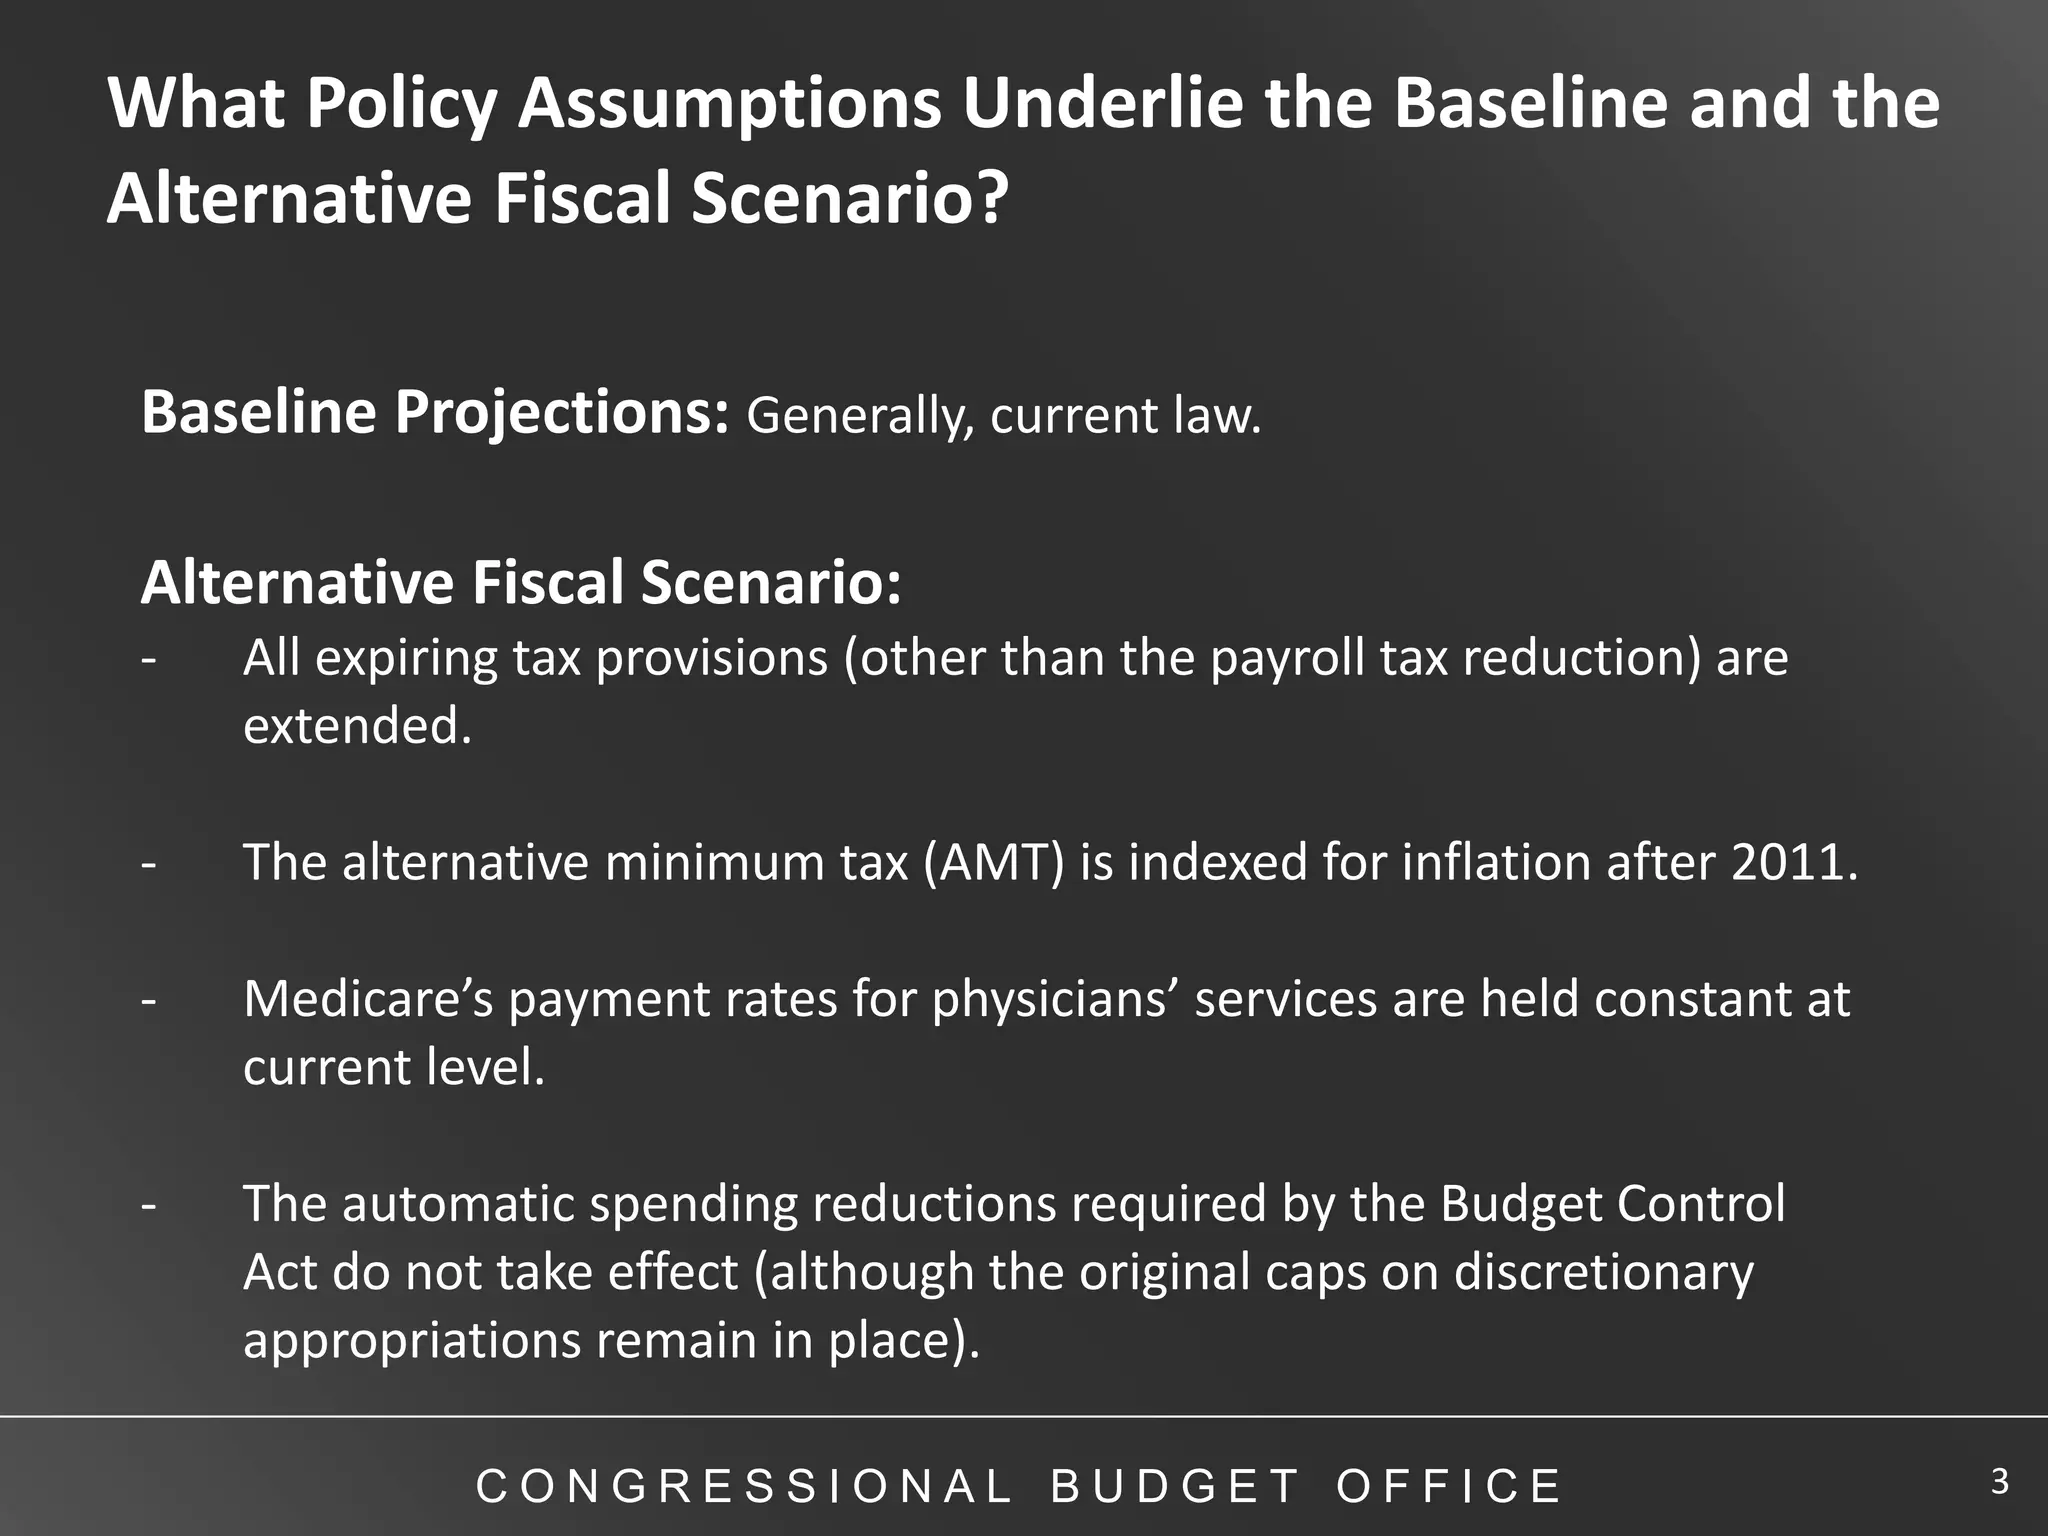
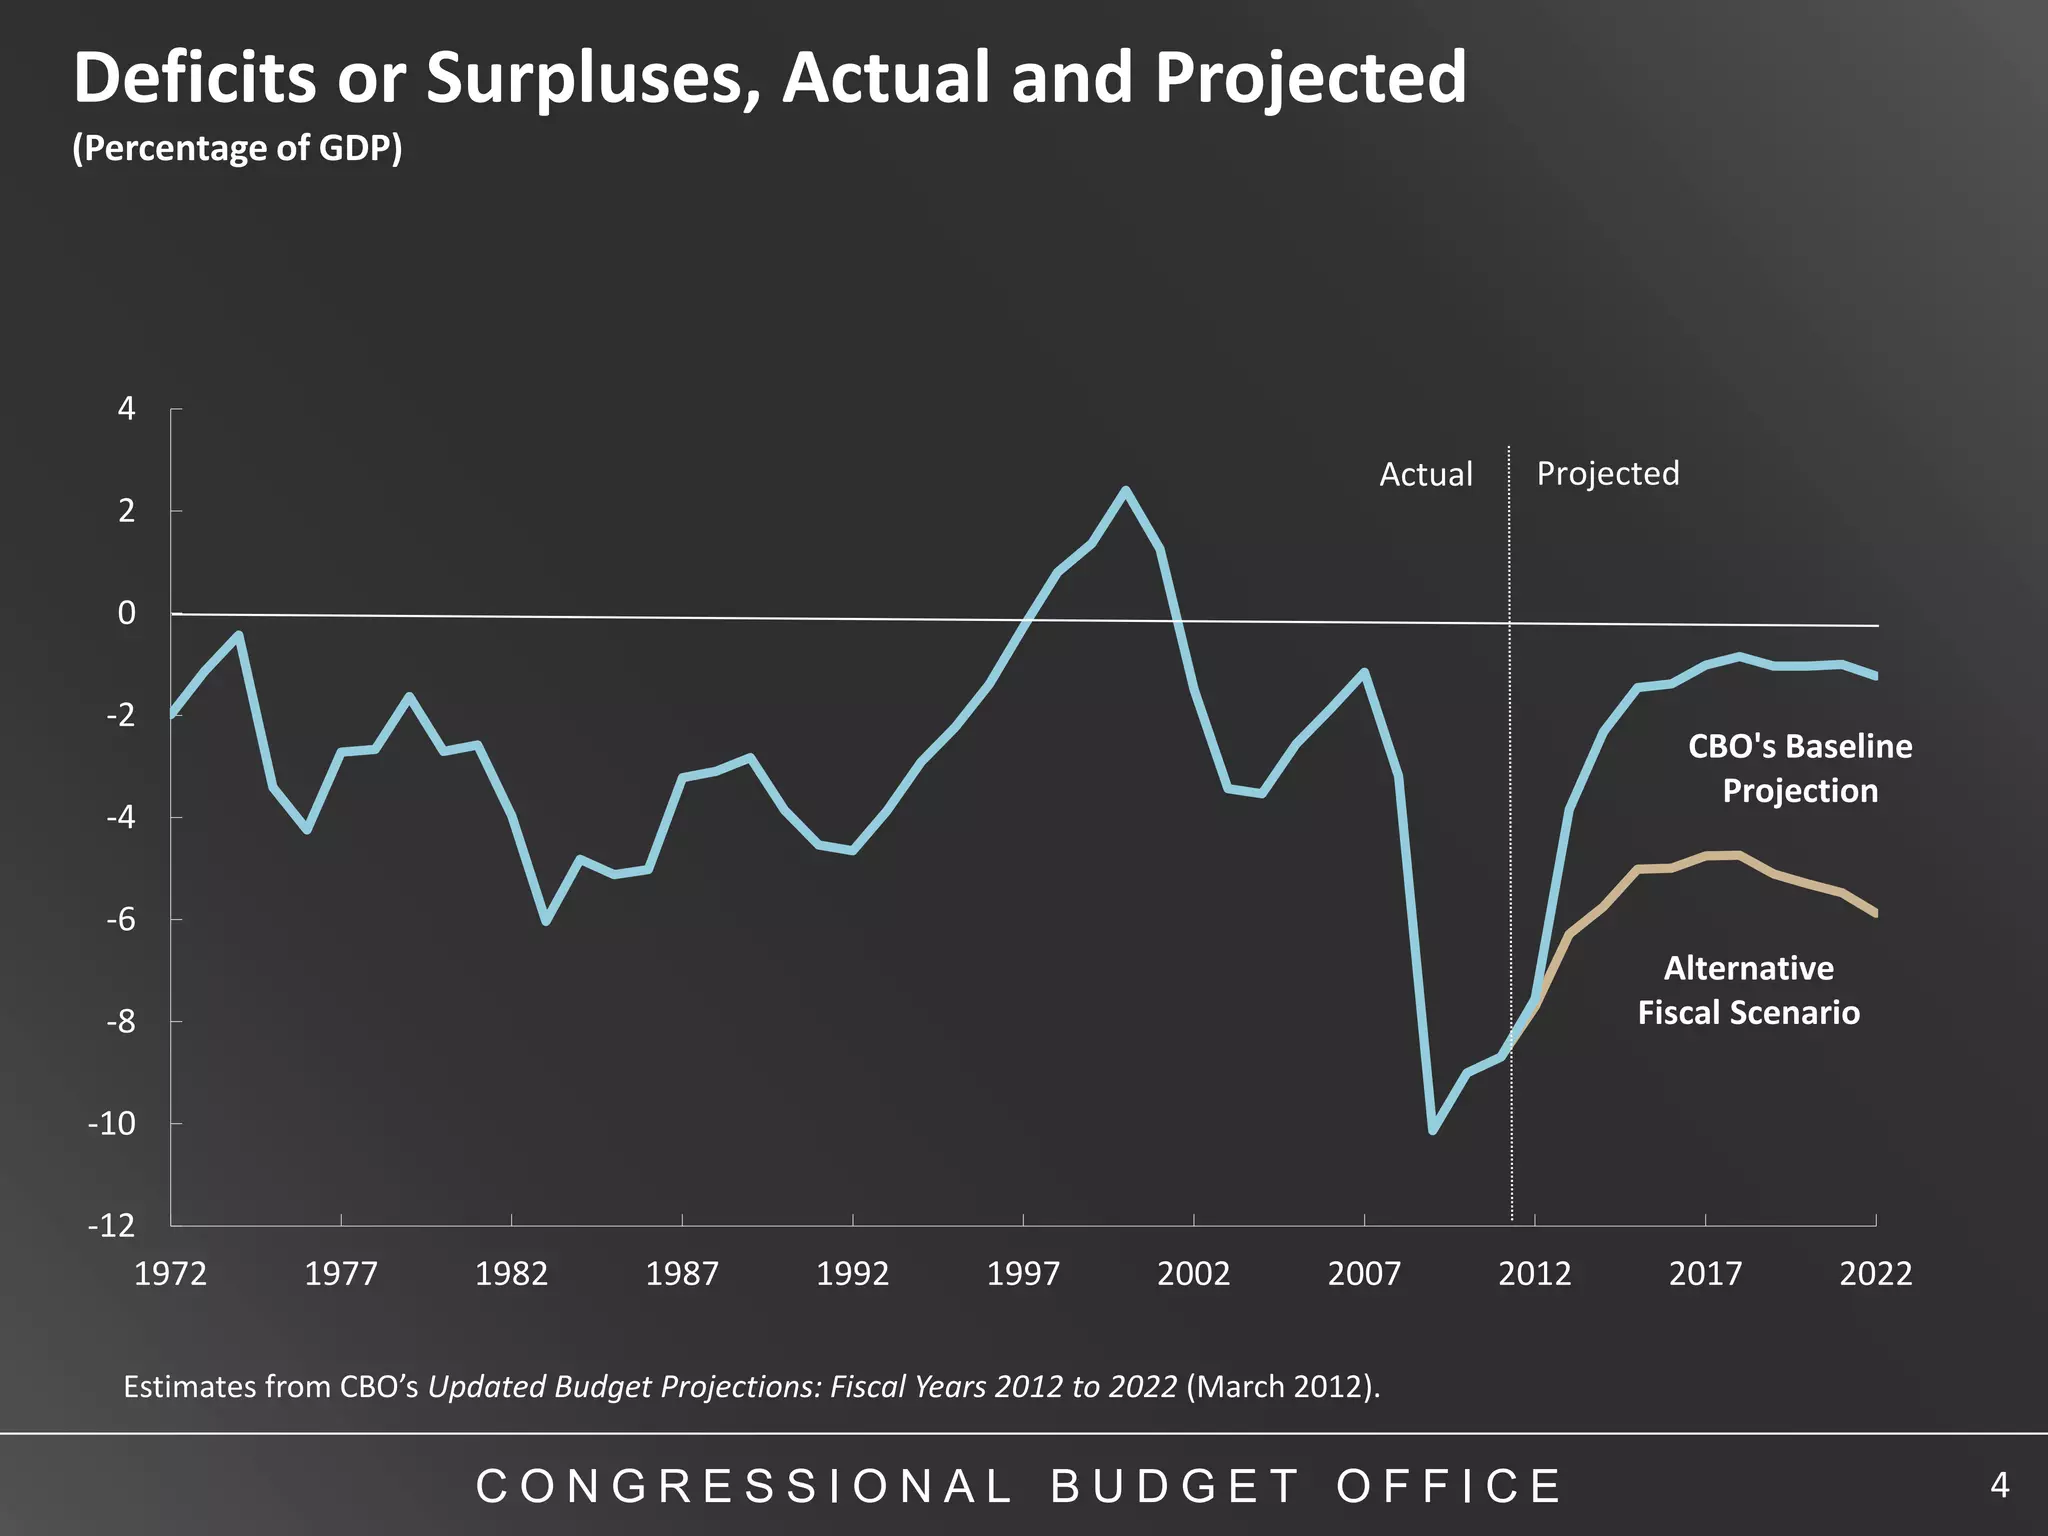
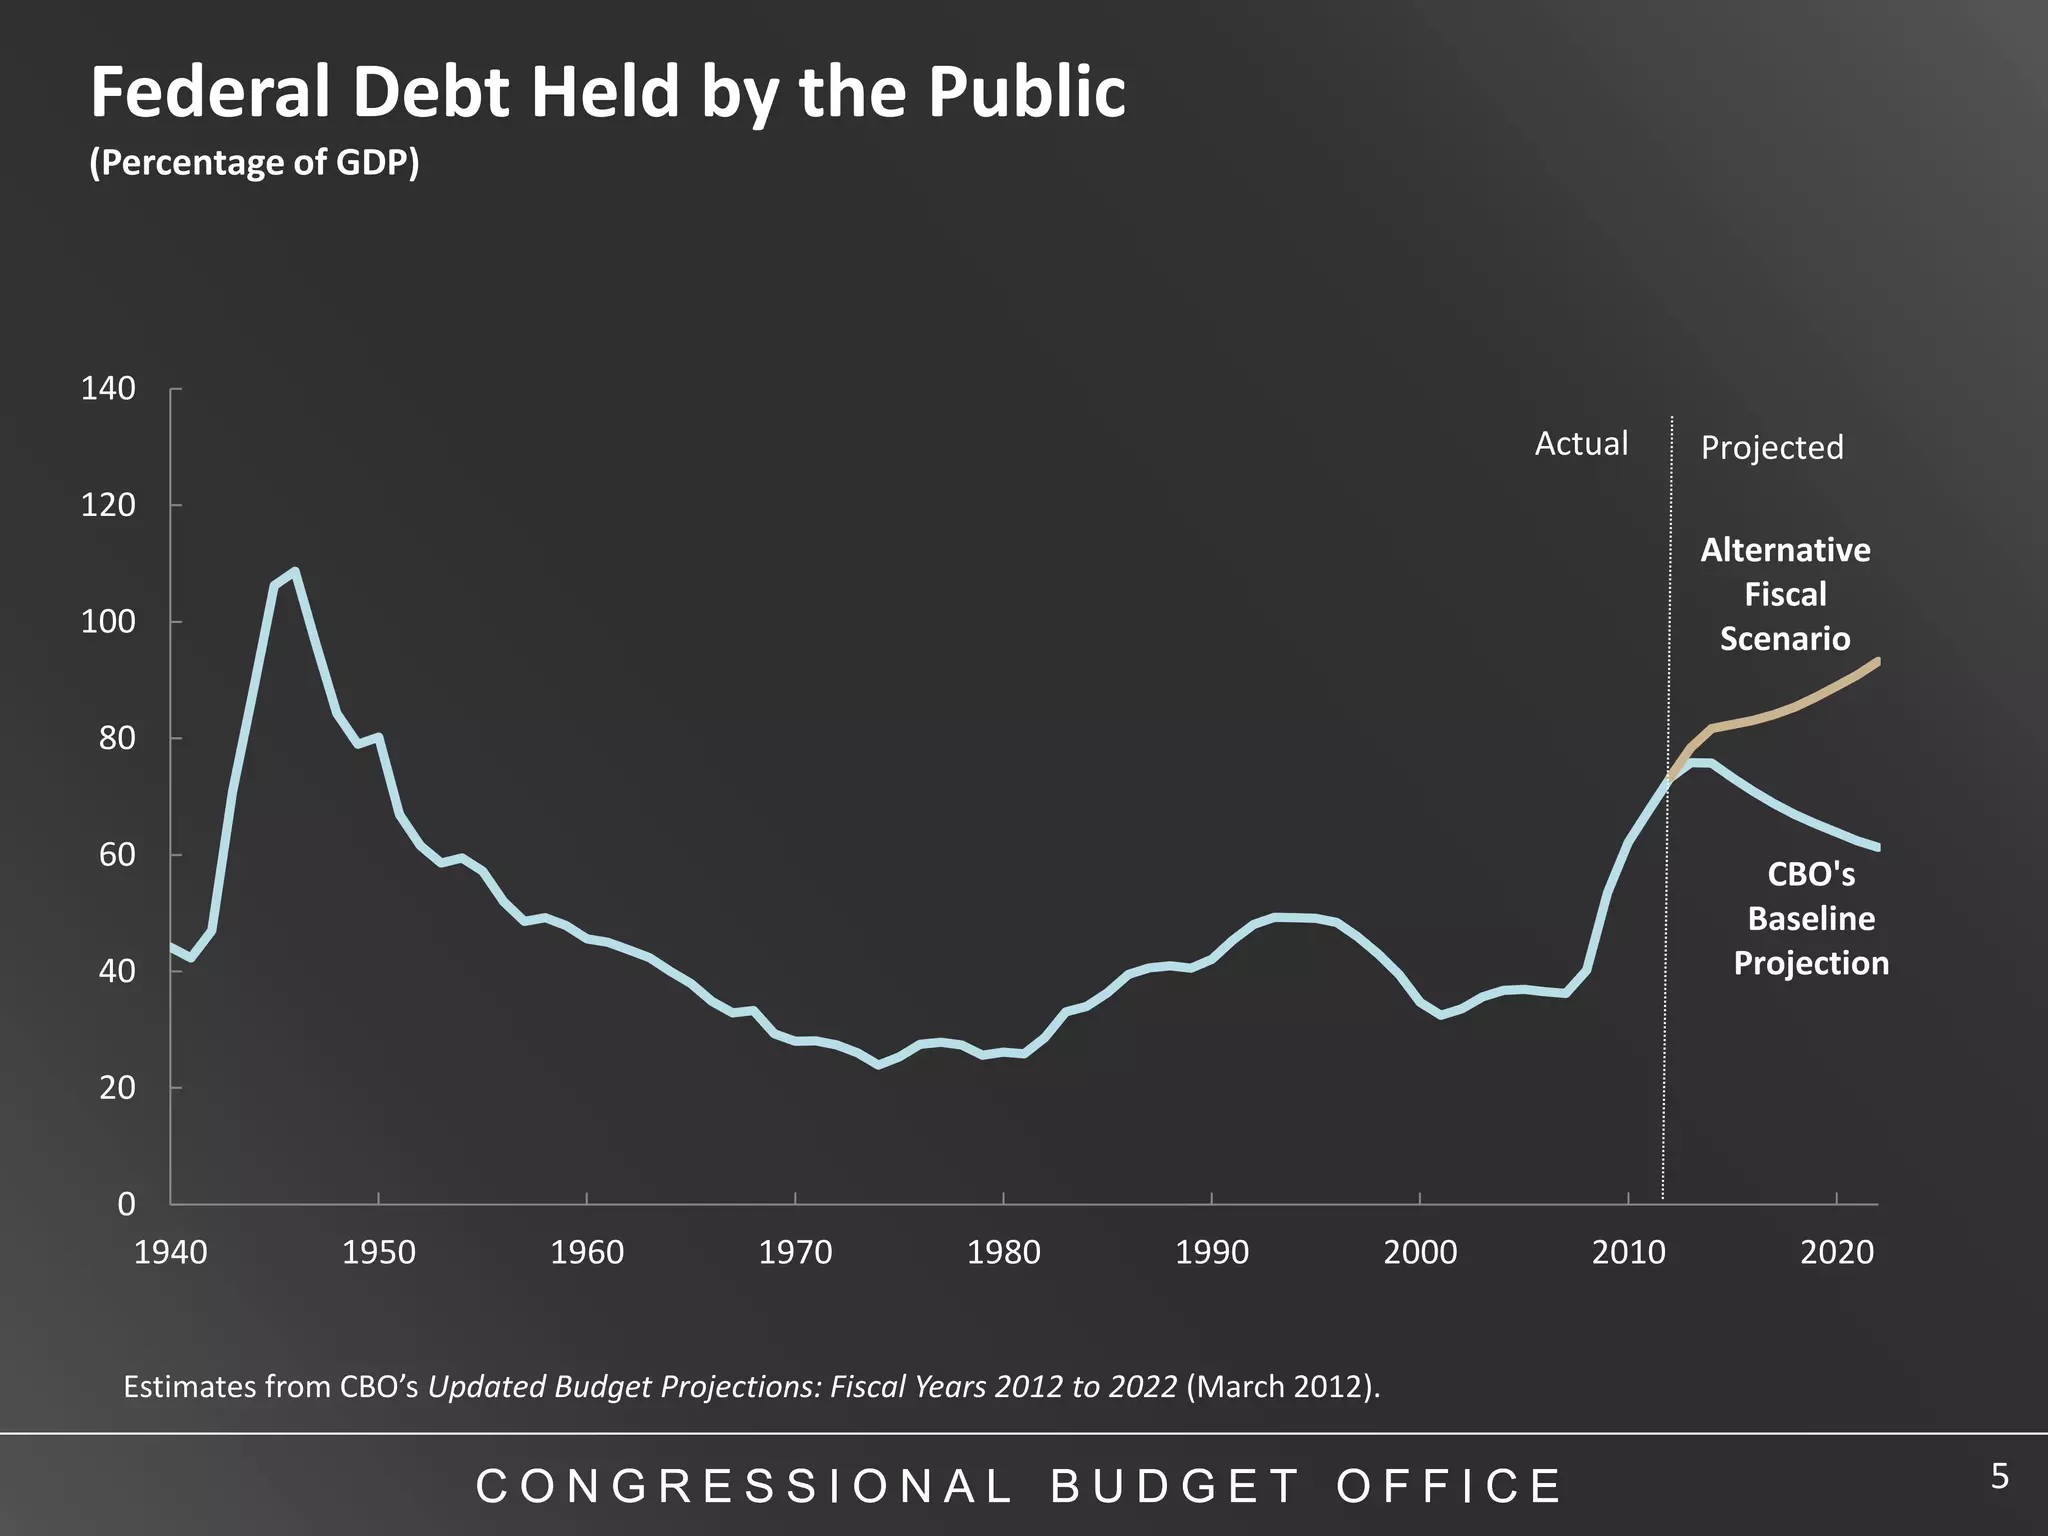
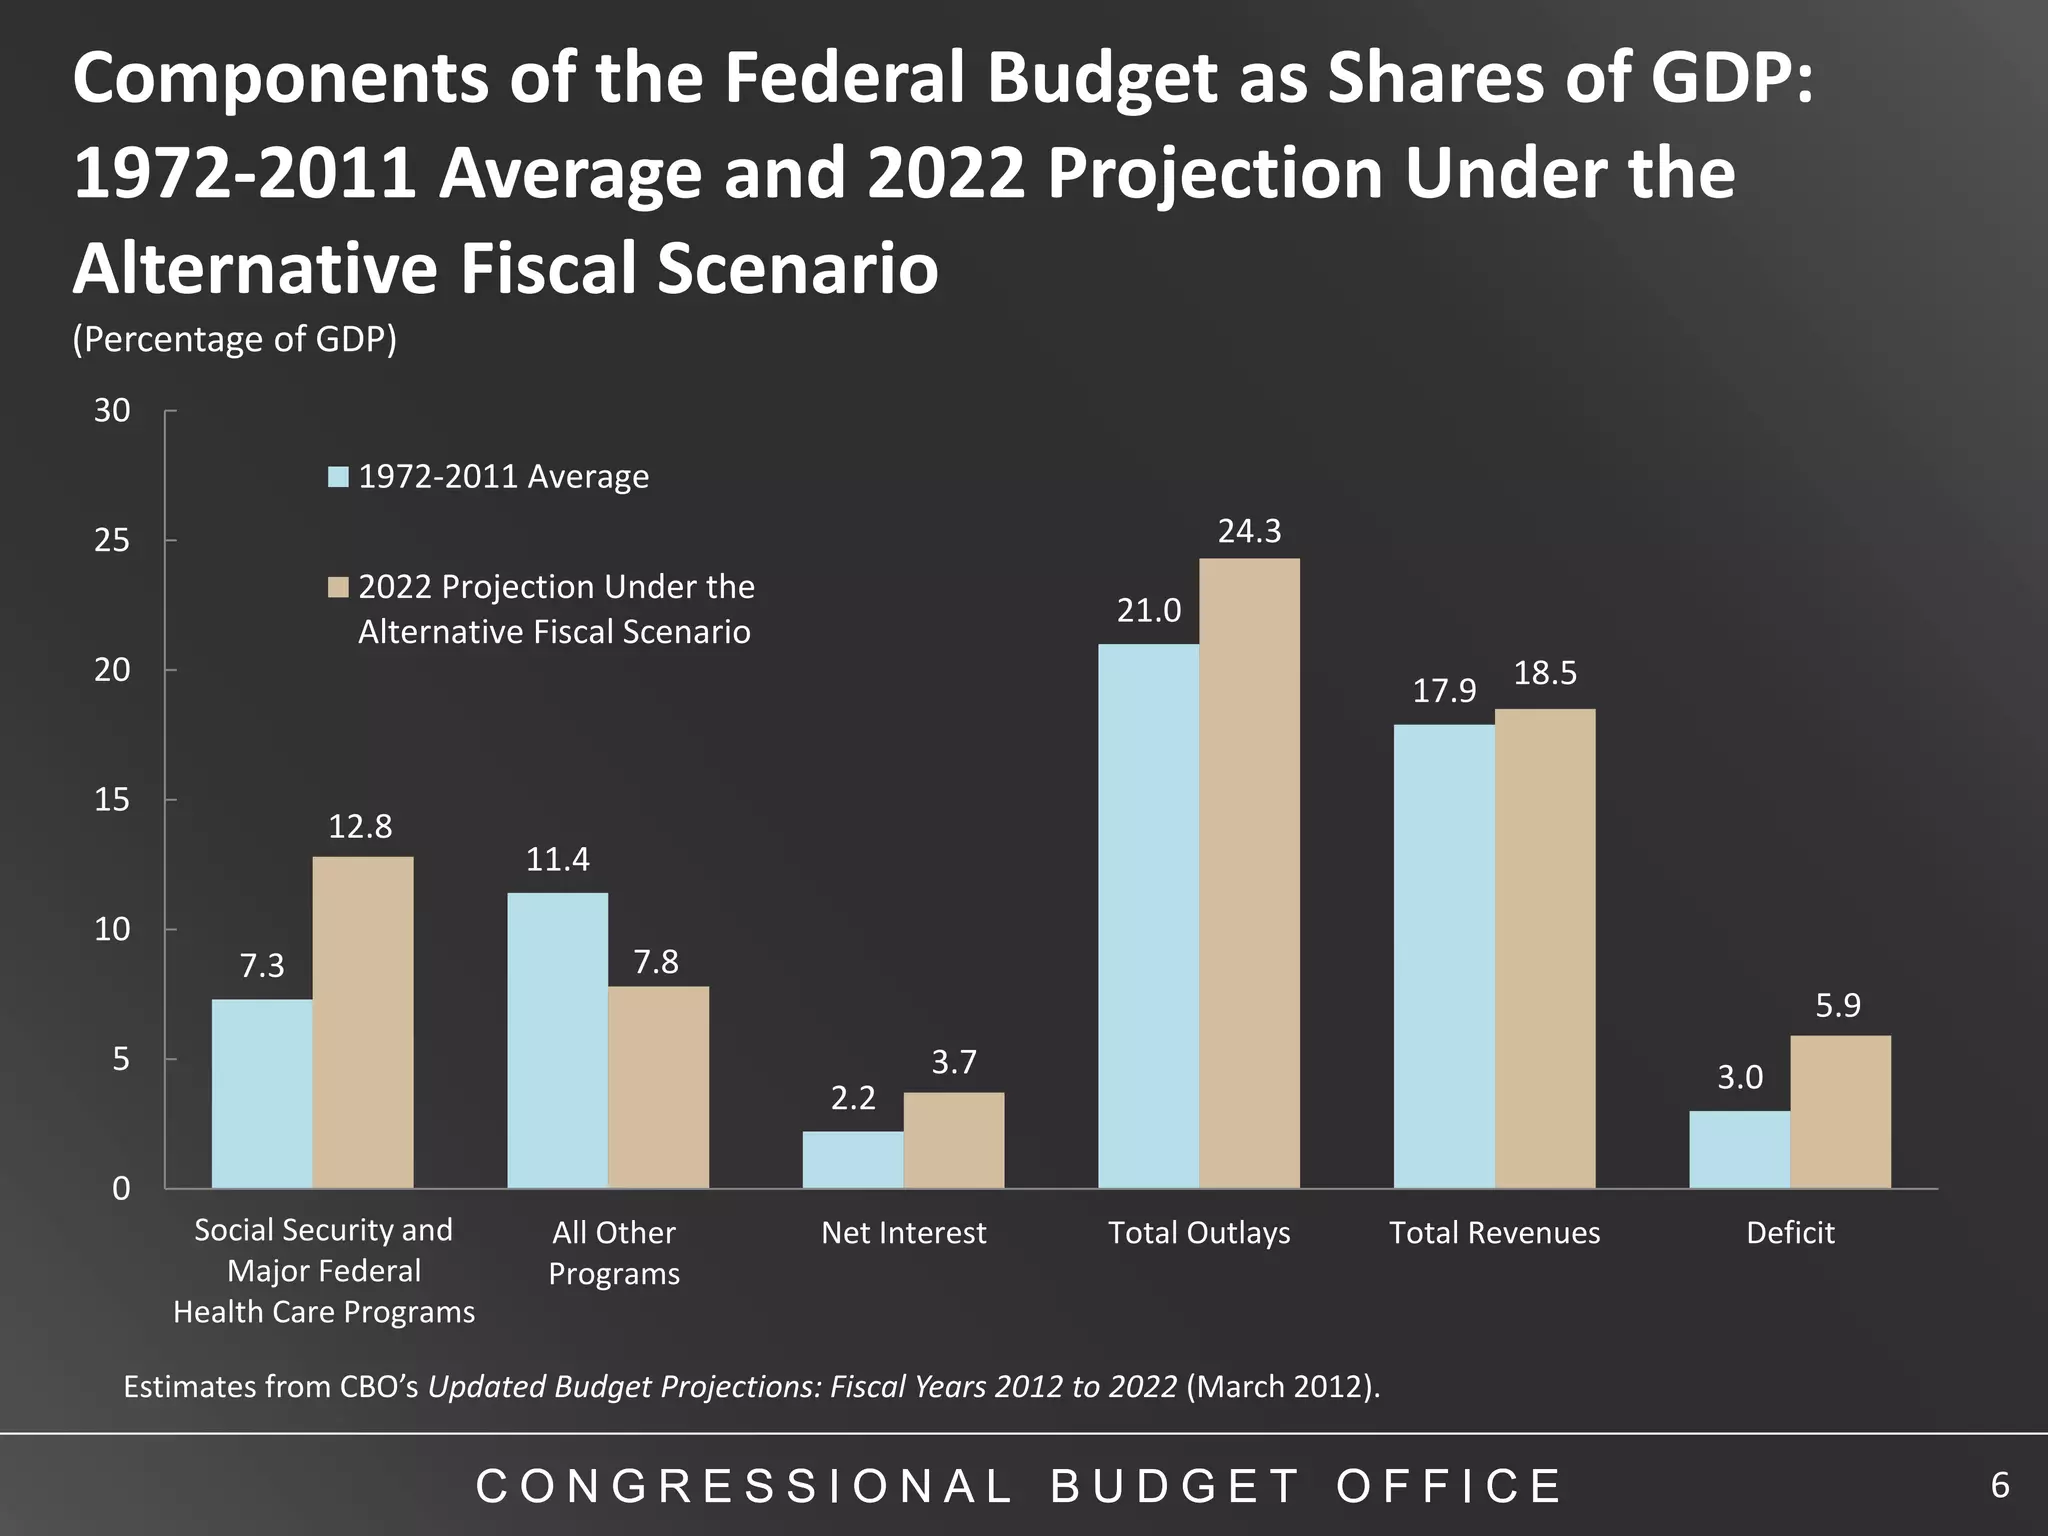
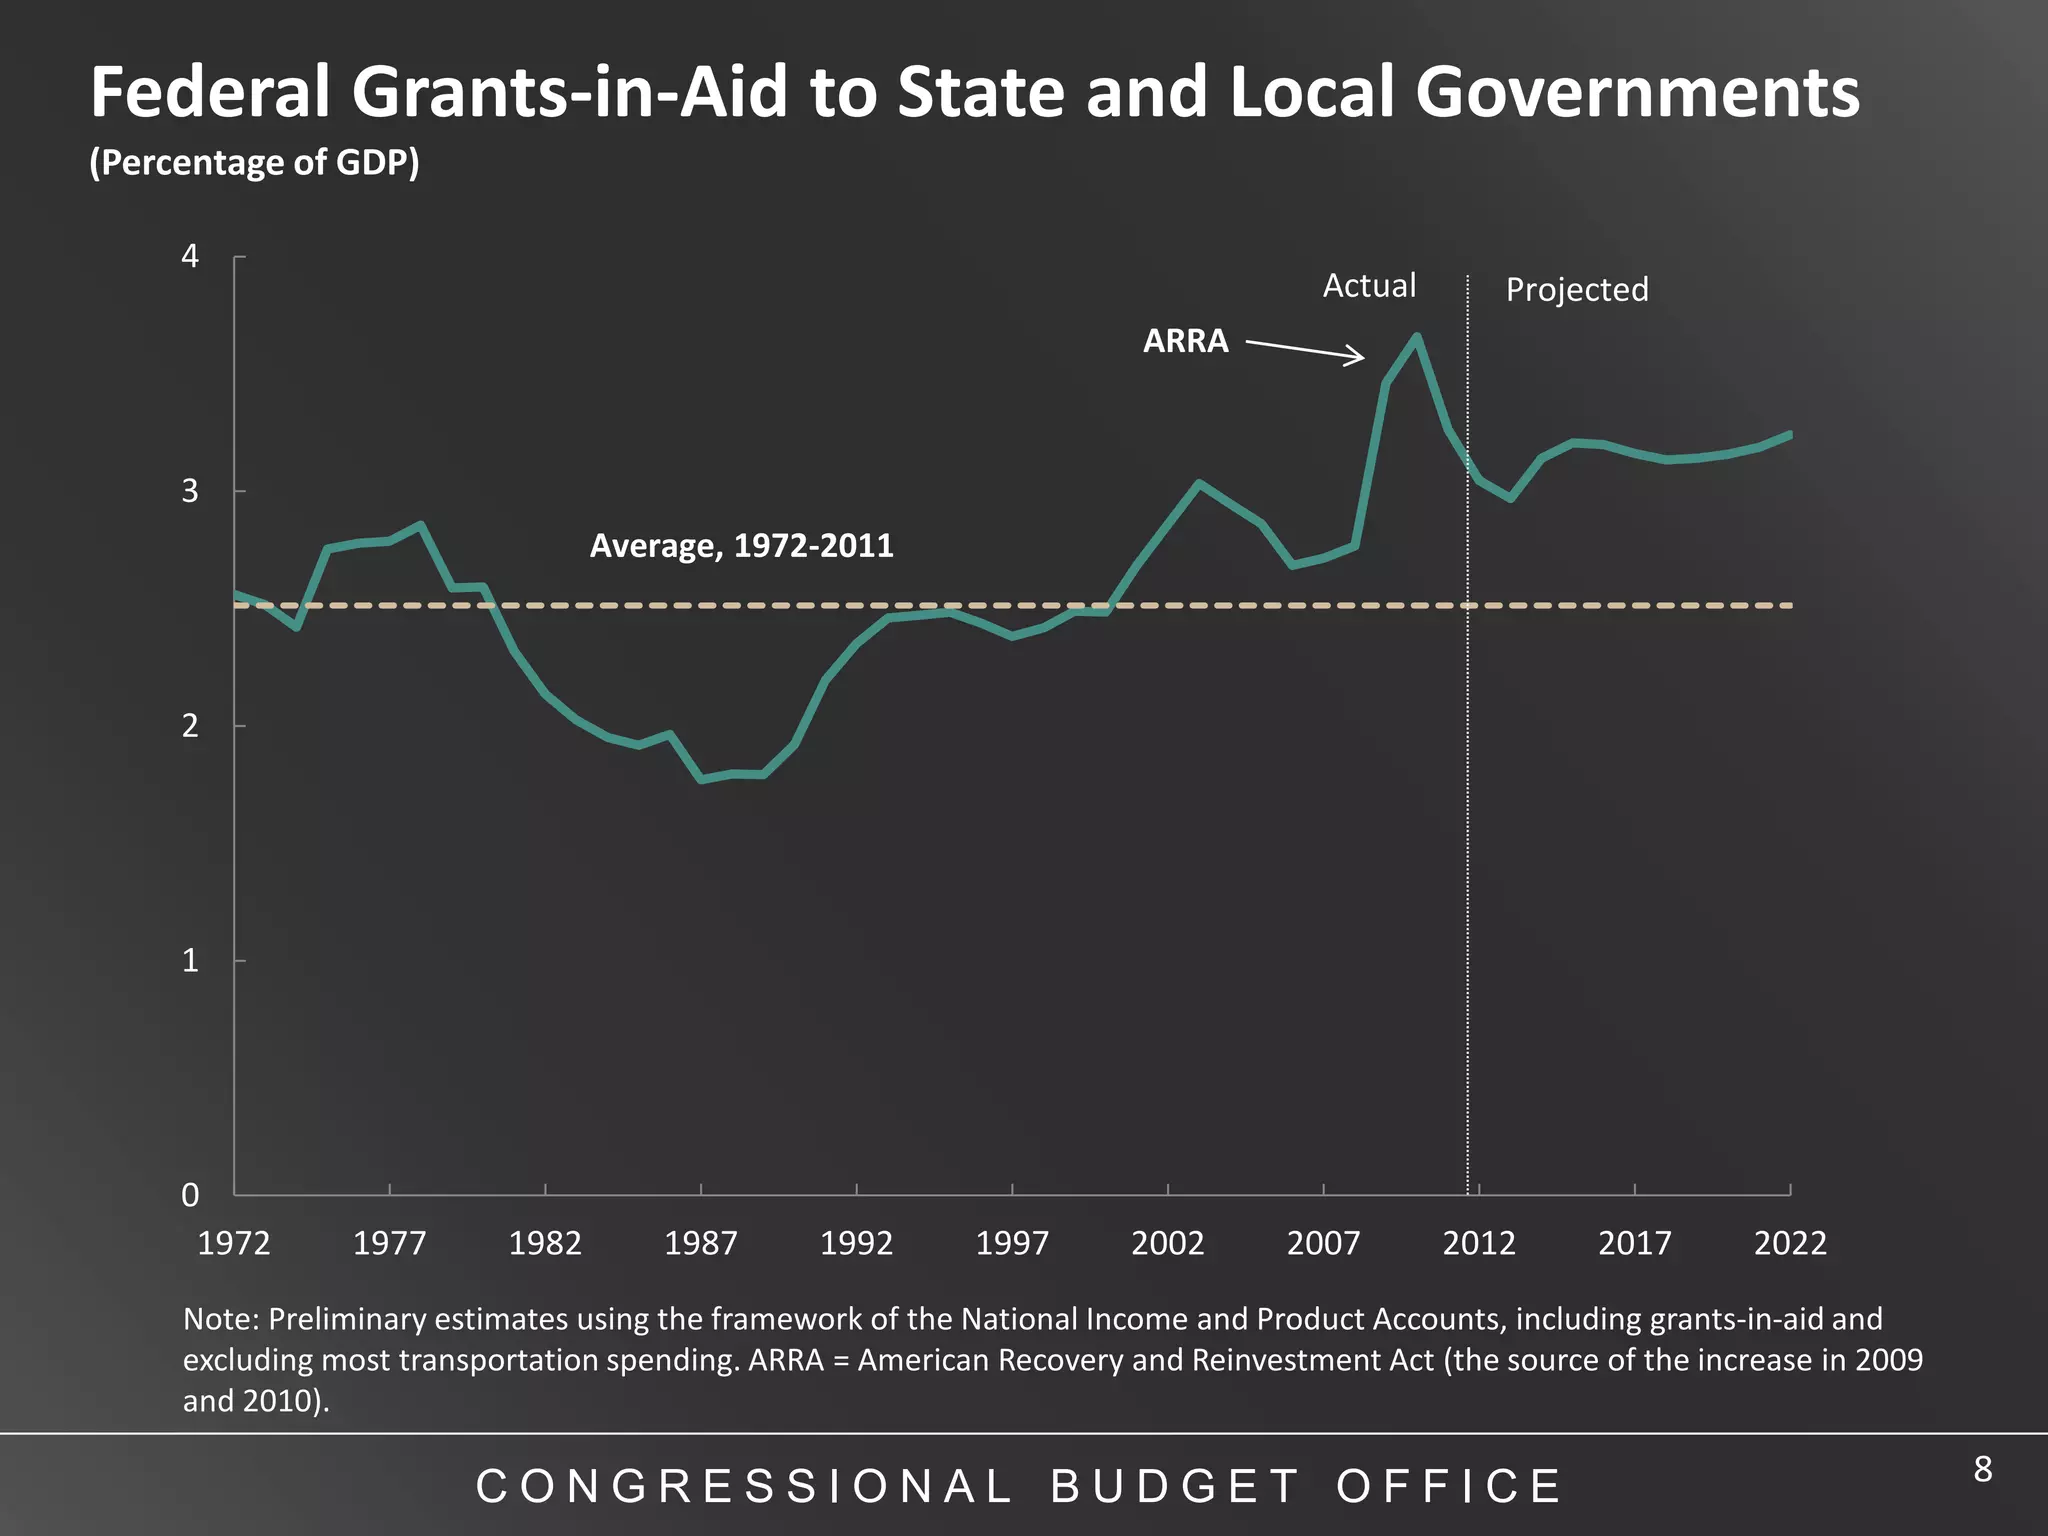
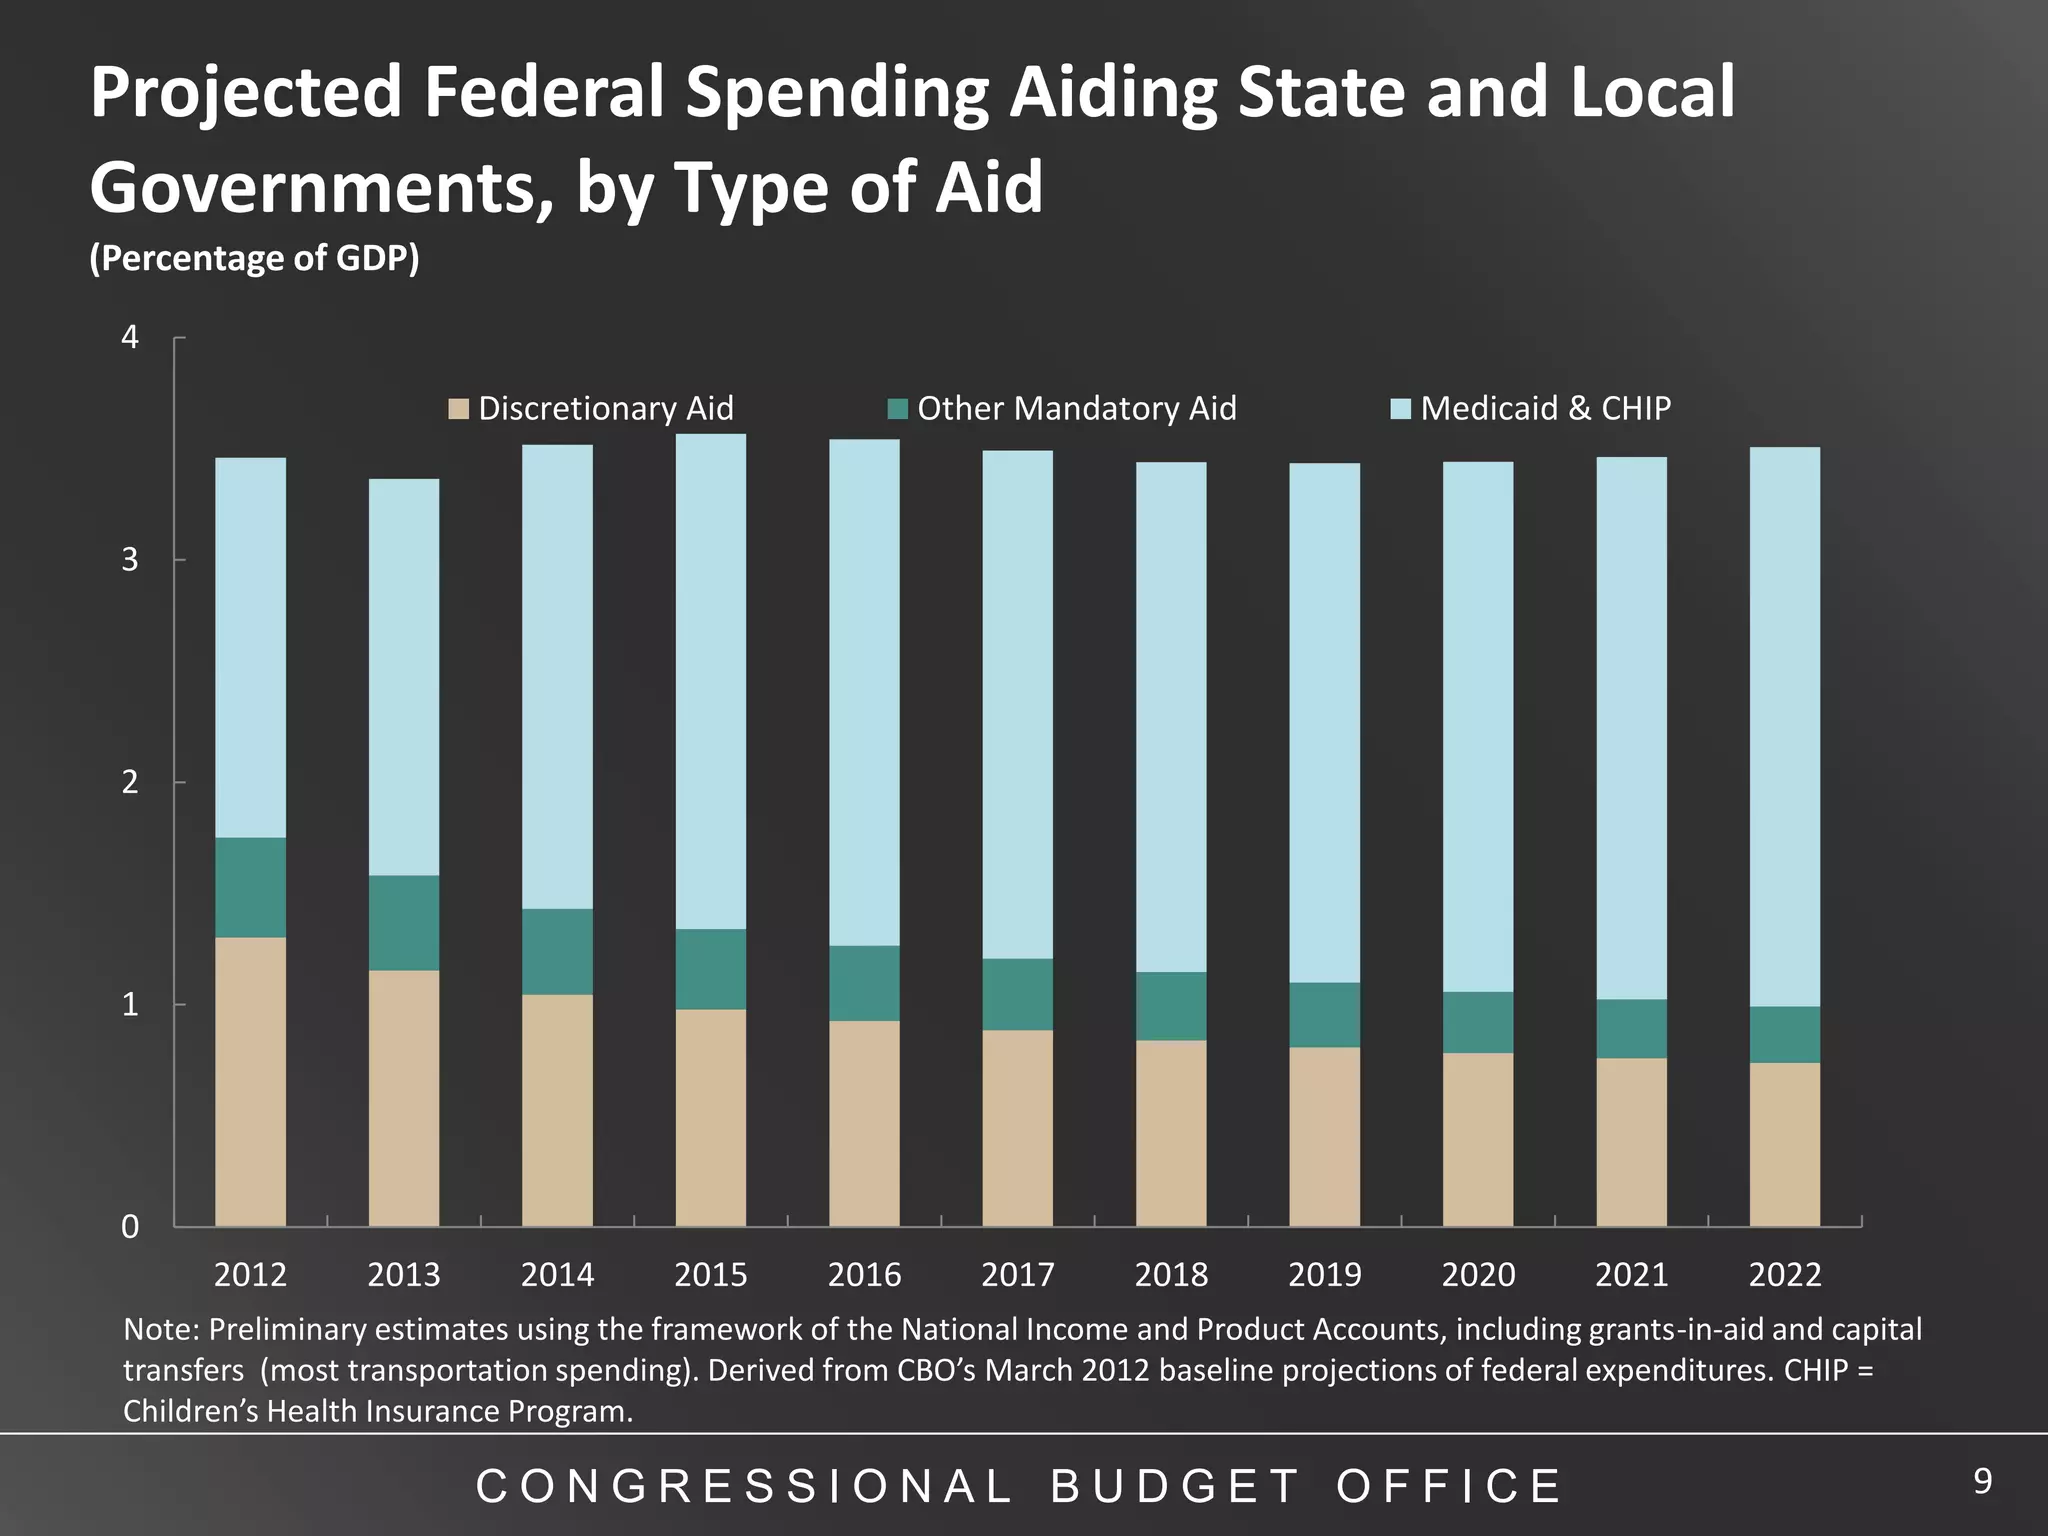
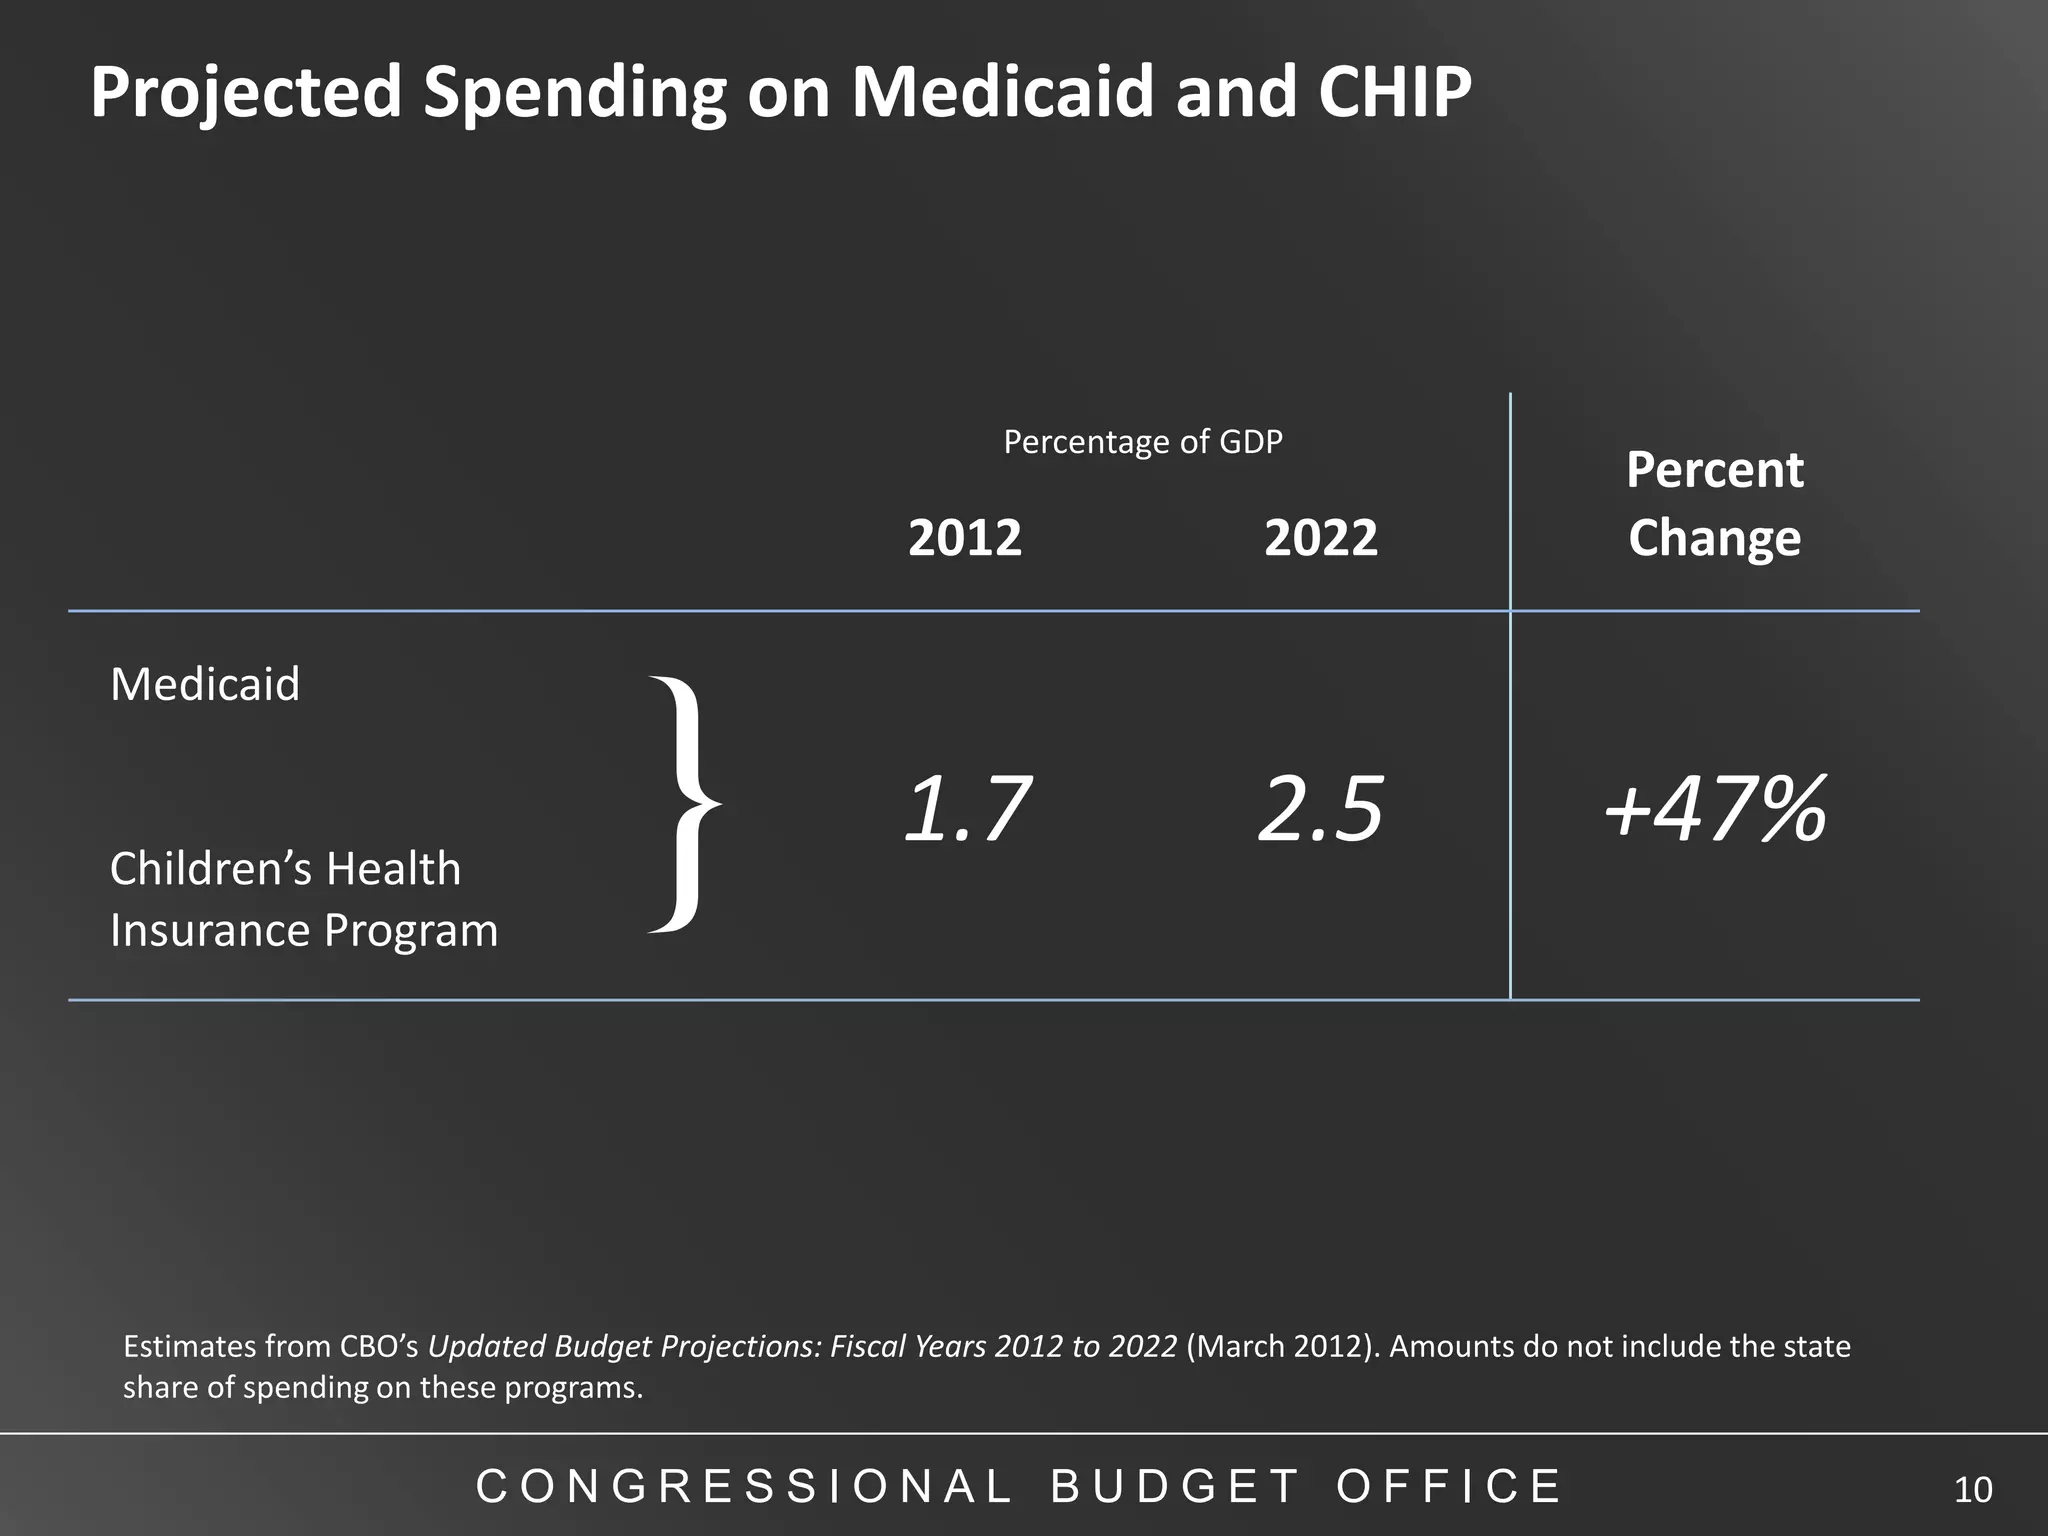
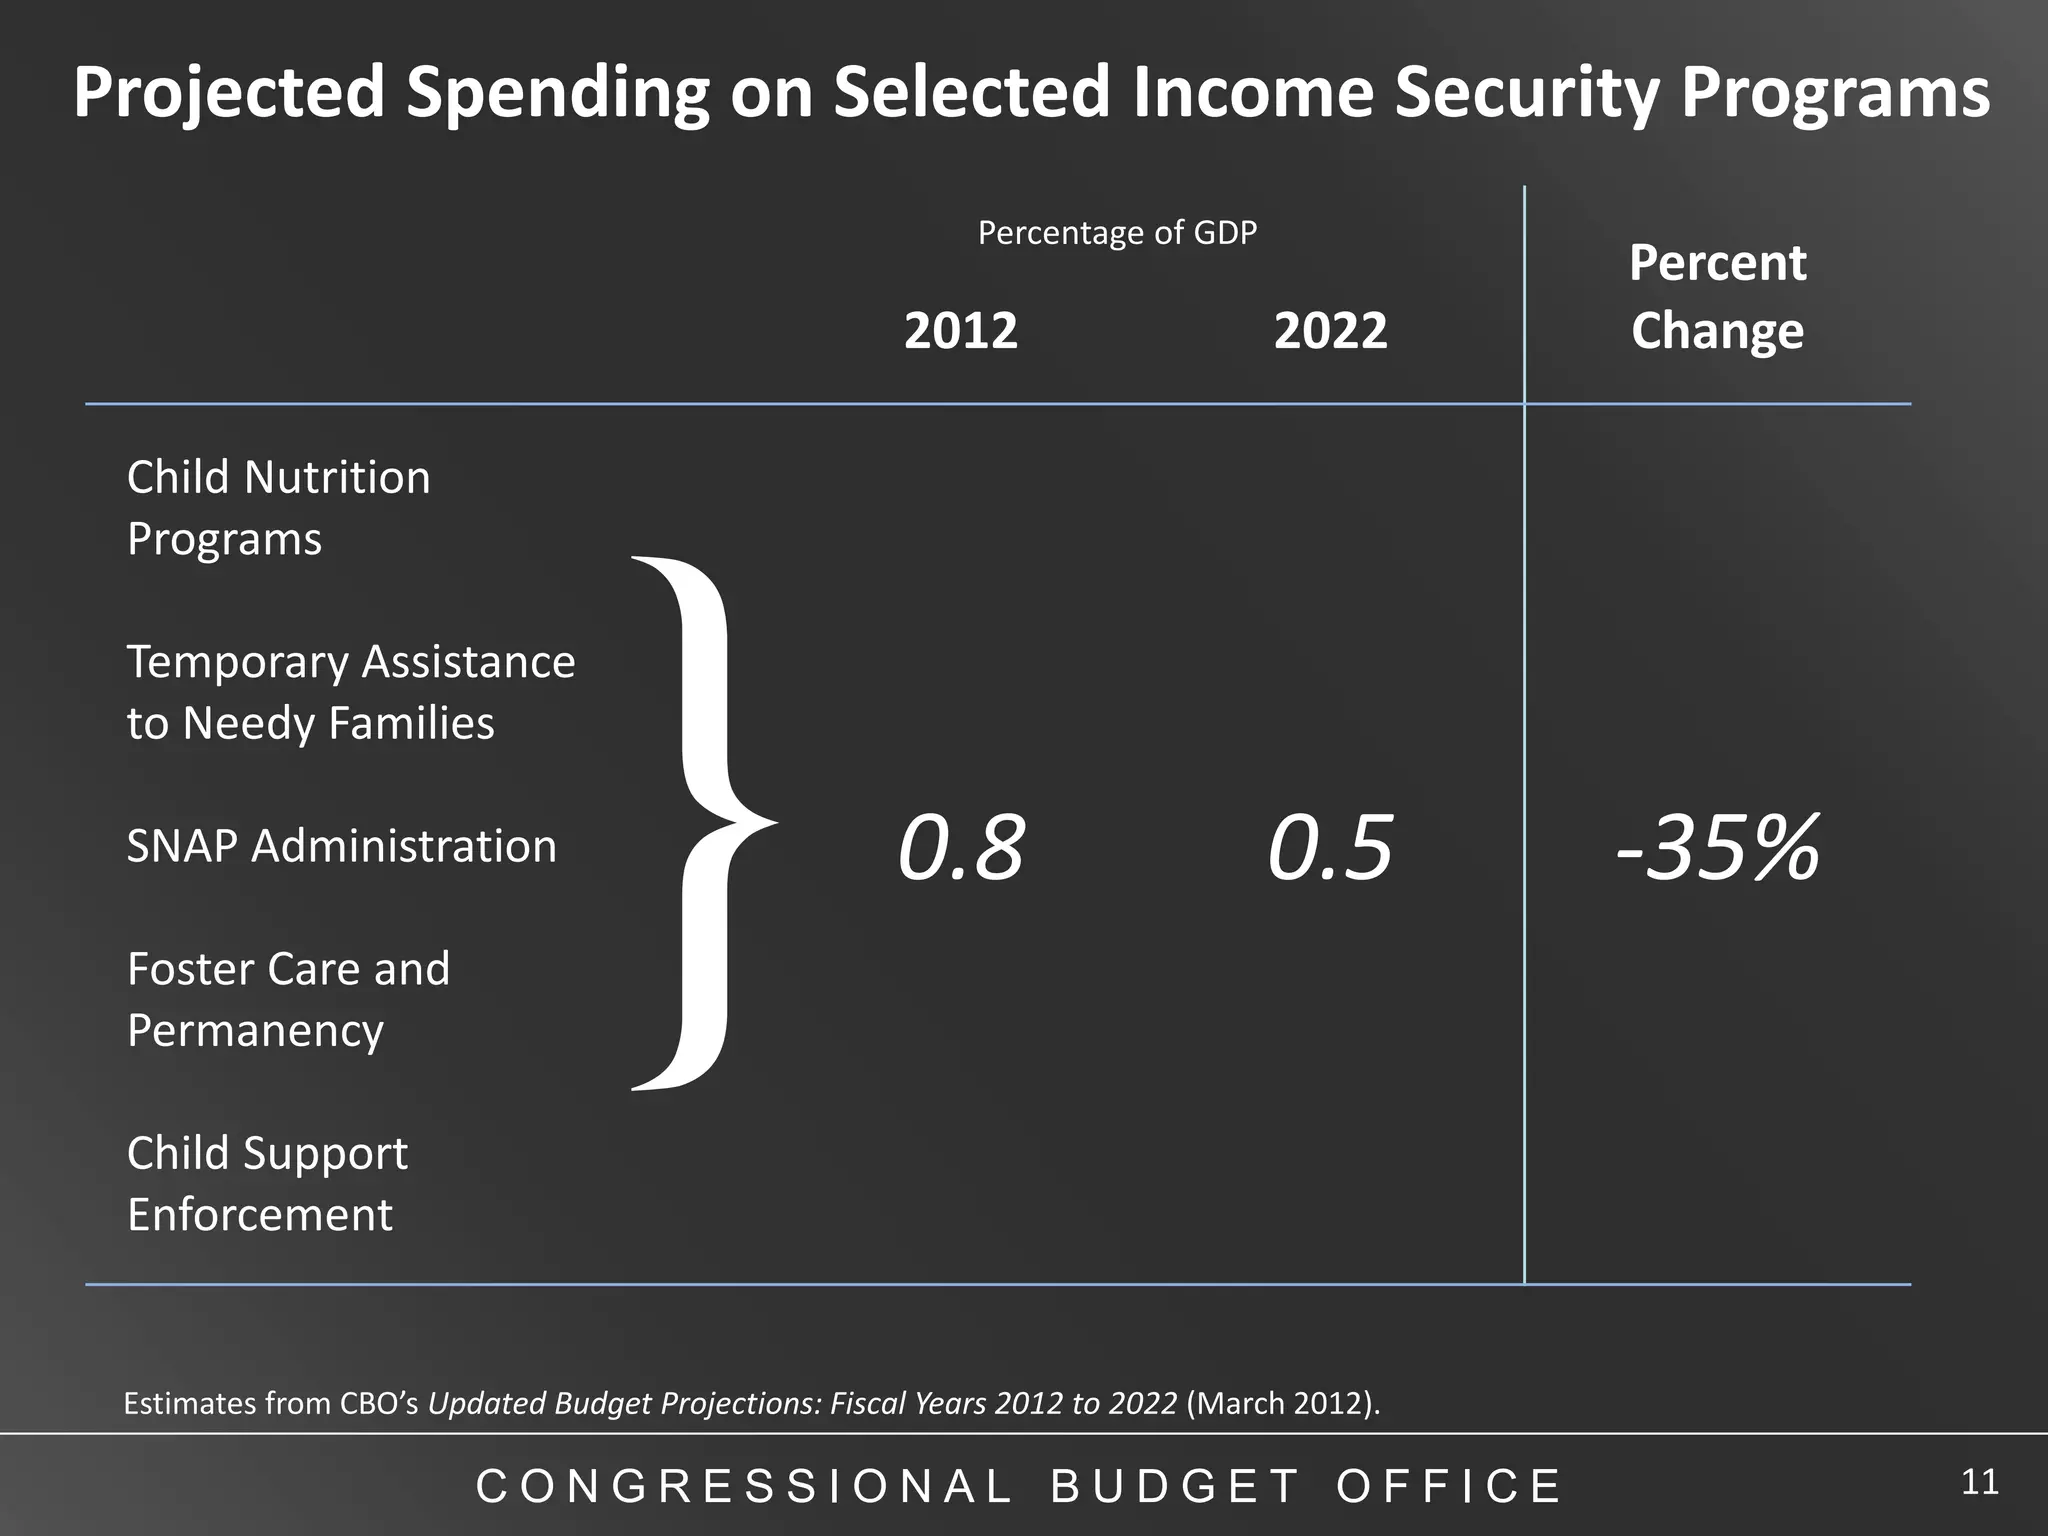
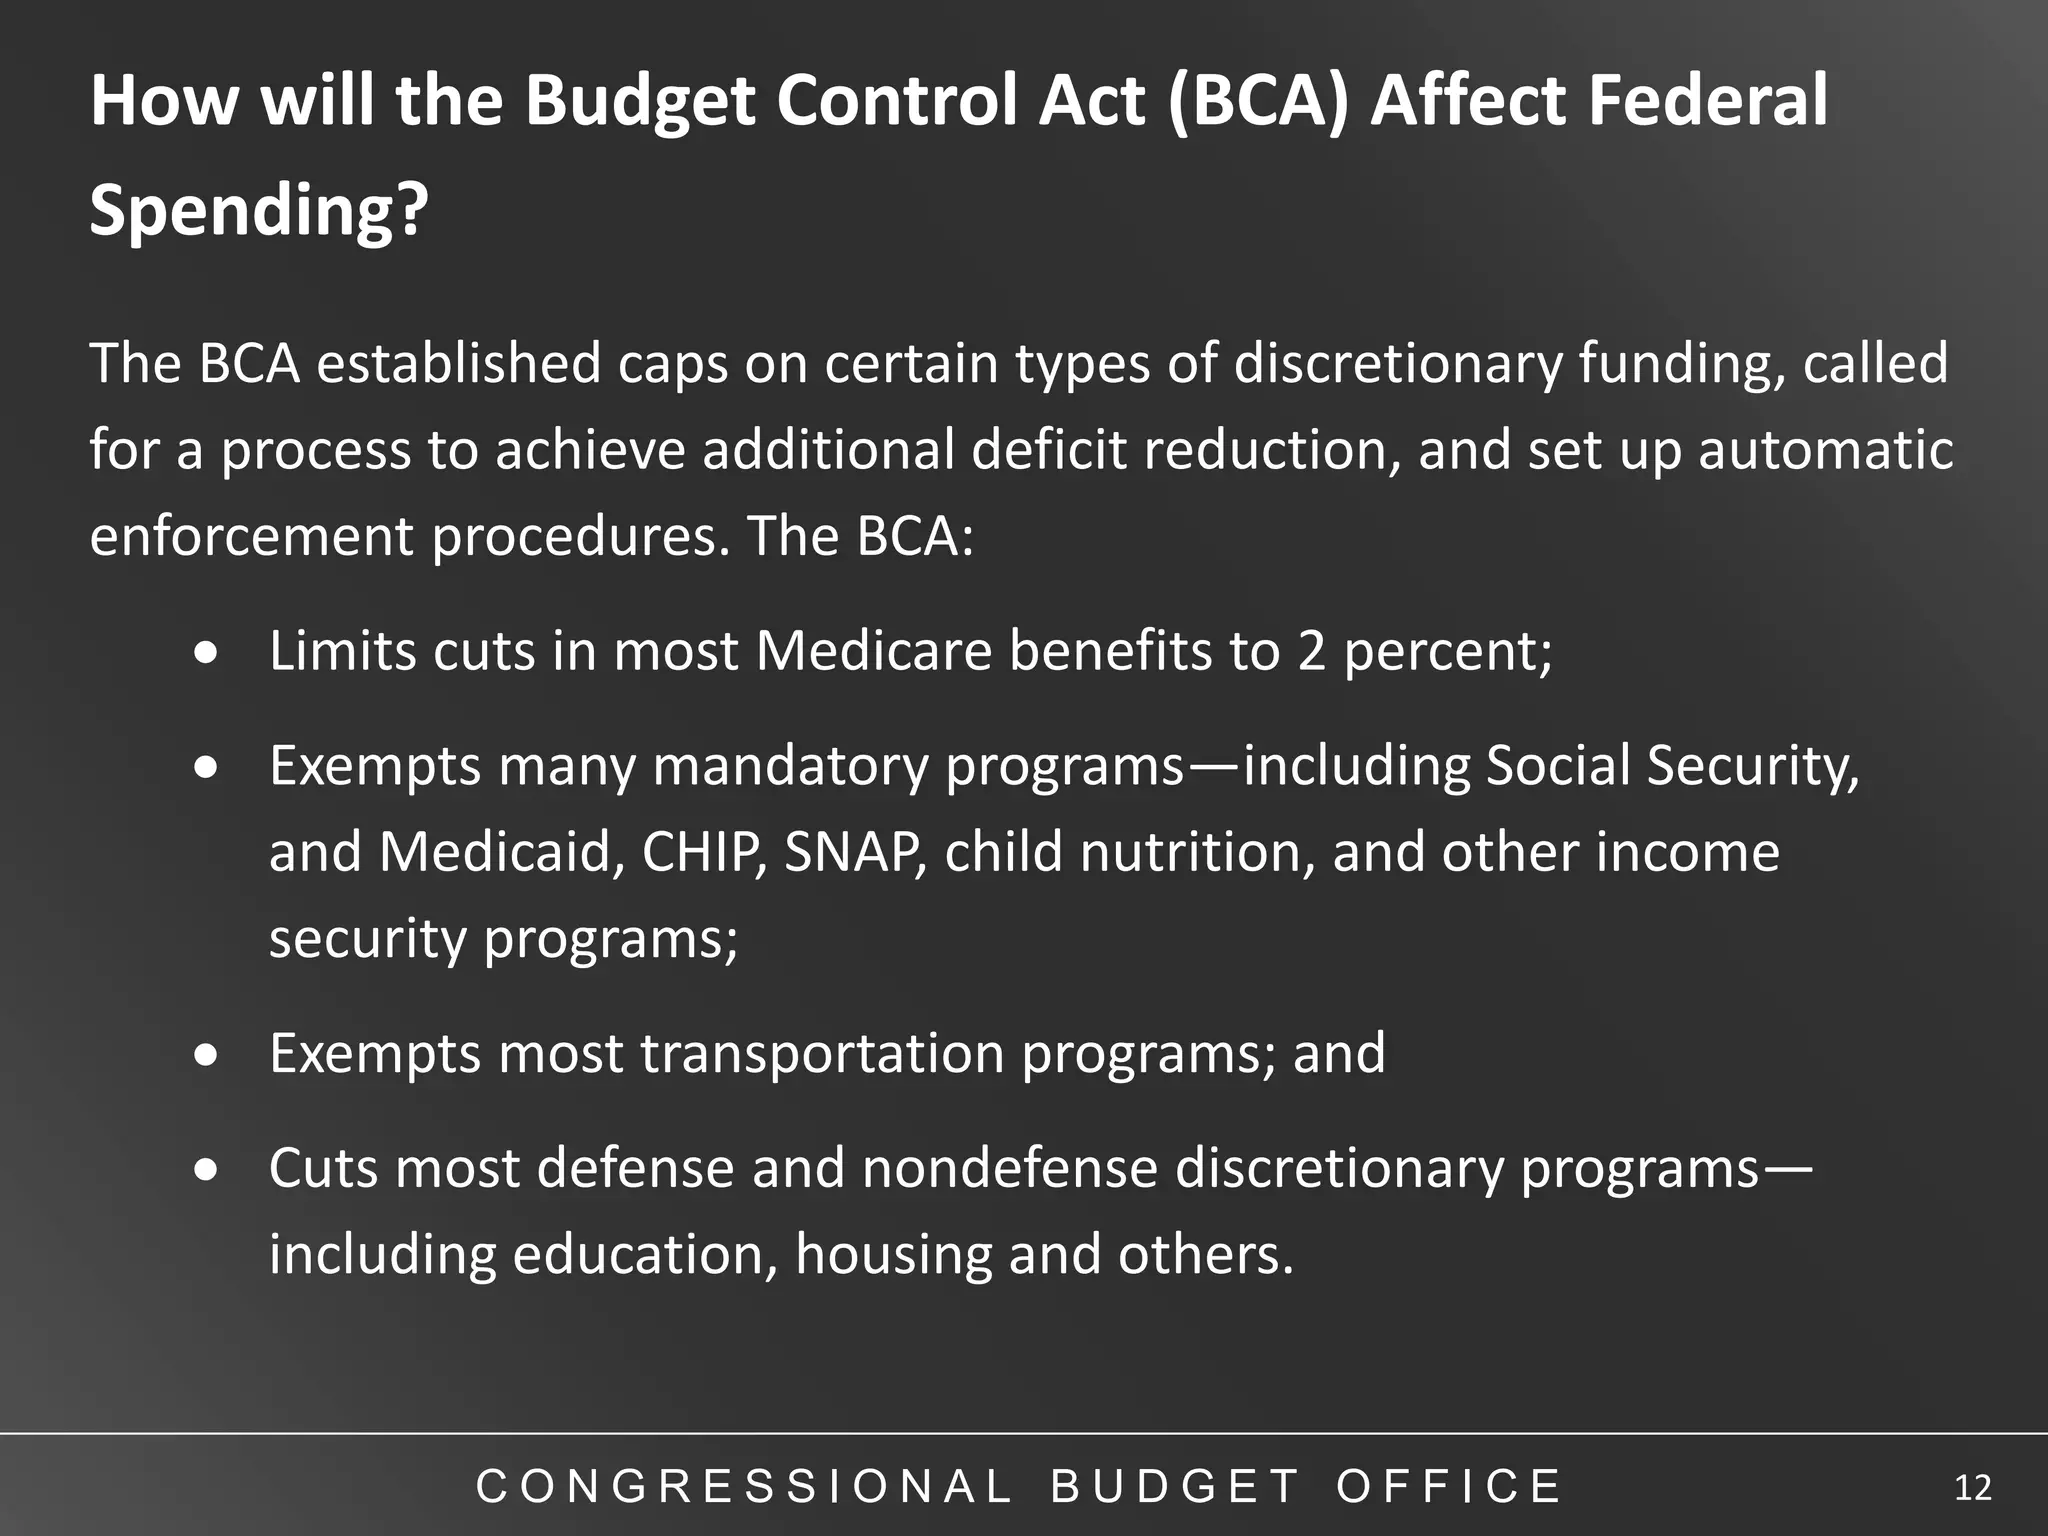
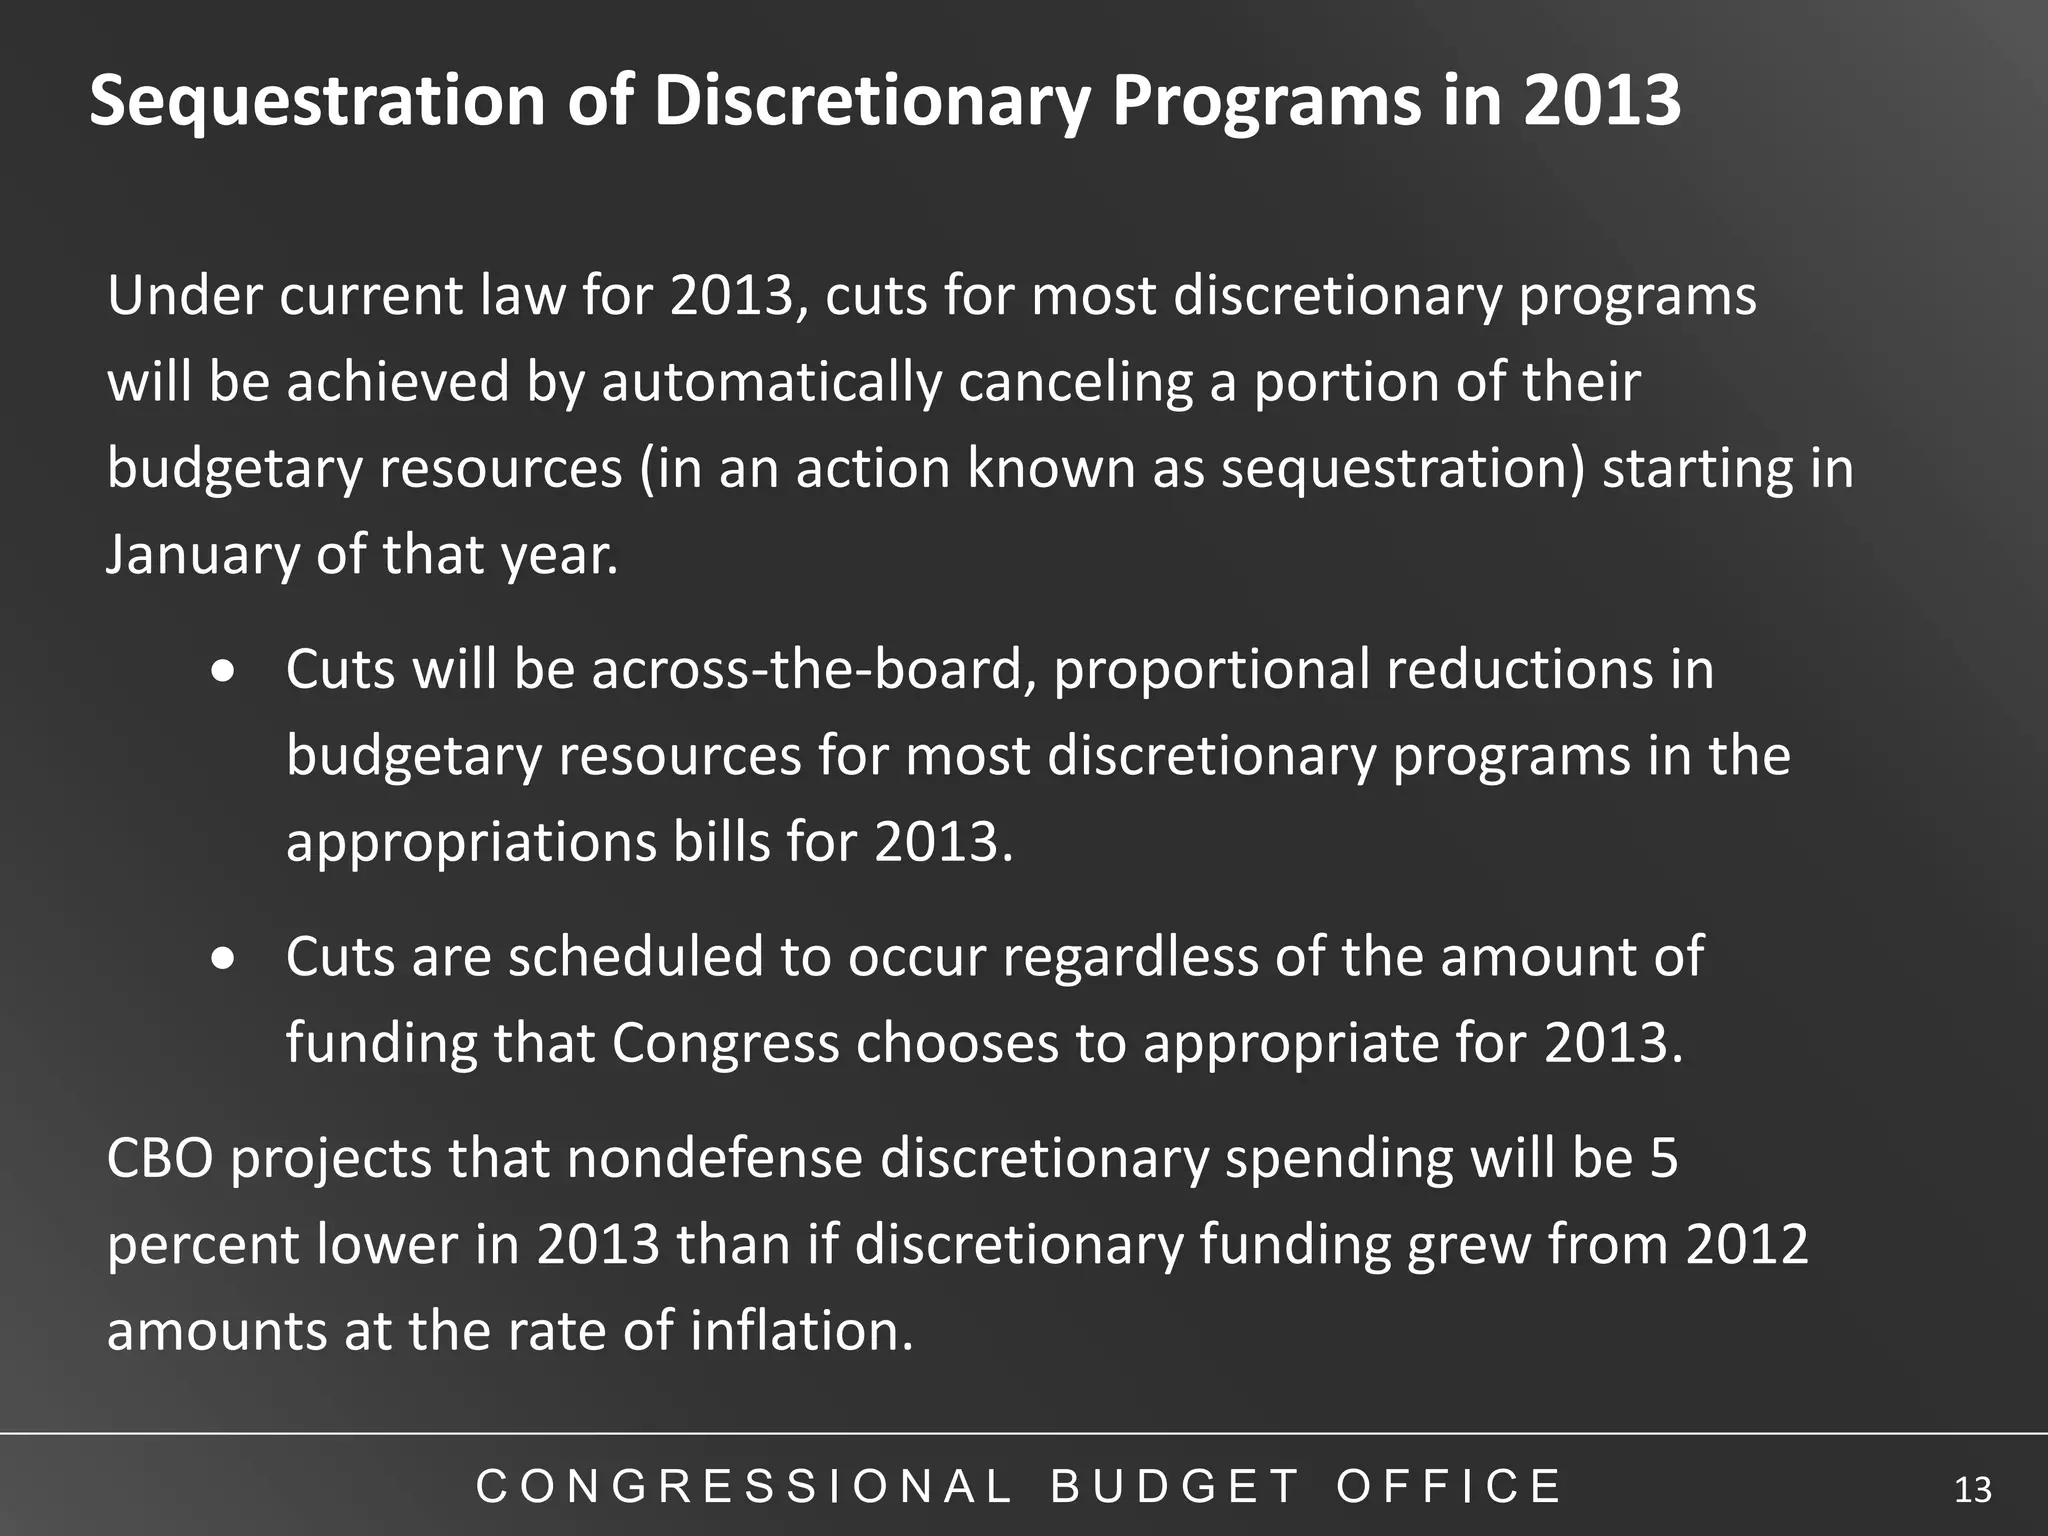
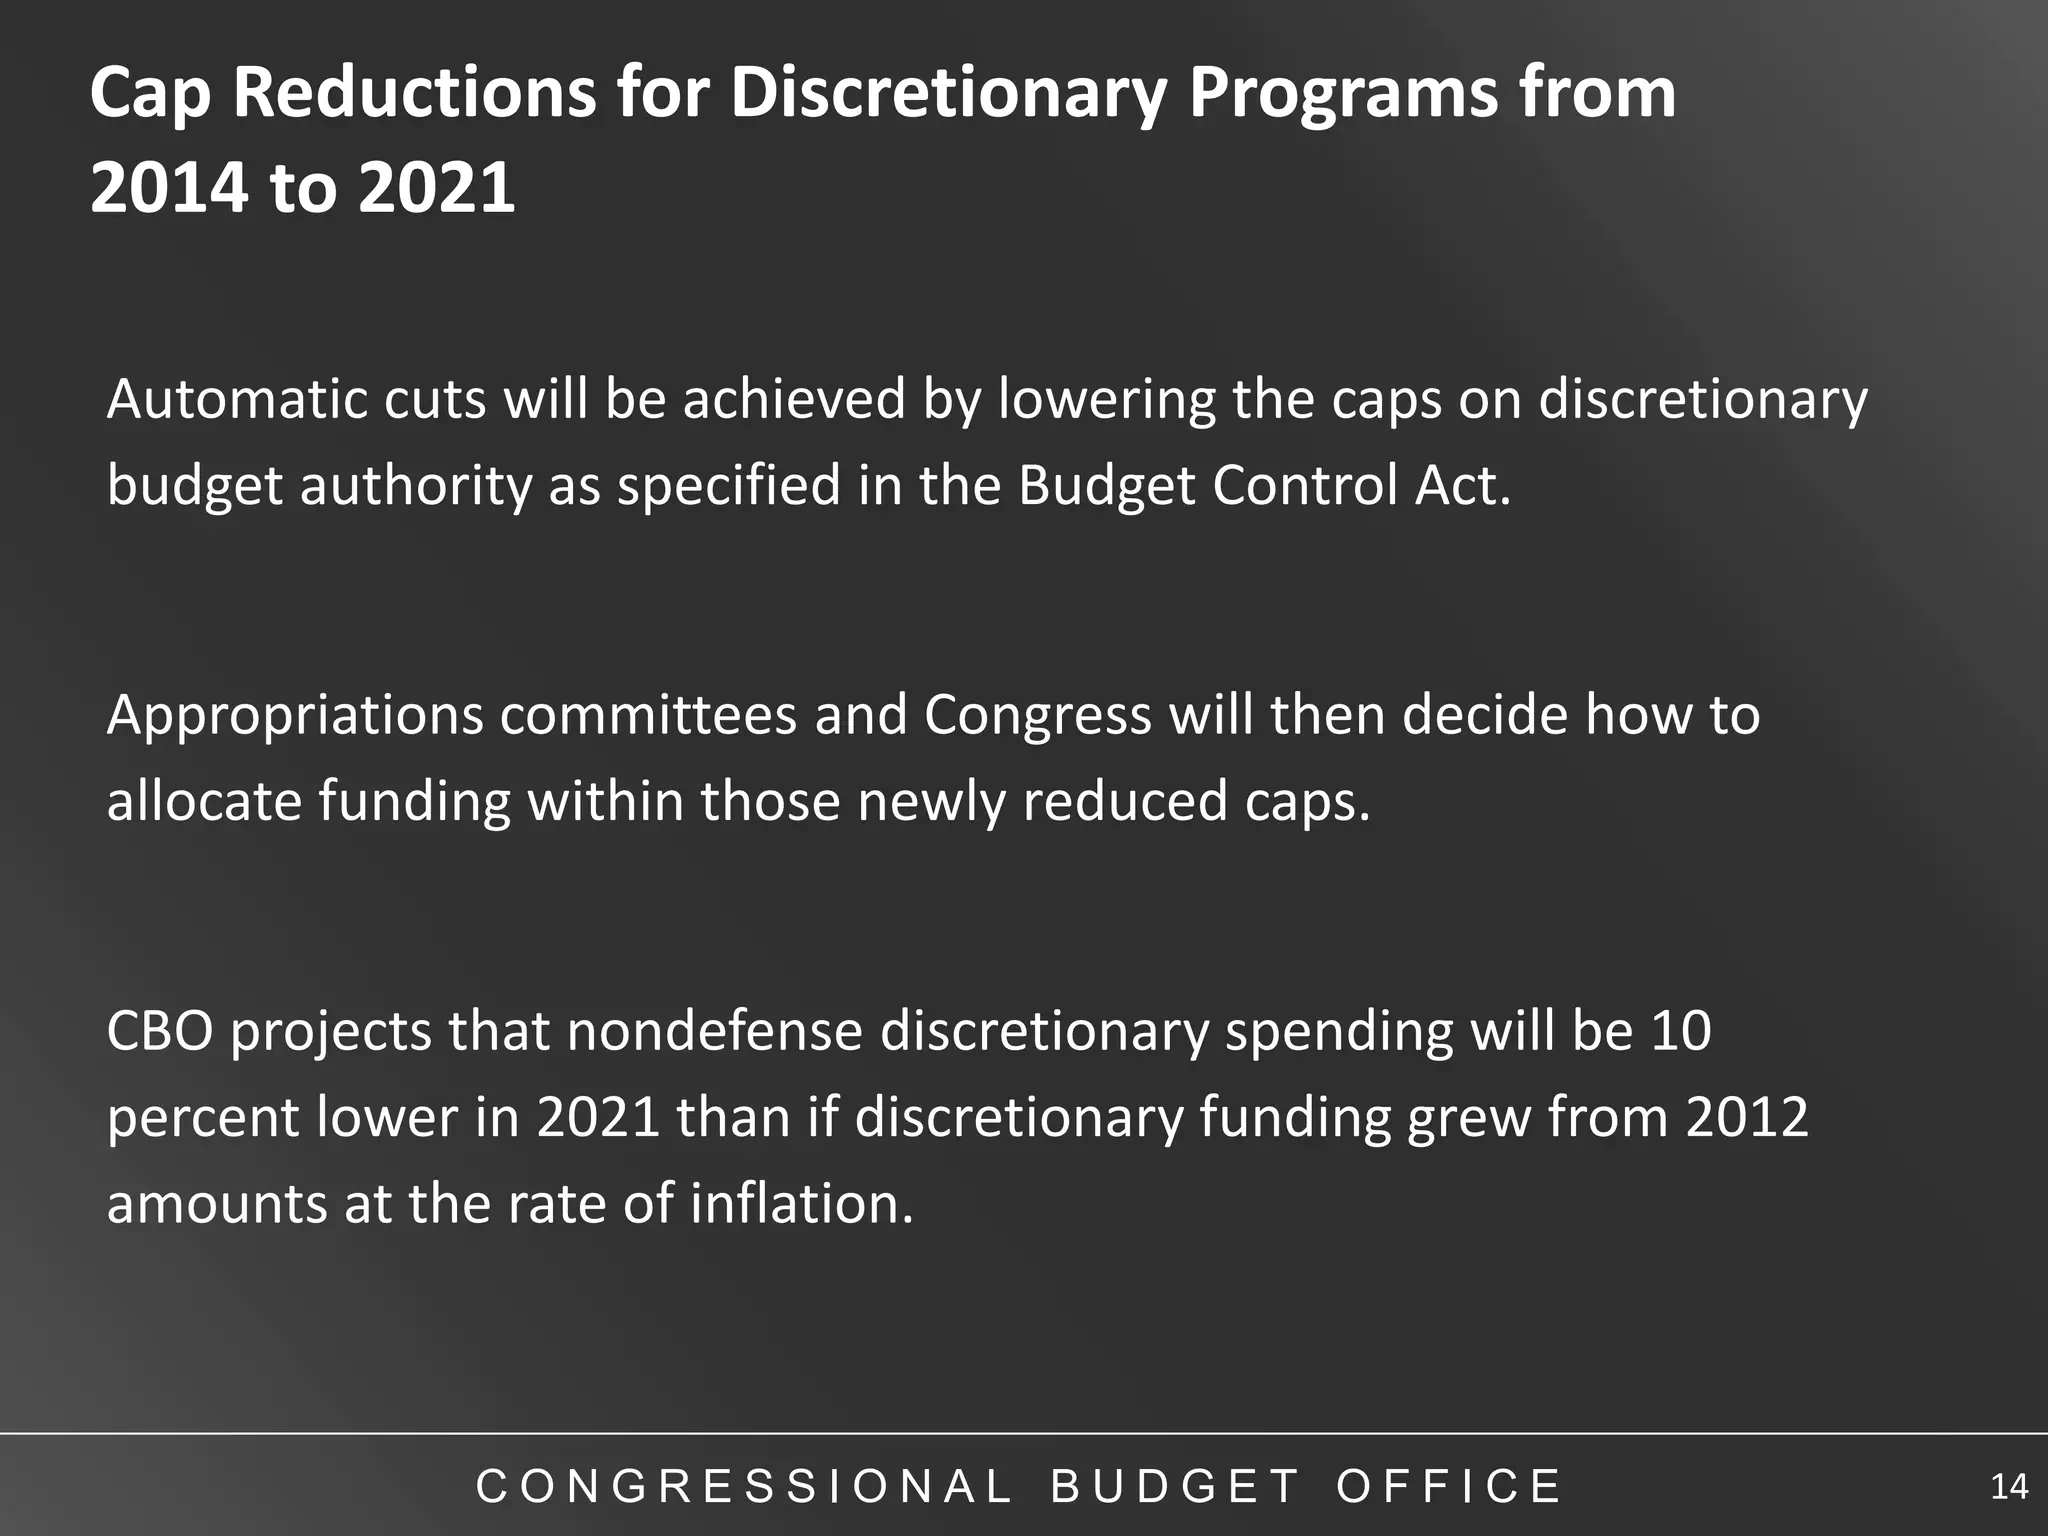
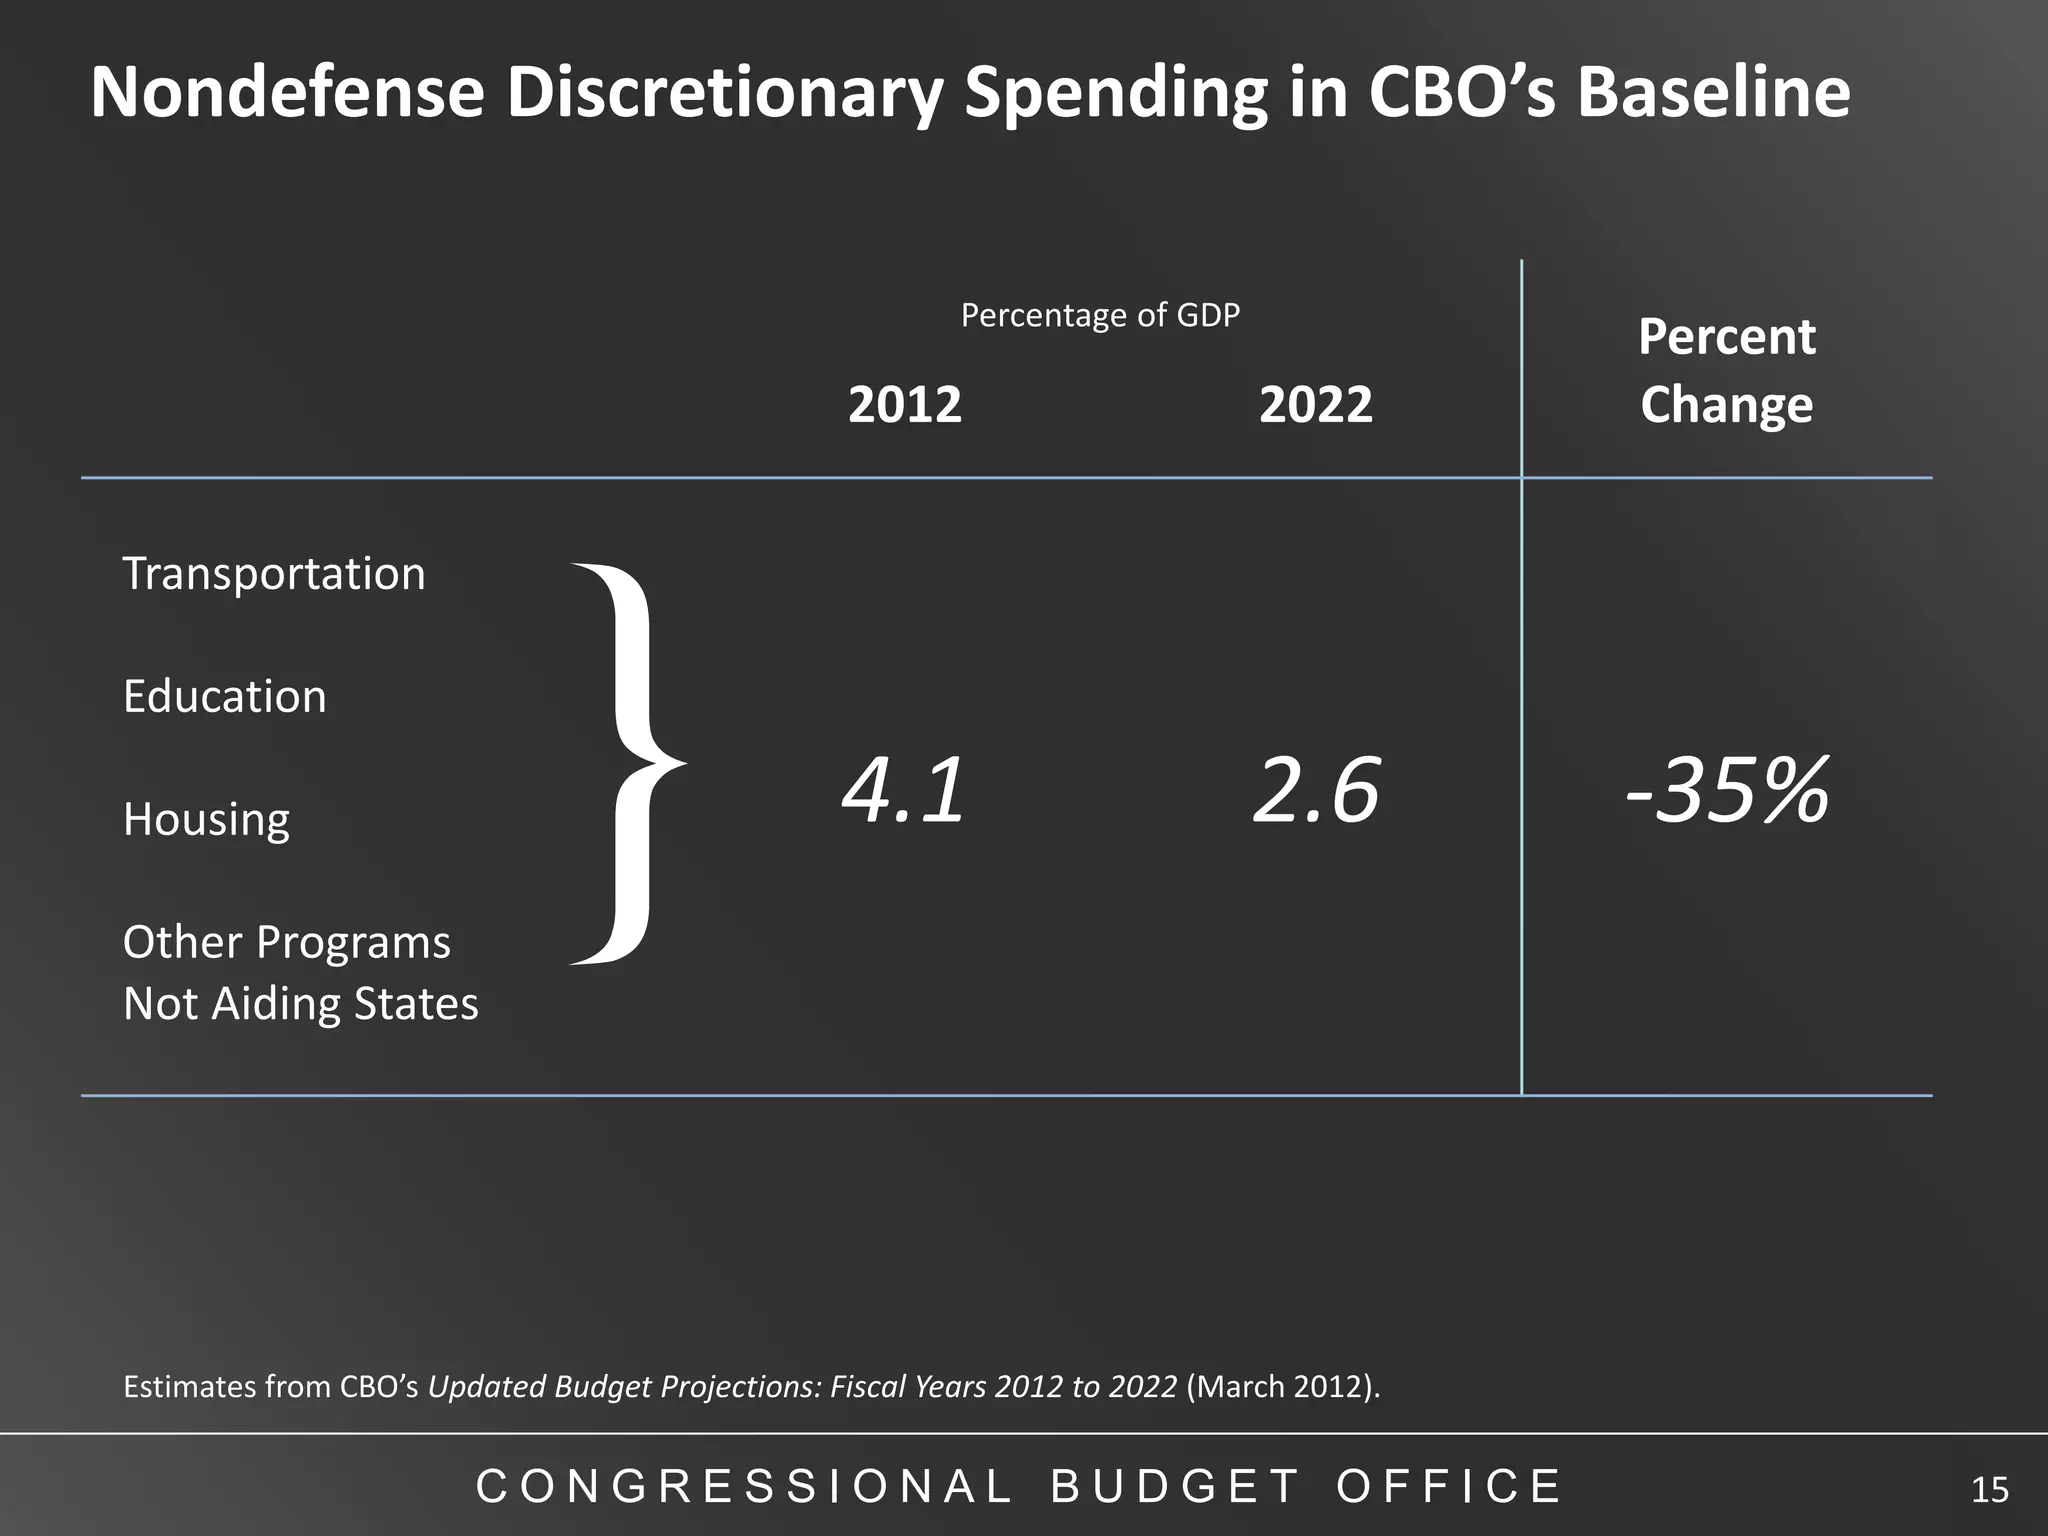
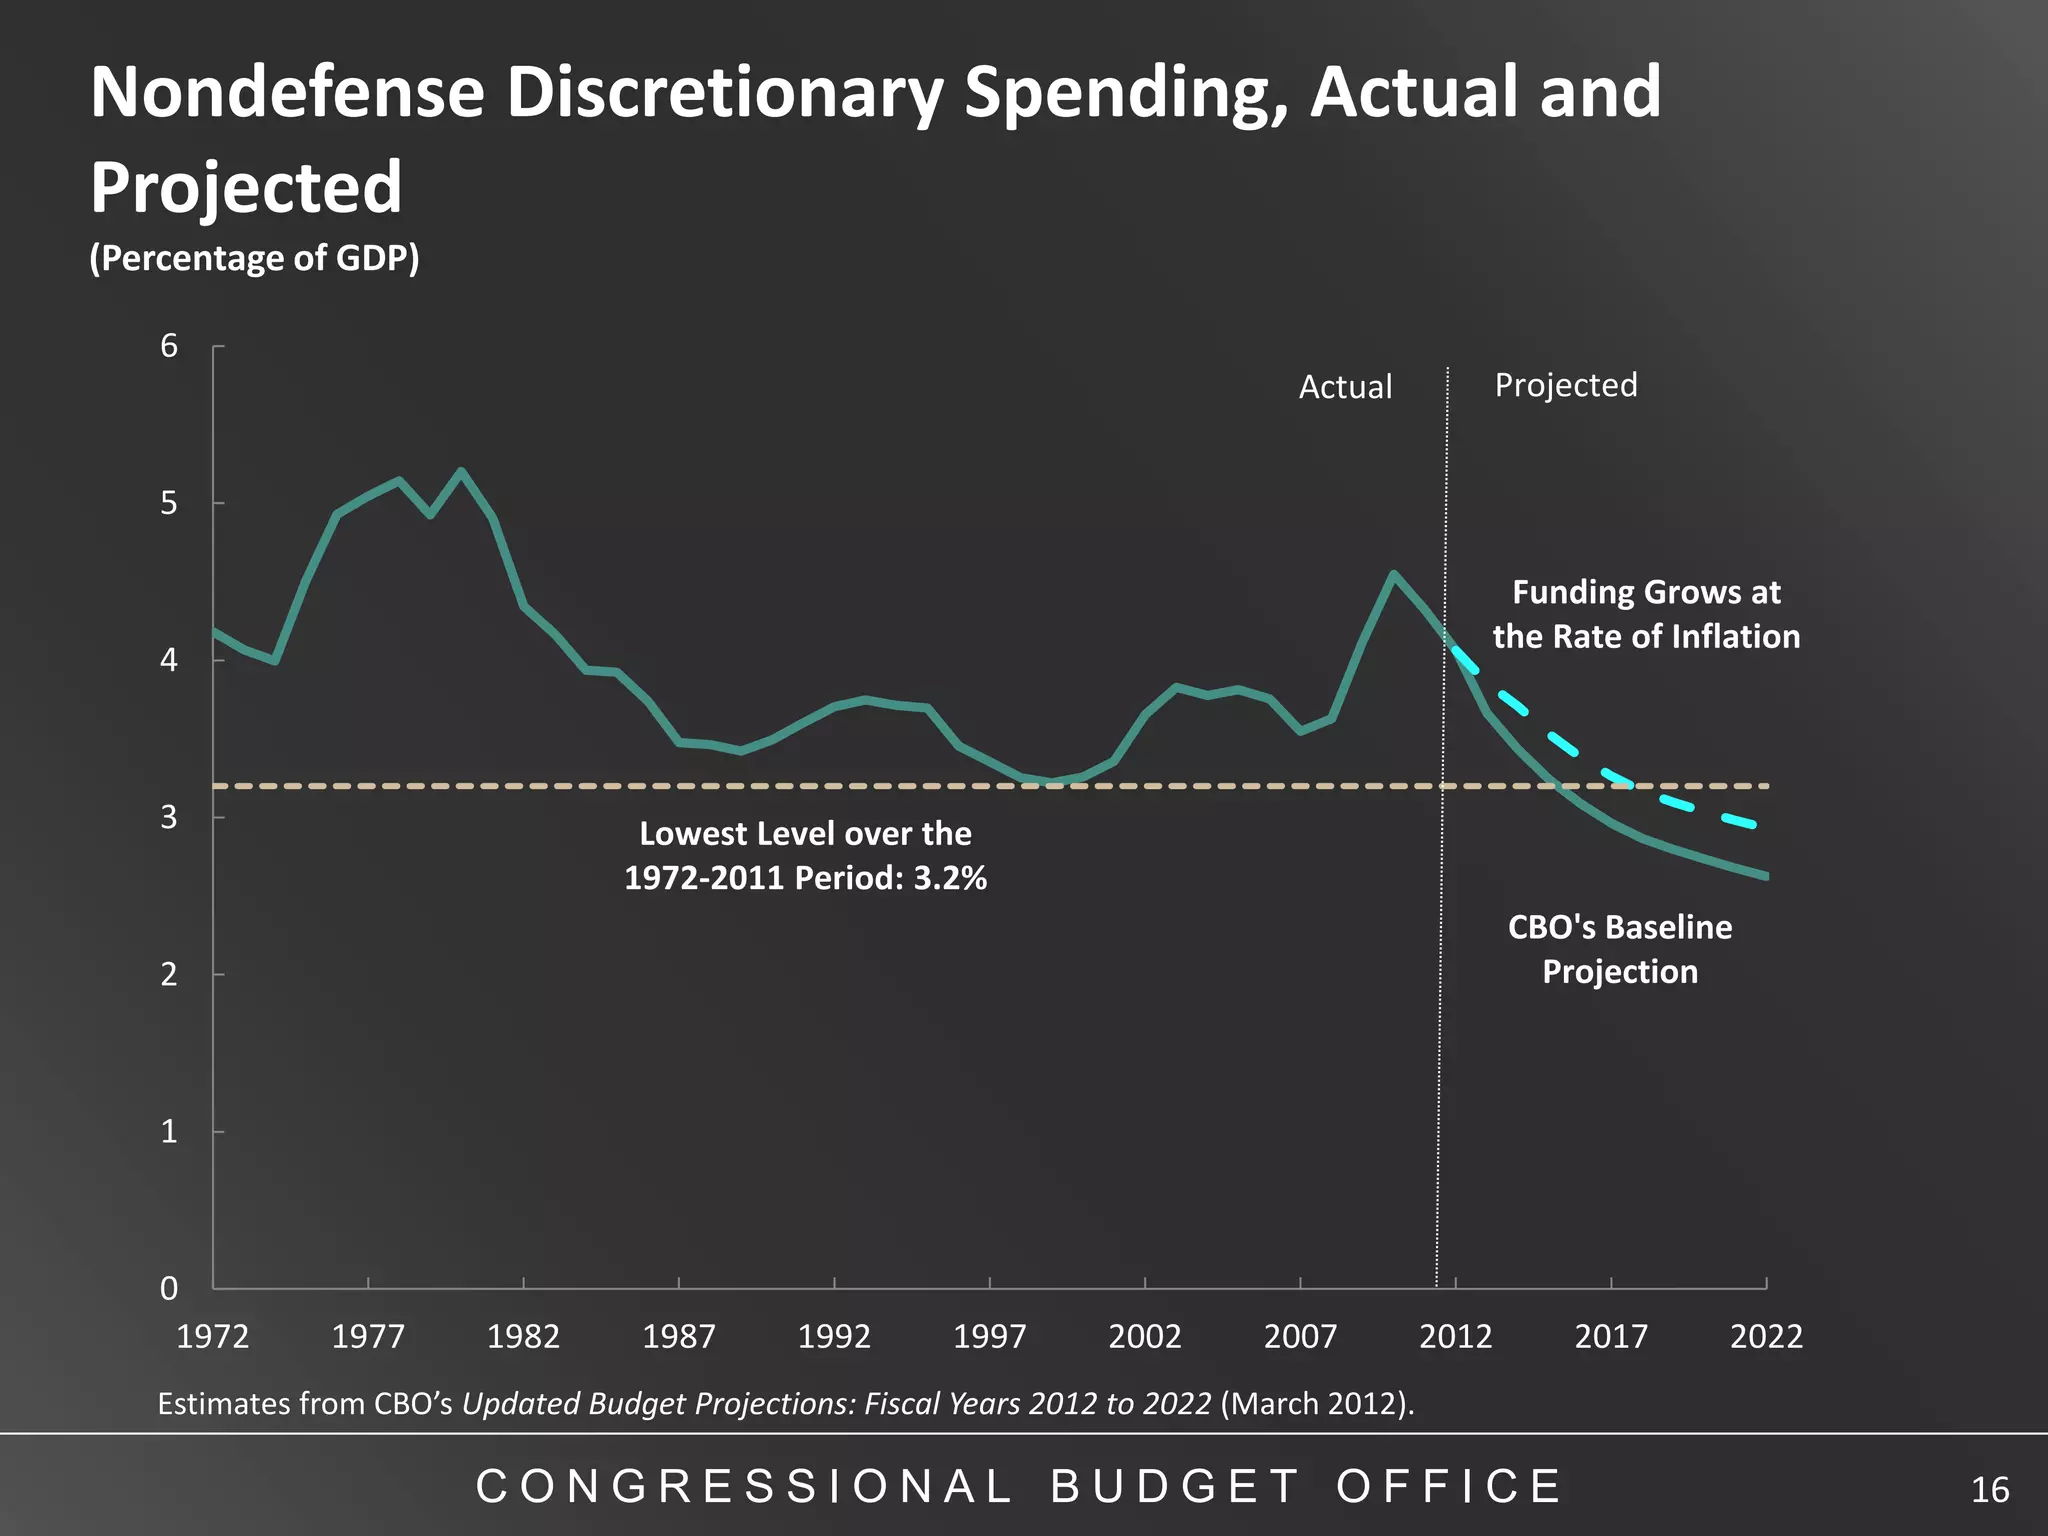

The presentation discusses the federal budget outlook, projecting significant deficits and the impact of the Budget Control Act on federal spending, including caps on discretionary funding. It highlights projected expenditures for key areas like Medicaid and food assistance programs and outlines how automatic spending reductions will affect state aid. Additionally, it provides a historical context of deficits and federal debt as a percentage of GDP from 1972 to 2022.