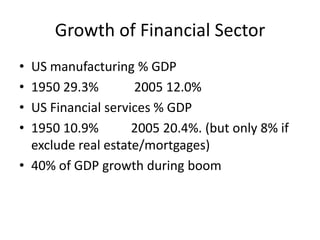
Transition 3: Crisis

     Mary Mellor
The Crisis Unfurls
•   Speculative Boom
•   Subprime Crisis
•   Credit Crunch
•   Banking/Financial Crisis
•   Economic Crisis
•   Sovereign Debt Crisis
•   Austerity
Meltdown
• September 2007 Credit Crunch and run on
  Northern Rock
• September 2008 Lehman fails - global banking
  crisis
• May 2010 Greek bailout (Ireland, Portugal)
  leading to euro crisis
• August 2011 US loses AAA rating
• Still no end in sight
The Boom
• House price boom
• ‘Equity release’ rapidly expanded money
  supply
• Cheap consumer goods (China)
• Easy credit conditions – low interest rates
• Lax bank regulation - bonus culture
• Optimism and exuberance
Subprime Lending
• De-regulation of mortgage lending
• Liar loans – NINJA (no income, no job, no
  assets)
• Teaser rates – people used to fixed rate
• Originate to Distribute (loans sold on, so less
  attention to risk of default)
• All forms of debt expanded
Levels of Debt (% GDP)
•   US Financial sector 1981 (22%) 2008 (117%)
•   US Household        1997 (66%) 2007 (100%)
•   US All sectors      1980 (160%) 2008 (350%)
•   UK All sectors      1987 (200%) 2009 (540%)
•   UK household debt peaked at 150% GDP
Where did the money go?
•   UK money supply doubled 2003-2009
•   75% of loans linked to property
•   30% of loans issued to the financial sector
•   20% to manufacturing/nonfinancial sector
Trading in Debt
• Traditionally most house lending through
  specialised sectors e.g. Building Societies
• Latter part of C20th banks more involved
• Debts (e.g. mortgages) seen as a financial
  asset - investors could ‘buy’ a mortgage as an
  investment (mortgage-backed security)
Securitisation
• Securitisation is a paper ownership of an asset
  which can be bought and sold
• Share certificates are securities – the share
  can be sold without selling the factory
• Various forms of debt (consumer, student,
  mortgages etc.) were bundled up and sold as
  Collatoralised Debt Obligations (CDOs)
Slicing and Dicing
• The CDOs were sold in ‘tranches’ with higher
  interest for higher risk
• The first ‘tranches’ were rated AAA by the
  rating agencies (employed by the issuing
  bank) –this was essential to attract pension
  funds
• The AAA tranche would pay out first in case of
  default
Credit Derivatives
• Investors in credit insure against default
• These insurances became investments in
  themselves and were traded over-the-counter
  (i.e. not through regulated exchanges) as
  Credit Default Swaps (CDSs) between banks
  and other financial institutions
• Made insurances companies such as AIG very
  vulnerable ($180 billion bailout)
Credit Derivatives
• Derivatives do not need any direct connection
  with the product (debt) so large numbers of
  ‘naked’ CDSs were taken out e.g. on Greek
  default while holding no Greek debt
• Default will mean multiple pay out with no
  ‘hair cut’ (unlike actual owners of the debt)
• Credit derivatives grew from $108bn in 1995
  to $1.23 trillion in 2006 and $45.5 trillion in
  2007 (nearly equivalent to world GDP)
Shadow Banking
• There was so much profit to be made in the
  new securitisation that that banks started to
  outstrip their capital adequacy ratios
• Banks are supposed to have sufficient bank
  capital to allow for some losses on assets (e.g.
  loan defaults)
• Bank capital is made up of retained profits and
  any money raised by selling shares (equity)
Shadow Banking
• Banks solved their ‘balance sheet’ problem by
  ‘shadow banking’ holding the securitised
  loans ‘off balance sheet’ in SIVs Special
  Investment Vehicles which only needed 3%
  external ownership
• Real capital ratios fell almost to nothing
• Total bank balance sheets grew bigger than
  GDP (Iceland 10X, UK 5X, Ireland 8X)
Growth of Financial Sector
• US manufacturing % GDP
• 1950 29.3%        2005 12.0%
• US Financial services % GDP
• 1950 10.9%        2005 20.4%. (but only 8% if
  exclude real estate/mortgages)
• 40% of GDP growth during boom
What went wrong?
• High levels of debt default (rare before)
• The bundles of debt-based securities not
  carefully screened for risk - all securities
  became suspect
• Financial institutions (insurance companies,
  pension funds) could not buy them
• Banks left holding unsold bundles of debt
What went wrong?
• As defaults occurred the flow of debts and
  investments stalled
• Credit crunch put most institutions on the
  edge of bankruptcy as their assets could not
  be valued i.e. they were ‘toxic’
• All types of bank affected
• States had to step in
State Responses
•   Guaranteeing bank deposits (Ireland 2XGDP)
•   Central banks issued cheap money
•   Nationalisation or capital injection
•   Toxic Asset purchase or insurance
•   State expanded money: quantitative easing
•   Supporting banks and the wider economy
    transferred the debts to state budgets –
    leading to sovereign debt crisis
Why did the Crisis happen?
• Financial innovations such as securitisation
• High levels of ‘leverage’ (borrowing)
• Bonus culture encouraged risk and rapid
  turnover
• Lax regulation- regulators didn’t see the risk
• Could not isolate parts of the system (Lehman
  collapse)
• Banks too big to fail (and too big to save?)
Forms of Leverage
• Reducing the ratio of capital available to meet
  immediate liabilities relative to the size of the
  firm’s assets
• Borrowing money to enhance the profit on
  original money invested
• Buying ‘on the margin’ – making a large ‘bet’
  with a small initial outlay e.g. putting a
  ‘deposit’ on share trade
Leverage Gamblers
• Hedge funds – use borrowing to enhance
  clients’ money in short term trades – often
  relying on computer-based trading (rocket
  scientists)
• Already seen failure: Long Term Capital
  Management 1998 and ENRON 2001
• Private Equity Companies : used borrowed
  money to buy up companies: AA, Boots,
  Debenhams, EMI - aim to sell at a profit
Disembedded Finance
• Financial investment became detached from
  any interest in accumulating capital through
  productive activities
• Confusion of money speculation with wealth-
  creation – impact on productive investment
• Speculative investment in financial assets
  themselves e.g. stock, shares, bonds,
  derivatives, mergers and acquisitions – worth
  10X world GDP
Credit and Investment Treadmill
• Speculative investment can only realise a
  profit if the asset is sold on
• Needs new money coming into the market
  from leverage (debt) or recycled wealth
• Boom cycles reinforce speculation
• Effectively a chain letter system or pyramid
  scheme – no consumption as in production
• Vast room for fraud and deception (Madoff)
The Banks’ Problem
• Savings and mutual systems replaced by personal
  investment and privatisation e.g. personal
  pension plans - huge amounts of money looking
  for profitable investment
• Obligation to shareholders (e.g. pension funds)
  prioritised high share price
• High risk financial trading more profitable than
  productive investments in short run. US Banks
  bought CDOs because they paid 1% more than
  Treasuries (government debt)
Credit crunch
• Most banks and financial institutions were
  highly leveraged (30 – 100 %)
• Banks had built themselves into highly
  interconnected global networks
• The ‘money market’ had become a key part of
  the financial system (large scale borrowing)
• Susceptible to a credit crunch if any link in the
  chain broke
The wider context
• Growing inequality
• Globalisation: low rates of profit in productive
  sector of old economies, shift of production to
  low wage economies led to global imbalance
• Stagnant wages and high levels of consumer
  debt
• Privatisation of money issue as bank debt –
  rapid increase in money supply
Inequality
• 19,000:1 US highest earners:average wage
• 2011 median salary of UK investment banker
  £350,000 - total bonuses £7.5 billion
• In UK over last 30 years: Bottom 50% wage
  earners share of GDP fell by 25%
• Top 1% of wage earners share rose 50%
• 2011 of each £100 of GDP bottom 50% of
  wage earners get £12 the top 1% get £3(Report
  of ‘Missing Out’ Resolution Foundation July 2011)
Globalisation of Production
• Exporting countries (China, Japan, Germany)
  low consumption/high savings – leads to
  balance of payments problems
• Importing countries high consumption/low
  savings and high debt
• Export earnings are lent back to the importing
  country (70% of dollars exported return to US
  financial sector – mainly government debt)
Globalisation of Production
• Germany does the same in the eurozone –
  earns money from the periphery and lends it
  back to them thus increasing their
  indebtedness
• Global money and trading needs a mechanism
  to maintain balance – major concern of
  Keynes
Why Public Rescue?
• Banks are a system of trust that have no
  means of withstanding a ‘run’ - reserve notion
  is meaningless in a crisis
• The financial sector has required periodic
  rescue since stockmarkets/banking emerged.
• Banks underpinned by state authority
• People demand state recompense e.g.
  Northern Rock, Icesave
Privatised Money - Public
              Responsibility
• As the national money supply is now based on
  bank issued debt it is subject to crisis
• State responsibility for the integrity of its
  national money means it has to continually
  bail out the privatised money system
• States now have to take on ‘sovereign debt’ to
  rescue private debt - borrowed from the self-
  same banks and ‘money markets’
Finance is not Private
• The financial system is not private
• It administers a public resource – money as
  legal tender
• Late C20th 97% of all money has been issued
  as bank debt
• The final resource of the money system is the
  taxation/money issue capacity of states
State and the Banking System
• Viability of money system rests on the
  capacity of the state to tax (viz Greece,
  Argentina) or the consent of the taxed
  (Iceland)
• Yet tax avoidance/off-shoring is rife even given
  the excessive remuneration
• States can also create new money if hold own
  currency (quantitative easing)
Sovereign Debt Crisis
• Most increased sovereign debt caused by the
  crisis: banks (US, UK, Ireland), speculative
  housing debts (Spain), GDP fall (Italy)
• A serious problem in the eurozone (Greece,
  Portugal, Spain, Ireland, Italy)
• Problem of Maastricht rules and limited
  powers of European Central Bank to issue new
  money or lend to states
Sovereign Debt
• Less problematic if the country has its own
  currency and borrows internally
• e.g. Japan national debt is 200% of GDP,
  Greece 150% (95% of Japanese debt and stock
  trading is domestic)
• Greek financial sector only 2 X GDP but 2/3 of
  its debt is to foreign lenders
• Greek public and private debt 250% of GDP
  (much less than US or UK)
Austerity
• Neo-liberal economics has constrained the
  capacity of states, particularly on money
  supply
• Assumes that money can only be issued as
  bank debt
• Assumes that reducing state expenditure will
  increase private expenditure
• Blames states for failures of the private sector
Austerity
• States are asked to cut expenditure and raise
  more taxes to ‘pay’ for the deficit caused by
  the crisis
• Already economic decline/stagnation – UK lost
  6% of GDP in 2009 - less impact in BRIC
  countries
• Unemployment rising rapidly – particularly
  youth unemployment over 40% in Spain
• Public anger in many countries
Is this the 30’s?
• 1929-1930 US GDP fell 14%; 1931 25.3%
  1932-3 25% (Greece – 4.5% 2010 15% overall)
• Unemployment 25% (Spain, Greece ?)
• US debt service 20% of GDP
• Nearly all banks collapsed
• FDR removed gold standard in 1933 – floating
  exchange rates today except in eurozone
• Overall rate of debt higher than 1930s

Session 3 crisis

  • 1.
  • 2.
    The Crisis Unfurls • Speculative Boom • Subprime Crisis • Credit Crunch • Banking/Financial Crisis • Economic Crisis • Sovereign Debt Crisis • Austerity
  • 3.
    Meltdown • September 2007Credit Crunch and run on Northern Rock • September 2008 Lehman fails - global banking crisis • May 2010 Greek bailout (Ireland, Portugal) leading to euro crisis • August 2011 US loses AAA rating • Still no end in sight
  • 4.
    The Boom • Houseprice boom • ‘Equity release’ rapidly expanded money supply • Cheap consumer goods (China) • Easy credit conditions – low interest rates • Lax bank regulation - bonus culture • Optimism and exuberance
  • 5.
    Subprime Lending • De-regulationof mortgage lending • Liar loans – NINJA (no income, no job, no assets) • Teaser rates – people used to fixed rate • Originate to Distribute (loans sold on, so less attention to risk of default) • All forms of debt expanded
  • 6.
    Levels of Debt(% GDP) • US Financial sector 1981 (22%) 2008 (117%) • US Household 1997 (66%) 2007 (100%) • US All sectors 1980 (160%) 2008 (350%) • UK All sectors 1987 (200%) 2009 (540%) • UK household debt peaked at 150% GDP
  • 7.
    Where did themoney go? • UK money supply doubled 2003-2009 • 75% of loans linked to property • 30% of loans issued to the financial sector • 20% to manufacturing/nonfinancial sector
  • 8.
    Trading in Debt •Traditionally most house lending through specialised sectors e.g. Building Societies • Latter part of C20th banks more involved • Debts (e.g. mortgages) seen as a financial asset - investors could ‘buy’ a mortgage as an investment (mortgage-backed security)
  • 9.
    Securitisation • Securitisation isa paper ownership of an asset which can be bought and sold • Share certificates are securities – the share can be sold without selling the factory • Various forms of debt (consumer, student, mortgages etc.) were bundled up and sold as Collatoralised Debt Obligations (CDOs)
  • 10.
    Slicing and Dicing •The CDOs were sold in ‘tranches’ with higher interest for higher risk • The first ‘tranches’ were rated AAA by the rating agencies (employed by the issuing bank) –this was essential to attract pension funds • The AAA tranche would pay out first in case of default
  • 11.
    Credit Derivatives • Investorsin credit insure against default • These insurances became investments in themselves and were traded over-the-counter (i.e. not through regulated exchanges) as Credit Default Swaps (CDSs) between banks and other financial institutions • Made insurances companies such as AIG very vulnerable ($180 billion bailout)
  • 12.
    Credit Derivatives • Derivativesdo not need any direct connection with the product (debt) so large numbers of ‘naked’ CDSs were taken out e.g. on Greek default while holding no Greek debt • Default will mean multiple pay out with no ‘hair cut’ (unlike actual owners of the debt) • Credit derivatives grew from $108bn in 1995 to $1.23 trillion in 2006 and $45.5 trillion in 2007 (nearly equivalent to world GDP)
  • 13.
    Shadow Banking • Therewas so much profit to be made in the new securitisation that that banks started to outstrip their capital adequacy ratios • Banks are supposed to have sufficient bank capital to allow for some losses on assets (e.g. loan defaults) • Bank capital is made up of retained profits and any money raised by selling shares (equity)
  • 14.
    Shadow Banking • Bankssolved their ‘balance sheet’ problem by ‘shadow banking’ holding the securitised loans ‘off balance sheet’ in SIVs Special Investment Vehicles which only needed 3% external ownership • Real capital ratios fell almost to nothing • Total bank balance sheets grew bigger than GDP (Iceland 10X, UK 5X, Ireland 8X)
  • 15.
    Growth of FinancialSector • US manufacturing % GDP • 1950 29.3% 2005 12.0% • US Financial services % GDP • 1950 10.9% 2005 20.4%. (but only 8% if exclude real estate/mortgages) • 40% of GDP growth during boom
  • 16.
    What went wrong? •High levels of debt default (rare before) • The bundles of debt-based securities not carefully screened for risk - all securities became suspect • Financial institutions (insurance companies, pension funds) could not buy them • Banks left holding unsold bundles of debt
  • 17.
    What went wrong? •As defaults occurred the flow of debts and investments stalled • Credit crunch put most institutions on the edge of bankruptcy as their assets could not be valued i.e. they were ‘toxic’ • All types of bank affected • States had to step in
  • 18.
    State Responses • Guaranteeing bank deposits (Ireland 2XGDP) • Central banks issued cheap money • Nationalisation or capital injection • Toxic Asset purchase or insurance • State expanded money: quantitative easing • Supporting banks and the wider economy transferred the debts to state budgets – leading to sovereign debt crisis
  • 19.
    Why did theCrisis happen? • Financial innovations such as securitisation • High levels of ‘leverage’ (borrowing) • Bonus culture encouraged risk and rapid turnover • Lax regulation- regulators didn’t see the risk • Could not isolate parts of the system (Lehman collapse) • Banks too big to fail (and too big to save?)
  • 20.
    Forms of Leverage •Reducing the ratio of capital available to meet immediate liabilities relative to the size of the firm’s assets • Borrowing money to enhance the profit on original money invested • Buying ‘on the margin’ – making a large ‘bet’ with a small initial outlay e.g. putting a ‘deposit’ on share trade
  • 21.
    Leverage Gamblers • Hedgefunds – use borrowing to enhance clients’ money in short term trades – often relying on computer-based trading (rocket scientists) • Already seen failure: Long Term Capital Management 1998 and ENRON 2001 • Private Equity Companies : used borrowed money to buy up companies: AA, Boots, Debenhams, EMI - aim to sell at a profit
  • 22.
    Disembedded Finance • Financialinvestment became detached from any interest in accumulating capital through productive activities • Confusion of money speculation with wealth- creation – impact on productive investment • Speculative investment in financial assets themselves e.g. stock, shares, bonds, derivatives, mergers and acquisitions – worth 10X world GDP
  • 23.
    Credit and InvestmentTreadmill • Speculative investment can only realise a profit if the asset is sold on • Needs new money coming into the market from leverage (debt) or recycled wealth • Boom cycles reinforce speculation • Effectively a chain letter system or pyramid scheme – no consumption as in production • Vast room for fraud and deception (Madoff)
  • 24.
    The Banks’ Problem •Savings and mutual systems replaced by personal investment and privatisation e.g. personal pension plans - huge amounts of money looking for profitable investment • Obligation to shareholders (e.g. pension funds) prioritised high share price • High risk financial trading more profitable than productive investments in short run. US Banks bought CDOs because they paid 1% more than Treasuries (government debt)
  • 25.
    Credit crunch • Mostbanks and financial institutions were highly leveraged (30 – 100 %) • Banks had built themselves into highly interconnected global networks • The ‘money market’ had become a key part of the financial system (large scale borrowing) • Susceptible to a credit crunch if any link in the chain broke
  • 26.
    The wider context •Growing inequality • Globalisation: low rates of profit in productive sector of old economies, shift of production to low wage economies led to global imbalance • Stagnant wages and high levels of consumer debt • Privatisation of money issue as bank debt – rapid increase in money supply
  • 27.
    Inequality • 19,000:1 UShighest earners:average wage • 2011 median salary of UK investment banker £350,000 - total bonuses £7.5 billion • In UK over last 30 years: Bottom 50% wage earners share of GDP fell by 25% • Top 1% of wage earners share rose 50% • 2011 of each £100 of GDP bottom 50% of wage earners get £12 the top 1% get £3(Report of ‘Missing Out’ Resolution Foundation July 2011)
  • 28.
    Globalisation of Production •Exporting countries (China, Japan, Germany) low consumption/high savings – leads to balance of payments problems • Importing countries high consumption/low savings and high debt • Export earnings are lent back to the importing country (70% of dollars exported return to US financial sector – mainly government debt)
  • 29.
    Globalisation of Production •Germany does the same in the eurozone – earns money from the periphery and lends it back to them thus increasing their indebtedness • Global money and trading needs a mechanism to maintain balance – major concern of Keynes
  • 30.
    Why Public Rescue? •Banks are a system of trust that have no means of withstanding a ‘run’ - reserve notion is meaningless in a crisis • The financial sector has required periodic rescue since stockmarkets/banking emerged. • Banks underpinned by state authority • People demand state recompense e.g. Northern Rock, Icesave
  • 31.
    Privatised Money -Public Responsibility • As the national money supply is now based on bank issued debt it is subject to crisis • State responsibility for the integrity of its national money means it has to continually bail out the privatised money system • States now have to take on ‘sovereign debt’ to rescue private debt - borrowed from the self- same banks and ‘money markets’
  • 32.
    Finance is notPrivate • The financial system is not private • It administers a public resource – money as legal tender • Late C20th 97% of all money has been issued as bank debt • The final resource of the money system is the taxation/money issue capacity of states
  • 33.
    State and theBanking System • Viability of money system rests on the capacity of the state to tax (viz Greece, Argentina) or the consent of the taxed (Iceland) • Yet tax avoidance/off-shoring is rife even given the excessive remuneration • States can also create new money if hold own currency (quantitative easing)
  • 34.
    Sovereign Debt Crisis •Most increased sovereign debt caused by the crisis: banks (US, UK, Ireland), speculative housing debts (Spain), GDP fall (Italy) • A serious problem in the eurozone (Greece, Portugal, Spain, Ireland, Italy) • Problem of Maastricht rules and limited powers of European Central Bank to issue new money or lend to states
  • 35.
    Sovereign Debt • Lessproblematic if the country has its own currency and borrows internally • e.g. Japan national debt is 200% of GDP, Greece 150% (95% of Japanese debt and stock trading is domestic) • Greek financial sector only 2 X GDP but 2/3 of its debt is to foreign lenders • Greek public and private debt 250% of GDP (much less than US or UK)
  • 36.
    Austerity • Neo-liberal economicshas constrained the capacity of states, particularly on money supply • Assumes that money can only be issued as bank debt • Assumes that reducing state expenditure will increase private expenditure • Blames states for failures of the private sector
  • 37.
    Austerity • States areasked to cut expenditure and raise more taxes to ‘pay’ for the deficit caused by the crisis • Already economic decline/stagnation – UK lost 6% of GDP in 2009 - less impact in BRIC countries • Unemployment rising rapidly – particularly youth unemployment over 40% in Spain • Public anger in many countries
  • 38.
    Is this the30’s? • 1929-1930 US GDP fell 14%; 1931 25.3% 1932-3 25% (Greece – 4.5% 2010 15% overall) • Unemployment 25% (Spain, Greece ?) • US debt service 20% of GDP • Nearly all banks collapsed • FDR removed gold standard in 1933 – floating exchange rates today except in eurozone • Overall rate of debt higher than 1930s