Pinning Down the Change: A Community-Level Study of Timberland Ownership Change

Over the last twenty years, the forest products industry has sold much of its land base throughout the U.S. The majority of that land is being transferred from traditional vertically-integrated industry to new corporate owners in the form of timber investment management organizations (TIMOs) and real estate investment trusts (REITs). A smaller portion has transferred to the public, non-governmental organizations (NGO), non-industrial private forest (NIPF) owners, and to privately-held and vertically-integrated corporations in the forest products industry. By controlling the management of the forest, these new owners will directly impact ecology, economics, and society. Previous research has focused on national or regional trends, overlooking the major impact this development will have locally. This study mapped timberland ownership change in five counties in Southwest Alabama where timber production is concentrated. This area is primarily rural and timber dependent. To identify where land had changed hands and collect information on new owners, industrial timberland ownership from the early 1990s was mapped and compared to current timberland ownership. Following national trends, industry sold almost all of its land in this area and the majority of that land (63%) is now owned by REITs and TIMOs. Absentee ownership still accounted for 83% of the land. Little fragmentation or use change occurred, leaving the forest as a whole seemingly untouched. However, there were ecologically important changes in some areas, included 54,000 acres purchased for conservation. The implications of these changes for rural timber dependent communities will be discussed.

Recommended
Recommended
More Related Content
Viewers also liked
Viewers also liked (18)
Similar to Pinning Down the Change: A Community-Level Study of Timberland Ownership Change
Similar to Pinning Down the Change: A Community-Level Study of Timberland Ownership Change (20)
More from Rural Soc
More from Rural Soc (18)
Recently uploaded
Recently uploaded (20)
Pinning Down the Change: A Community-Level Study of Timberland Ownership Change
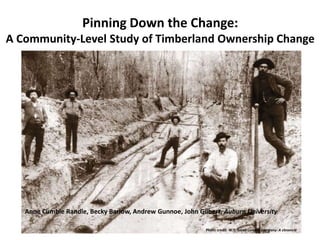
- 1. Pinning Down the Change: A Community-Level Study of Timberland Ownership Change Photo credit: W.T. Smith Lumber Company: A chronicle Anne Cumbie Randle, Becky Barlow, Andrew Gunnoe, John Gilbert, Auburn University
- 2. Introduction Millions of Acres, Billions of Trees: Social and Economic Impacts of Timberland Sales by the Forest Products Industry in Alabama • To document and analyze the social and economic impacts of ownership and land use change affecting the single most important manufacturing sector in Alabama • To understand what timberland ownership change might mean on a local level
- 3. The Study Area: Baldwin, Clarke, Conecuh, Escambia and Monroe counties Research objectives The Study Area Literature Review Mapping Timberland Ownership Change Using GIS Analysis to Explain Ownership Change Discussion and Conclusion Future Studies
- 4. The Study Area: Evidence of forest products industry restructuring, 2012 Research objectives The Study Area Literature Review Mapping Timberland Ownership Change Using GIS Analysis to Explain Ownership Change Discussion and Conclusion Future Studies
- 5. Literature Review • Ownership change in U.S. timberland (Clutter et al. 2005, Gunnoe and Gellert 2010) Forest Products Industry 10 million acres Corporate owners (TIMOs and REITs) Public and NGO Non-Industrial Private Forest owners (NIPF) Research objectives The Study Area Literature Review Mapping Timberland Ownership Change Using GIS Analysis to Explain Ownership Change Discussion and Conclusion Future Studies
- 6. Literature Review • Who owns the forest (Butler and Wear 2011) – Provides a basis for understanding how the forest will be managed • Using GIS to study land ownership change (Scott and Janikas 2010) Research objectives The Study Area Literature Review Mapping Timberland Ownership Change Using GIS Analysis to Explain Ownership Change Discussion and Conclusion Future Studies
- 7. Mapping Timberland Ownership Change: Objectives Research objectives The Study Area Literature Review Mapping Timberland Ownership Change Using GIS Analysis to Explain Ownership Change Discussion and Conclusion Future Studies Objective 1: Map industrial timberland ownership circa 1990 in Escambia, Baldwin, Clarke, Monroe, and Conecuh counties Objective 2: Identify changes in industrial timberland ownership as of 2012
- 8. • Map industry ownership prior to land sales – County plat books (1983 – 1991) were georeferenced and digitized – Industry owners were identified and timberland was mapped Mapping Timberland Ownership Change: Methods Research objectives The Study Area Literature Review Mapping Timberland Ownership Change Using GIS Analysis to Explain Ownership Change Discussion and Conclusion Future Studies
- 9. • Map industry ownership prior to land sales • Overlay map of industry land with 2012 ownership maps – 2012 ownership data was obtained – New owners were identified and assembled into a database Mapping Timberland Ownership Change: Methods Research objectives The Study Area Literature Review Mapping Timberland Ownership Change Using GIS Analysis to Explain Ownership Change Discussion and Conclusion Future Studies
- 10. • Map industry ownership prior to land sales • Overlay map of industry land with 2012 ownership maps • New owners were categorized according to ownership type and location, use change identified – Alabama Government Records Inquiry System, 2012 Current Use Tax Roll, USDA Orthoimagery – Tax roll mailing address Mapping Timberland Ownership Change: Methods Research objectives The Study Area Literature Review Mapping Timberland Ownership Change Using GIS Analysis to Explain Ownership Change Discussion and Conclusion Future Studies
- 11. Mapping Timberland Ownership Change: Results Industry owned land 1983 - 1991: total of 925,211 acres Research objectives The Study Area Literature Review Mapping Timberland Ownership Change Using GIS Analysis to Explain Ownership Change Discussion and Conclusion Future Studies
- 12. 1983-1991 18 owners Mapping Timberland Ownership Change: Results Research objectives The Study Area Literature Review Mapping Timberland Ownership Change Using GIS Analysis to Explain Ownership Change Discussion and Conclusion Future Studies
- 13. 1983-1991 2012 18 owners 1,822 owners Mapping Timberland Ownership Change: Results Research objectives The Study Area Literature Review Mapping Timberland Ownership Change Using GIS Analysis to Explain Ownership Change Discussion and Conclusion Future Studies
- 14. 84% 16% 1983 - 1991 Top 5 Owners Everybody Else 53%47% 2012 Ownership Concentration Mapping Timberland Ownership Change: Results Research objectives The Study Area Literature Review Mapping Timberland Ownership Change Using GIS Analysis to Explain Ownership Change Discussion and Conclusion Future Studies
- 15. New owners of former industry land, 2012 Counties Industry % Corporate % NIPF % Gov. % Use Change % Total: 172,074 18% 575,263 63% 91,218 10% 56,729 6% 15,483 1.7% Mapping Timberland Ownership Change: Results Research objectives The Study Area Literature Review Mapping Timberland Ownership Change Using GIS Analysis to Explain Ownership Change Discussion and Conclusion Future Studies Industry Corporate NIPF Government Use Change
- 16. New owners of former industry land by class, 2012 Mapping Timberland Ownership Change: Results Research objectives The Study Area Literature Review Mapping Timberland Ownership Change Using GIS Analysis to Explain Ownership Change Discussion and Conclusion Future Studies
- 17. Mapping Timberland Ownership Change: Results Research objectives The Study Area Literature Review Mapping Timberland Ownership Change Using GIS Analysis to Explain Ownership Change Discussion and Conclusion Future Studies
- 18. •Absentee owned industry land in 1983 – 1991: 771,593 acres •Absentee owned former industry land 2012: 744,966 (increase of 10,569) •Two-sample t-test shows significant increase in local ownership (P = .016, T = -40.16, N=1) •Still, absentee ownership accounted for 83% of this land Mapping Timberland Ownership Change: Results Research objectives The Study Area Literature Review Mapping Timberland Ownership Change Using GIS Analysis to Explain Ownership Change Discussion and Conclusion Future Studies
- 19. Using GIS Analysis to Explain Ownership Change: Objectives Research objectives The Study Area Literature Review Mapping Timberland Ownership Change Using GIS Analysis to Explain Ownership Change Discussion and Conclusion Future Studies Objective 1: Map industrial timberland ownership circa 1990 in Escambia, Baldwin, Clarke, Monroe, and Conecuh counties Objective 2: Identify changes in industrial timberland ownership as of 2012 Objective 3: Explain what influenced new timberland owners and where that change is concentrated
- 20. Explanatory Variables Relationship Adjusted R2 (OLS) GWR Sigma GWR R2 GWR R2 Adjusted Government Percent Poverty + 0.63 1.3 0.78 0.71 Percent Population with Bachelor’s Degree - 0.39 Distance to Roads + 0.05 Distance to Place + 0.04 Distance to Water - 0.04 Corporate Distance to Place + 0.05 3.18 0.44 0.37 Percent Unemployment + 0.02 Median House Value - 0.01 Median Household Income - 0.01 Percent Population with Bachelor’s Degree - 0.00 NIPF Distance to Place - 0.04 8.27 0.41 0.39 Percent Population with Bachelor’s Degree - 0.04 Median Household Income - 0.03 Percent Unemployment + 0.00 Median House Value - 0.00 Change in Use Percent Population with Bachelor’s Degree + 0.94 2.82 0.61 0.51 Percent Poverty - 0.71 Distance to Roads - 0.20 Distance to Place - 0.13 Distance to Water - 0.04 Using GIS Analysis to Explain Ownership Change: Geographically Weighted Regression Analysis Research objectives The Study Area Literature Review Mapping Timberland Ownership Change Using GIS Analysis to Explain Ownership Change Discussion and Conclusion Future Studies
- 21. Using GIS Analysis to Explain Ownership Change: Hot Spot Analysis Clusters of NIPF landowners may lead to increased disturbance rates in these areas Research objectives The Study Area Literature Review Mapping Timberland Ownership Change Using GIS Analysis to Explain Ownership Change Discussion and Conclusion Future Studies
- 22. • Industry has sold almost all the land owned in the study area • New owners are primarily corporate, followed by NIPF and government • 1.7% of land changed in use • Local ownership has significantly increased, but absentee ownership still accounts for 83% of the land • New government land was negatively influenced by higher quality of life variables and positively influenced by distance to roads and place. Use change was almost exactly the opposite. • NIPF and Corporate timberland owners were negatively influenced by quality of life variables. Discussion and Conclusion Research objectives The Study Area Literature Review Mapping Timberland Ownership Change Using GIS Analysis to Explain Ownership Change Discussion and Conclusion Future Studies
- 23. •Interview NIPF and Corporate owners to find what variables influenced them to purchase land in this area •Replicate this study in different areas of the state •Continue mapping these parcels in the future, or from an earlier point in time, to show how they change over time •Determine if the potential outcomes do occur in the future in this area Research objectives The Study Area Literature Review Mapping Timberland Ownership Change Using GIS Analysis to Explain Ownership Change Discussion and Conclusion Future Studies Future Studies
- 24. Acknowledgements Dr. Larry Teeter, Dr. Conner Bailey, Dr. John Kush Pinning Down the Change: A Community-Level Study of Timberland Ownership Change
- 26. Variables Used in Exploratory Regression Significant Variables Not Significant or Redundant Variables Percent Poverty Percent Poverty Percentage of Population with a High School Degree Percent Unemployment Percent Unemployment Distance to Shoreline Median Housing Value Median Housing Value Distance to Conservation Easements Percentage of Population with a High School Degree Percentage of Population with a Bachelor’s Degree Population Percentage of Population with a Bachelor’s Degree Median Income Median Income Distance to Bodies of Water Population Distance to Roads Distance to Bodies of Water Distance to Place Distance to Roads Distance to Shoreline Distance to Conservation Easements Distance to Place
- 27. Corporate Timberland Owners Real Estate Investment Trusts (REITs) • Invest the capital of many investors to garner returns for investors • May or may not be publicly traded • Institutional as well as individual investors, most shares are owned by mutual funds Timber Investment Management Organizations (TIMOs) • Management companies that work on behalf of investors to buy, sell, and manage timberland • Most are not publicly traded • Pension funds, endowments, foundations, insurance firms
Editor's Notes
- Forest Inventory Data Online (FIDO). 2012. USDA Forest Service
- USDA Forest Service. 2005, 1999
- Top ownership class is now corporate (63%), then industry (18%) Industry land is primarily owned by Cedar Creek/T.R. Miller, but includes new industrial companies that have formed
- The Mobile-Tensaw Delta and Perdido River-Longleaf Hills tracts
- Many NIPF owners, most owned less than 2,000 acres and were located near the land they owned Corporate owners owned larger tracts and were located further away Spread of orange dots indicates many absentee investors
- Sigma = the estimated standard deviation for the residuals A higher Sigma value (SD) indicates that the variables were not consistent across the study area Also tested for high school degrees, population, distance to conservation easements, distance to shoreline (were not significant in any models)
- Getis-Ord Gi* , 99% confidence level