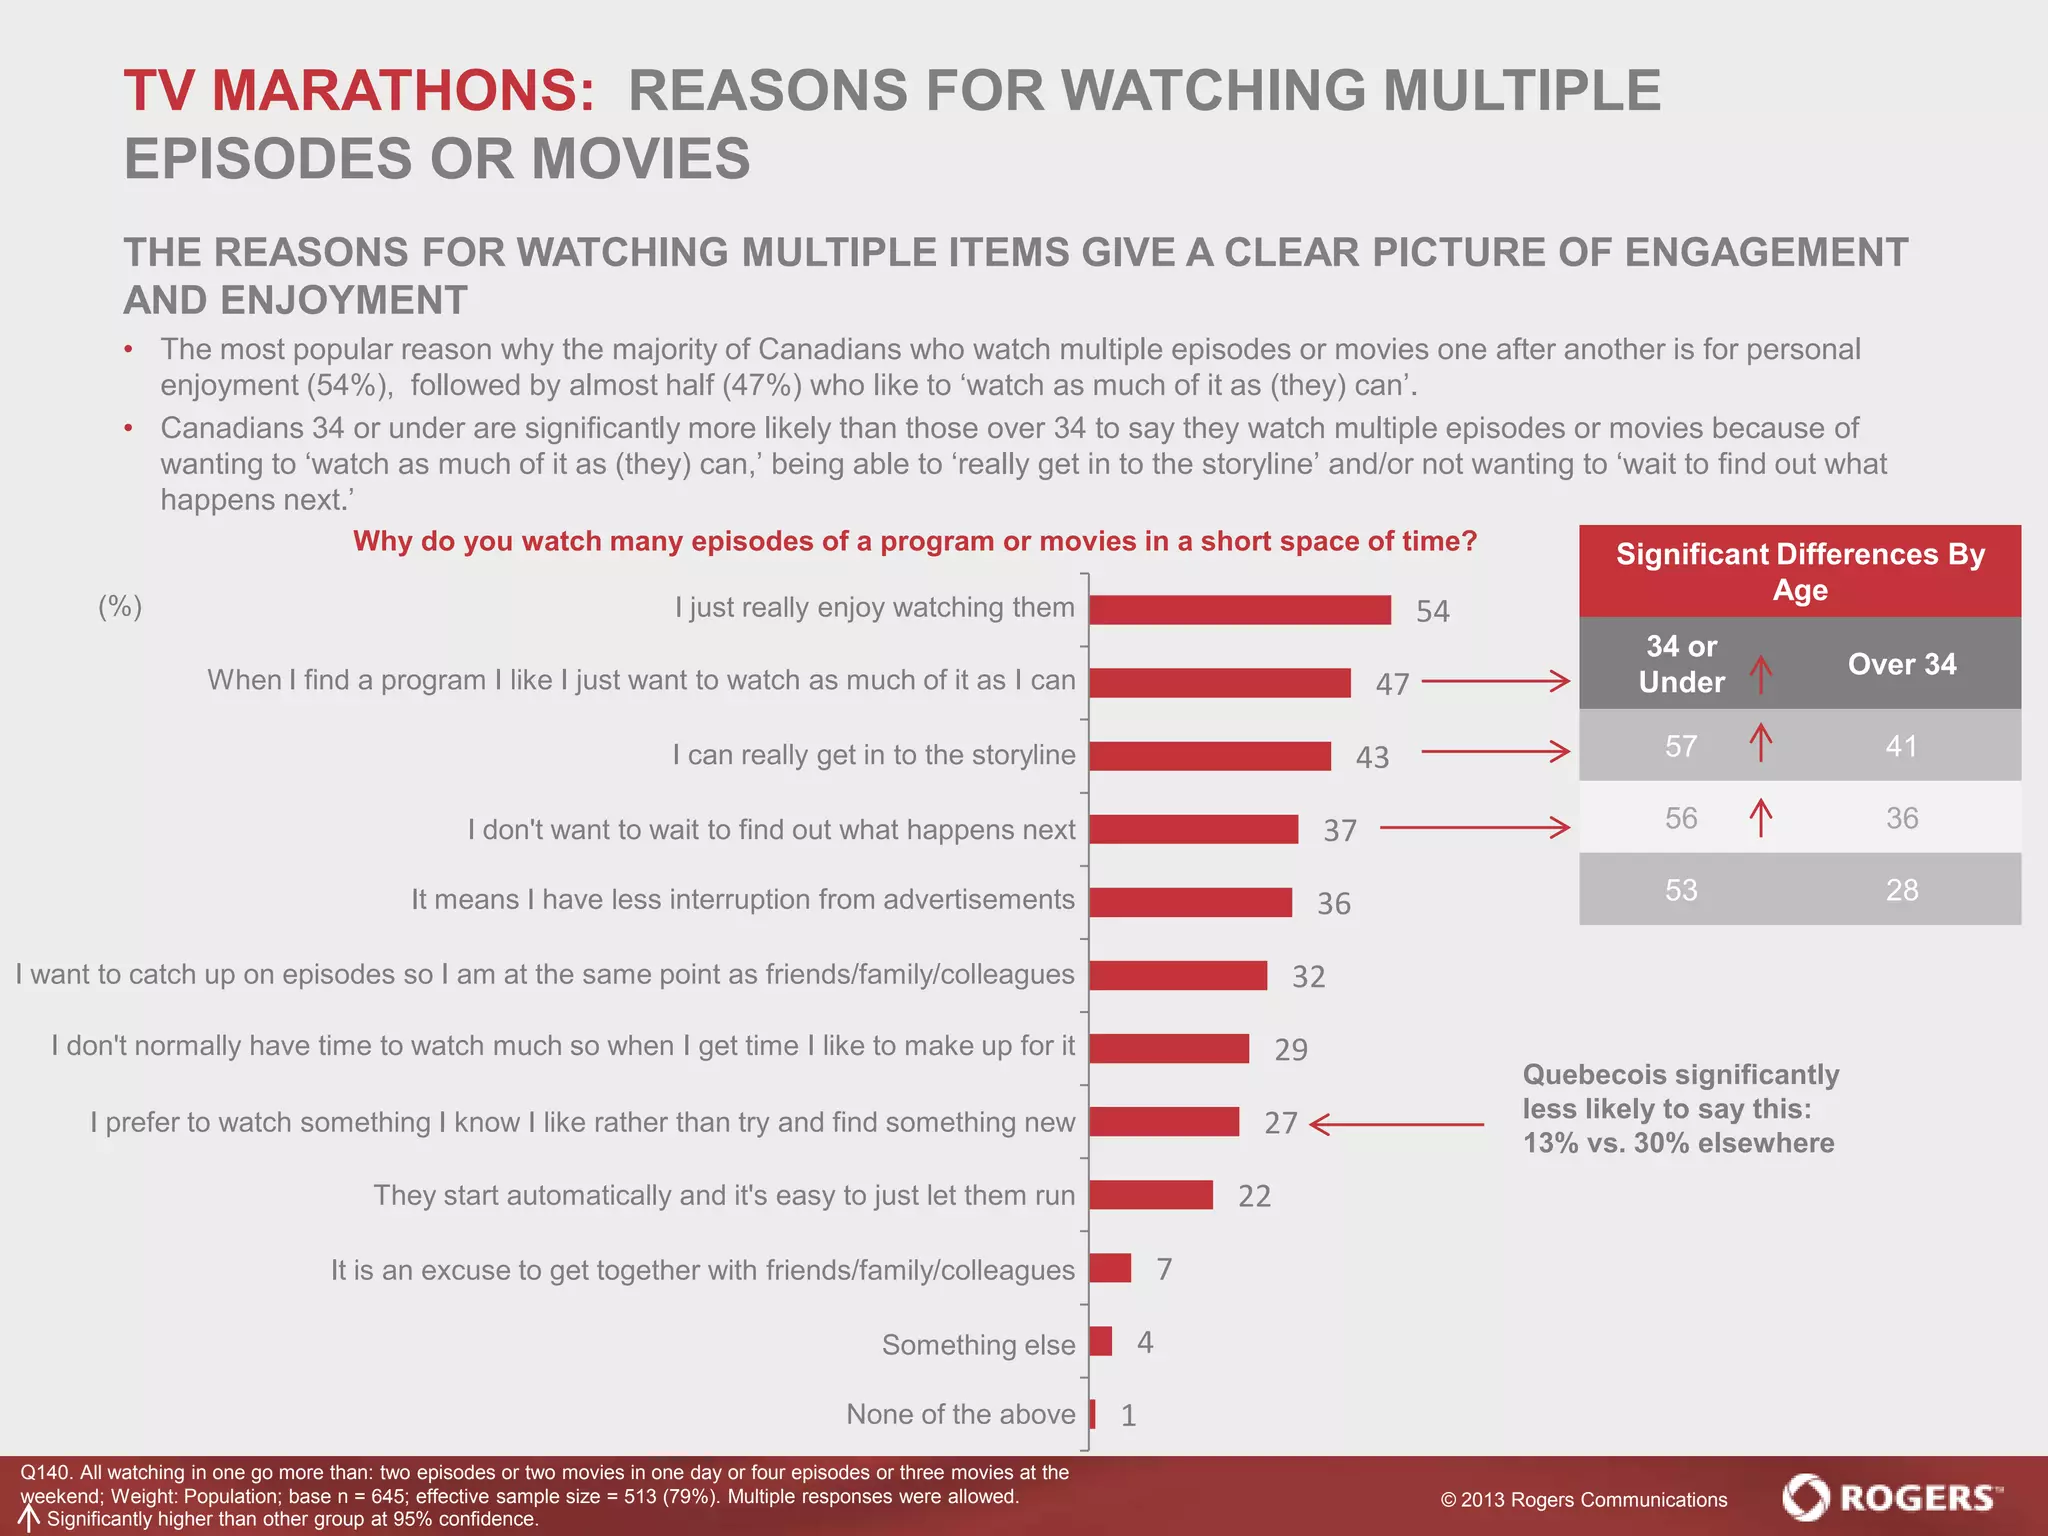
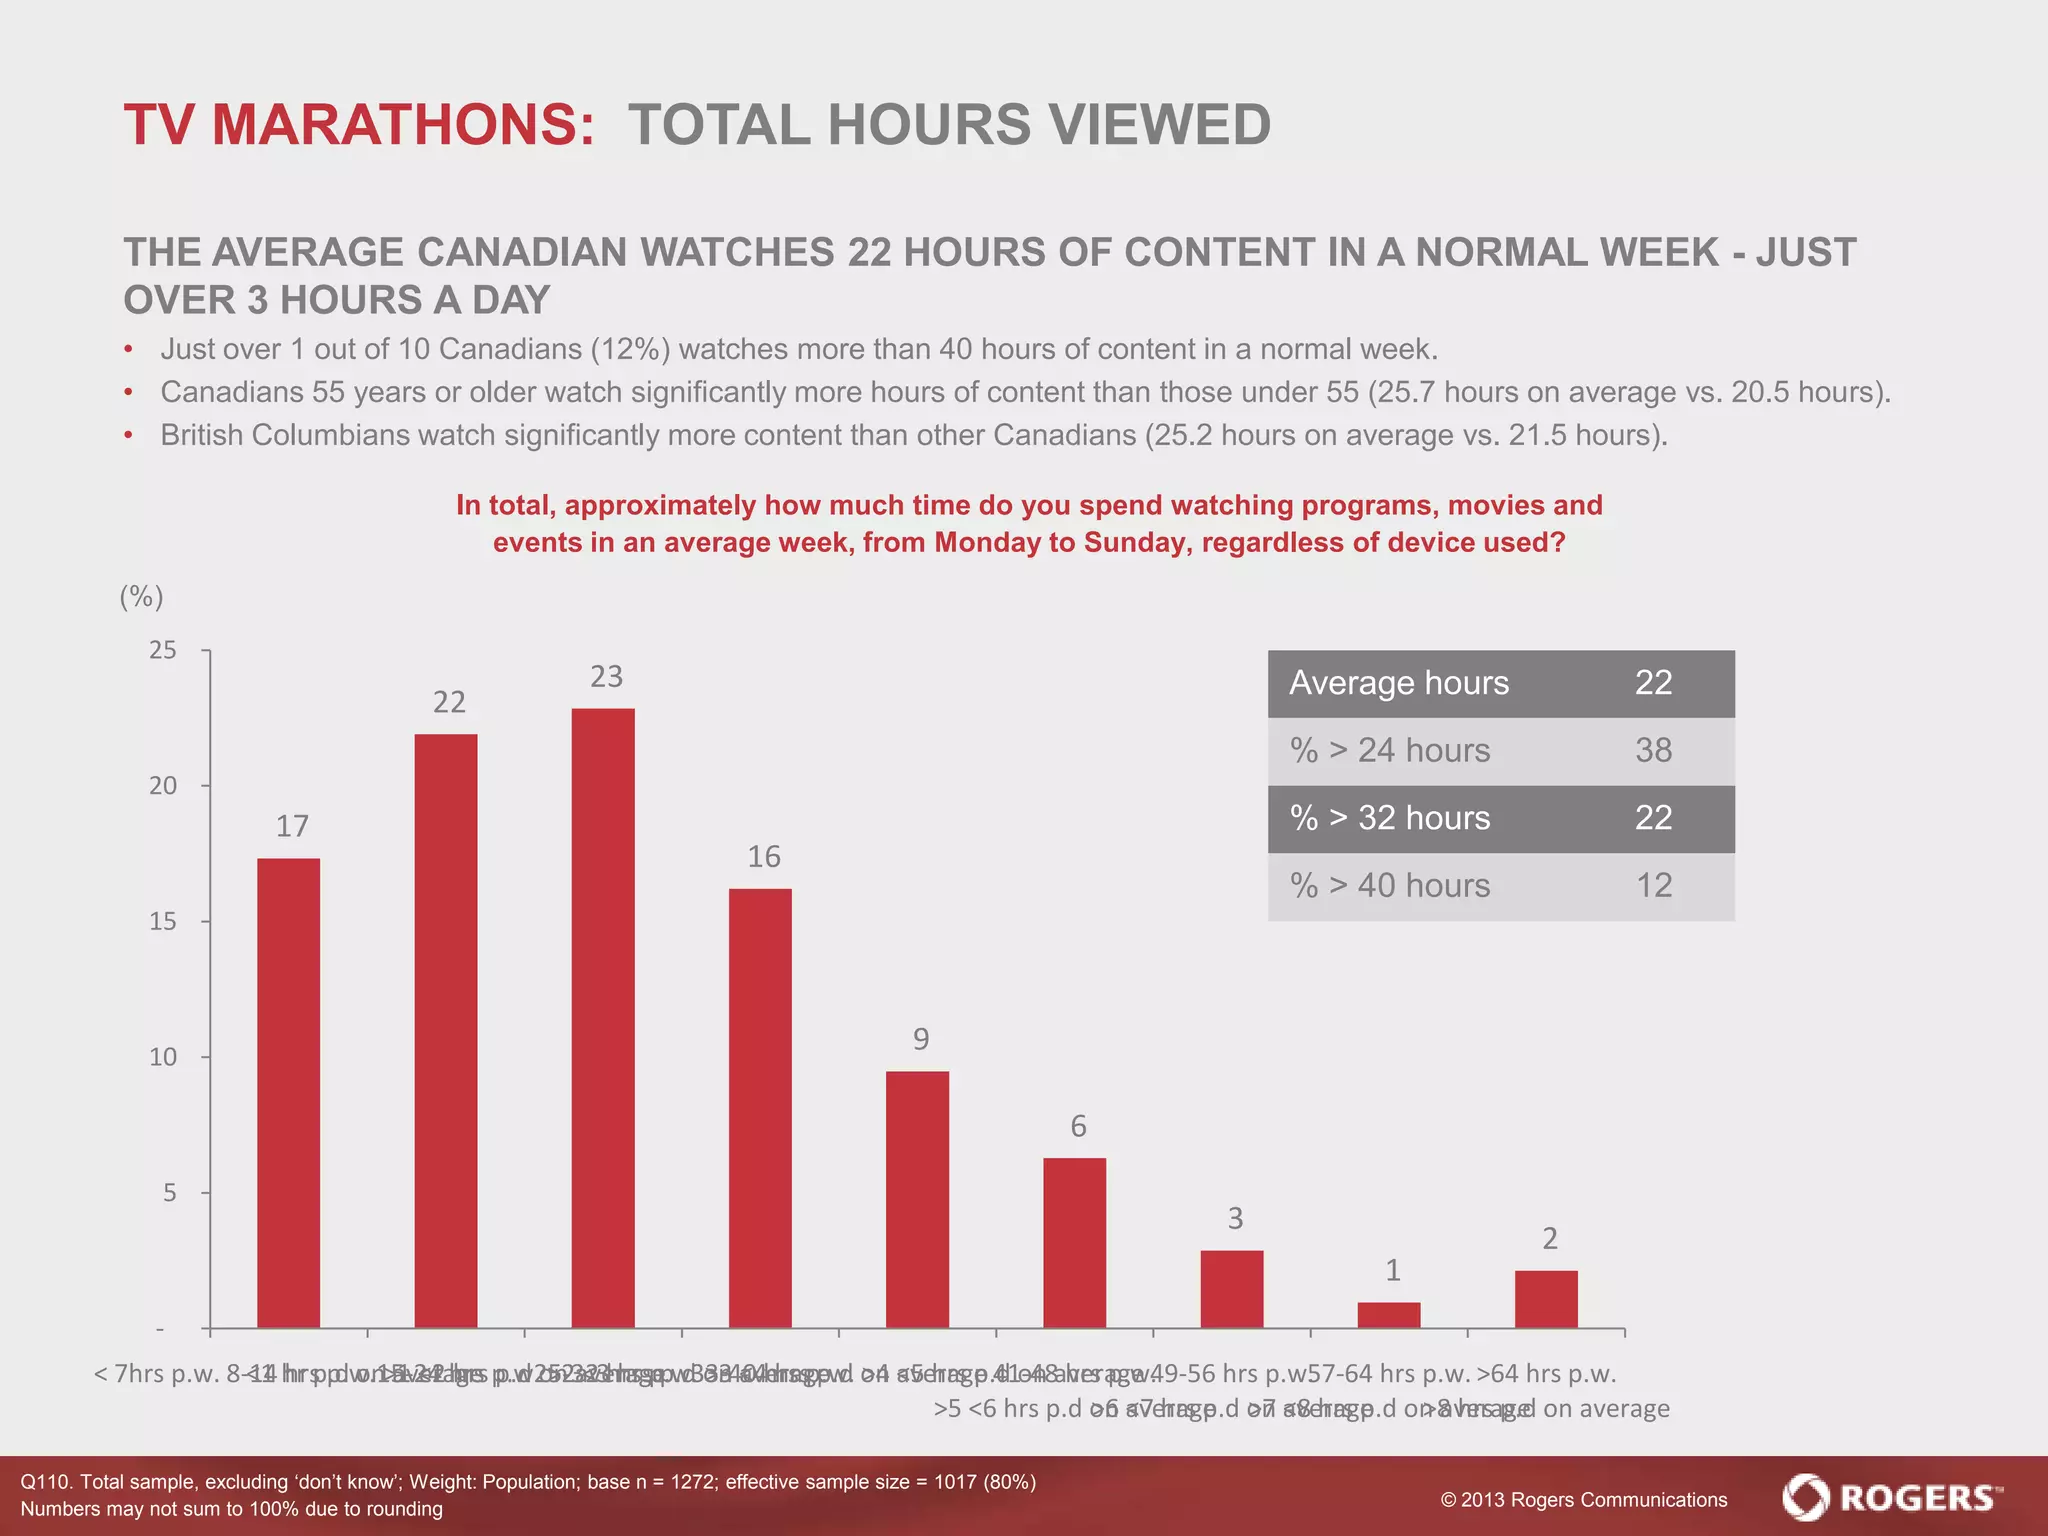
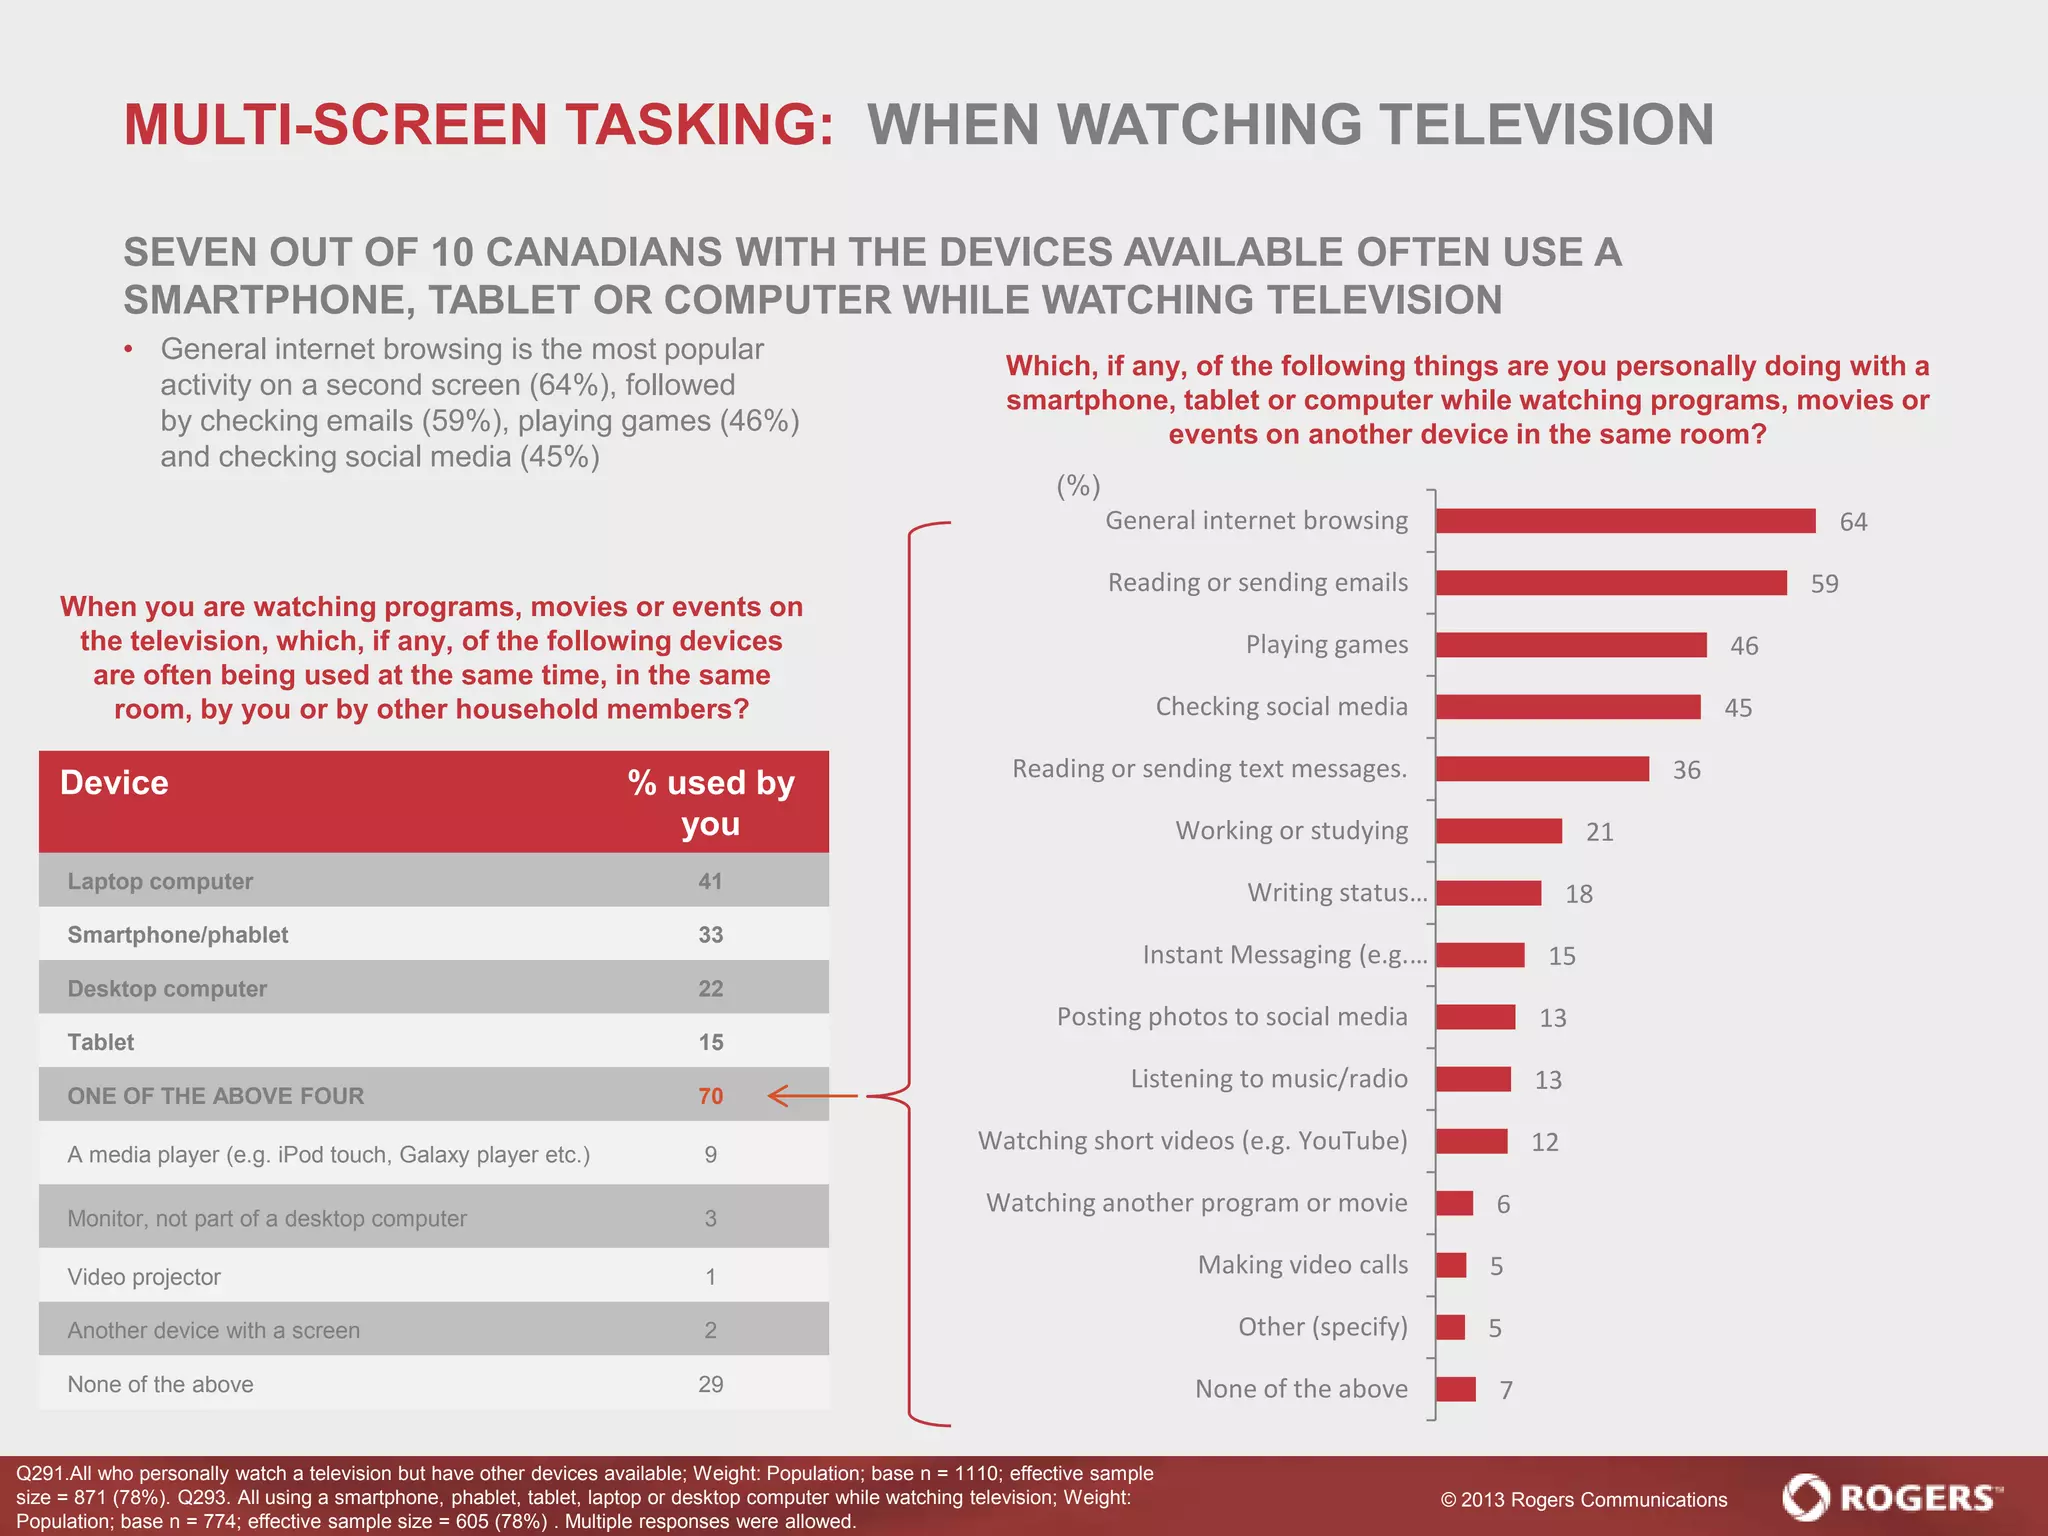
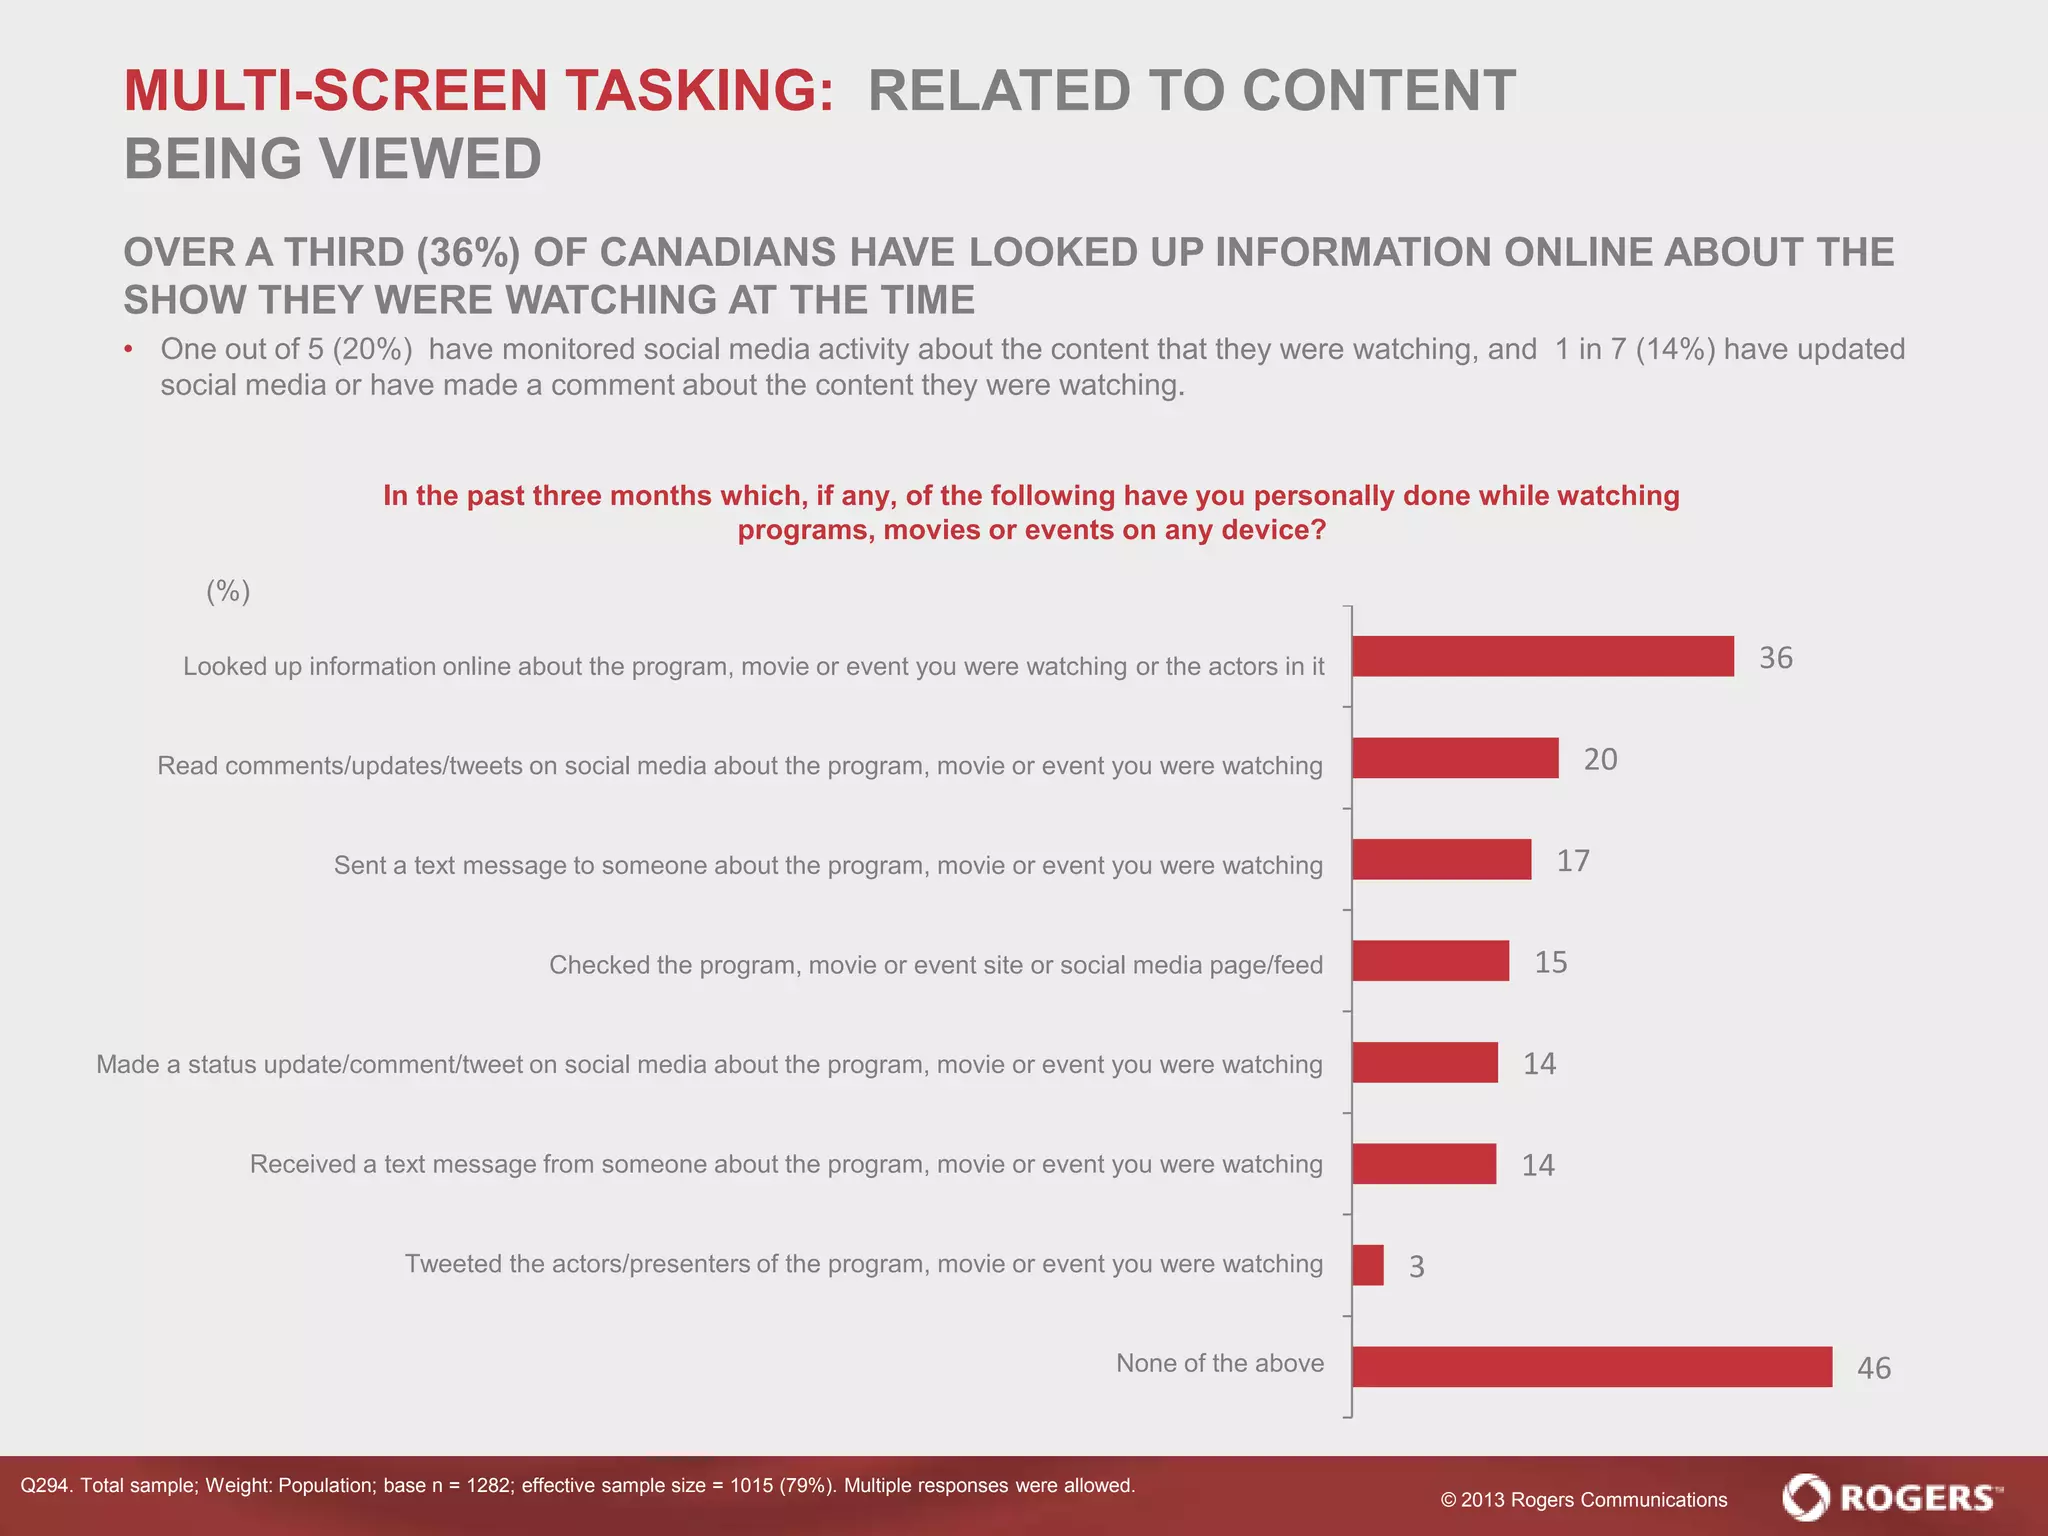
SlideShare a Scribd company logo
1 of 19
© 2013 Rogers Communications
ROGERS INNOVATION REPORT:
TV VIEWING HABITS
Quantitative Research Highlights
May 2013
© 2013 Rogers Communications
ROGERS INNOVATION REPORT: RESEARCH METHOD
• A national survey of n=1,000 respondents was conducted by Head Research
among adult Canadians, along with an additional n=275 interviews to augment the
sample size of particular regions.
– Respondents were sourced from available non-probability based panels. The
national sample size of N=1,275 provides a statistical margin of error of +/- 2.7%, 19
times out of 20, assuming that panelists do not differ from non-panelists and
respondents do not differ from non-respondents. Analyses of sub-groups are
subject to a larger margin of error due to the smaller size of such groups.
– The national-level data in this report has been weighted to match the national
population profile, therefore reducing the influence of regions with additional
interviews back to their non-augmented proportions.
– Fieldwork was conducted between April 3 and April 8, 2013.
– Numbers shown in the report may not sum to 100% due to rounding to the nearest
whole number, or where multiple responses were allowed. These instances are
noted on relevant charts.
© 2013 Rogers Communications
56
69
12
18
22
16
21
31
22
15
67
51
0 20 40 60 80 100
Up to 2 hours 3 to 4 hours 5 hours or more
Think back over the last year and try to recall when you spent the most amount of time watching programs, movies
and events from any source. Please tell us the number of hours you recall spending on each of the items below.
Average
hours
5.6
6.8
2.4
3.1
Q130a/b. Total, excluding Don't knows; bases Q130a n=1022, Q130b n= 1032; effective sample sizes Q130a n=813, Q130b
n=821 (80%) Q130c/d. All On-Demand viewers, excluding Don’t knows; Weight: Population; Q130c base n= 559, Q130d base
n=562; effective sample sizes Q130c n=445, Q130d n=447 (80%)
The greatest number of hours
you have spent watching…
…programs, movies or events in one
day during the week
...programs, movies or events in one
day during the weekend
...On-demand content in one day
during the week
...On-demand content in one day
during the weekend
(%)
TV MARATHONS: TOTAL HOURS VIEWED
THE AVERAGE CANADIAN’S LONGEST VIEWING MARATHON LASTED 5.6 HOURS ON A
WEEK DAY AND ALMOST 7 HOURS DURING THE WEEKEND
• Two-thirds of Canadians (67%) have had a viewing marathon that has lasted 5 hours or more during the weekend and half (51%)
have watched the same amount on a week day.
• Growing in momentum, the average On-Demand viewing marathon is less than half the length of the average viewing marathon from
other sources, with marathon viewing more predominant on weekends than weekdays.
• Households with children have had significantly shorter weekday viewing marathons than households without (4.9 hours on average
vs. 6.0 hours). Males have had significantly longer weekend viewing marathons than females (7.2 hours on average vs. 6.3 hours).
© 2013 Rogers Communications
68
84
36
47
25
11
27
30
7
5
37
24
0 20 40 60 80 100
Up to 2 episodes/movies 3 to 4 episodes/movies
5 episodes/movies or more
Some people like to watch several episodes of a program or movies back-to-back, or in a concentrated period of time.
So, still regarding the past year, please now think about the total number of episodes of a program, or total number of
movies you recall watching back-to-back, one after the other, from any source. Please enter the numbers below.
Average #
4.0
4.6
1.7
2.2
…episodes of a program that you've watched back-
to-back, one after the other during the week
... episodes of a program that you've watched
back-to-back, one after the other during the
weekend
...movies that you've watched back-to-back, one
after the other during the week
...movies that you've watched back-to-back, one
after the other during the weekend
TV MARATHONS: TOTAL EPISODES/MOVIES VIEWED BACK-TO-
BACK
THE AVERAGE CANADIAN HAS WATCHED 4 EPISODES OF A PROGRAM BACK-TO-BACK ON A
WEEKDAY
• Viewing sessions during the weekend are longer: an average of 4.6 episodes on the weekend vs. 4.0 episodes on a weekday.
• Over a third of Canadians (37%) have watched 5 or more episodes in a row on the weekend.
• Almost a third (32%) of Canadians have watched 3 or more movies in a row on the weekend (a combination of 25% who have watched
3 to 4 movies and 7% who have watched 5 or more movies).
• Overall, 81% of Canadians have watched 3 or more episodes back-to-back or 2 or more movies back-to-back at some point in the past
year.
Q135a-d. Total, excluding Don't knows, Weight: Population; bases range from 1004 to 1034; effective bases range from 798 to
828 (79%); Numbers may not sum to 100% due to rounding
The greatest number of hours
you have spent watching…
(%)
© 2013 Rogers Communications
TV MARATHONS: TOTAL EPISODES/MOVIES VIEWED BACK-TO-
BACK BY AGE
CANADIANS 34 OR UNDER HAVE HAD SIGNIFICANTLY LONGER TV MARATHONS THAN
THOSE OVER 34
• Canadians aged 35 to 54 have significantly longer weekend marathons than those aged 55 or over.
5.4
3.5
3.3
6.6
4.2
3.2
2.1
1.6
1.4
2.6
2.2
1.8
0
1
2
3
4
5
6
7
34 or under 35 to 54 55 or over
Averagenumberofepisodes/moviesviewedback-to-back
Episodes back-to-back during the week Episodes back-to-back during the weekend
Movies back-to-back during the week Movies back-to-back during the weekend
Some people like to watch several episodes of a program or movies back-to-back, or in a concentrated period of time.
So, still regarding the past year, please now think about the total number of episodes of a program, or total number of
movies you recall watching back-to-back, one after the other, from any source. Please enter the numbers below.
All
All
All
All
Significantly higher than named group at 95% confidence
55 or over
55 or over
Q135a-d. Total, excluding Don't knows, Weight: Population; bases range from 290 to 409; effective bases range from 213 to
330 (79%)
© 2013 Rogers Communications
• An On-Demand Marathon Viewer has watched one of
the following amounts of On-Demand content on their
television in the past year:
• 3 or more episodes of a program back-to-back
on a weekday
• 3 or more episodes of a program back-to-
back during the weekend
• 3 or more episodes of a program over an entire
weekend
• More than 2 movies back-to-back on a weekday
• More than 2 movies back-to-back during the
weekend
• More than 2 movies over an entire weekend
On-
Demand
Marathon
Viewers
57%
43%
ON-DEMAND MARATHON VIEWERS: DEFINITION
MORE THAN 4 OUT OF 10 ON-DEMAND VIEW CONTENT IN MARATHON SESSIONS
Q137. Now think about the maximum amount of time you have spent watching programs or movies using On-Demand services over the past
year on your television. Please enter the numbers in the boxes below.Constructed variable from Q137a-f. All On-Demand Viewers with a
television, excluding Don't knows answering at least one of Q137a-f. Weight: Population; base n = 567; effective sample sizes = 456 (80%)
© 2013 Rogers Communications
1
4
7
22
27
29
32
36
37
43
47
54
Why do you watch many episodes of a program or movies in a short space of time?
Quebecois significantly
less likely to say this:
13% vs. 30% elsewhere
Significant Differences By
Age
34 or
Under
Over 34
57 41
56 36
53 28
(%)
Significantly higher than other group at 95% confidence.
TV MARATHONS: REASONS FOR WATCHING MULTIPLE
EPISODES OR MOVIES
THE REASONS FOR WATCHING MULTIPLE ITEMS GIVE A CLEAR PICTURE OF ENGAGEMENT
AND ENJOYMENT
• The most popular reason why the majority of Canadians who watch multiple episodes or movies one after another is for personal
enjoyment (54%), followed by almost half (47%) who like to ‘watch as much of it as (they) can’.
• Canadians 34 or under are significantly more likely than those over 34 to say they watch multiple episodes or movies because of
wanting to ‘watch as much of it as (they) can,’ being able to ‘really get in to the storyline’ and/or not wanting to ‘wait to find out what
happens next.’
I just really enjoy watching them
When I find a program I like I just want to watch as much of it as I can
I can really get in to the storyline
I don't want to wait to find out what happens next
It means I have less interruption from advertisements
I want to catch up on episodes so I am at the same point as friends/family/colleagues
I don't normally have time to watch much so when I get time I like to make up for it
I prefer to watch something I know I like rather than try and find something new
They start automatically and it's easy to just let them run
It is an excuse to get together with friends/family/colleagues
Something else
None of the above
Q140. All watching in one go more than: two episodes or two movies in one day or four episodes or three movies at the
weekend; Weight: Population; base n = 645; effective sample size = 513 (79%). Multiple responses were allowed.
© 2013 Rogers Communications
17
22
23
16
9
6
3
1
2
-
5
10
15
20
25
< 7hrs p.w. <1 hr p.d on average8-14 hrs p.w. >1 <2 hrs p.d on average15-24 hrs p.w. >2 <3 hrs p.d on average25-32 hrs p.w. >3 <4 hrs p.d on average33-40 hrs p.w. >4 <5 hrs p.d on average41-48 hrs p.w.
>5 <6 hrs p.d on average
49-56 hrs p.w.
>6 <7 hrs p.d on average
57-64 hrs p.w.
>7 <8 hrs p.d on average
>64 hrs p.w.
>8 hrs p.d on average
Q110. Total sample, excluding ‘don’t know’; Weight: Population; base n = 1272; effective sample size = 1017 (80%)
In total, approximately how much time do you spend watching programs, movies and
events in an average week, from Monday to Sunday, regardless of device used?
Average hours 22
% > 24 hours 38
% > 32 hours 22
% > 40 hours 12
Numbers may not sum to 100% due to rounding
(%)
TV MARATHONS: TOTAL HOURS VIEWED
THE AVERAGE CANADIAN WATCHES 22 HOURS OF CONTENT IN A NORMAL WEEK - JUST
OVER 3 HOURS A DAY
• Just over 1 out of 10 Canadians (12%) watches more than 40 hours of content in a normal week.
• Canadians 55 years or older watch significantly more hours of content than those under 55 (25.7 hours on average vs. 20.5 hours).
• British Columbians watch significantly more content than other Canadians (25.2 hours on average vs. 21.5 hours).
© 2013 Rogers Communications
Q291.All who personally watch a television but have other devices available; Weight: Population; base n = 1110; effective sample
size = 871 (78%). Q293. All using a smartphone, phablet, tablet, laptop or desktop computer while watching television; Weight:
Population; base n = 774; effective sample size = 605 (78%) . Multiple responses were allowed.
Device % used by
you
Laptop computer 41
Smartphone/phablet 33
Desktop computer 22
Tablet 15
ONE OF THE ABOVE FOUR 70
A media player (e.g. iPod touch, Galaxy player etc.) 9
Monitor, not part of a desktop computer 3
Video projector 1
Another device with a screen 2
None of the above 29
64
59
46
45
36
21
18
15
13
13
12
6
5
5
7
General internet browsing
Reading or sending emails
Playing games
Checking social media
Reading or sending text messages.
Working or studying
Writing status…
Instant Messaging (e.g.…
Posting photos to social media
Listening to music/radio
Watching short videos (e.g. YouTube)
Watching another program or movie
Making video calls
Other (specify)
None of the above
Which, if any, of the following things are you personally doing with a
smartphone, tablet or computer while watching programs, movies or
events on another device in the same room?
When you are watching programs, movies or events on
the television, which, if any, of the following devices
are often being used at the same time, in the same
room, by you or by other household members?
(%)
MULTI-SCREEN TASKING: WHEN WATCHING TELEVISION
SEVEN OUT OF 10 CANADIANS WITH THE DEVICES AVAILABLE OFTEN USE A
SMARTPHONE, TABLET OR COMPUTER WHILE WATCHING TELEVISION
• General internet browsing is the most popular
activity on a second screen (64%), followed
by checking emails (59%), playing games (46%)
and checking social media (45%)
© 2013 Rogers Communications
36
20
17
15
14
14
3
46
Q294. Total sample; Weight: Population; base n = 1282; effective sample size = 1015 (79%). Multiple responses were allowed.
In the past three months which, if any, of the following have you personally done while watching
programs, movies or events on any device?
Looked up information online about the program, movie or event you were watching or the actors in it
Read comments/updates/tweets on social media about the program, movie or event you were watching
Sent a text message to someone about the program, movie or event you were watching
Checked the program, movie or event site or social media page/feed
Made a status update/comment/tweet on social media about the program, movie or event you were watching
Received a text message from someone about the program, movie or event you were watching
Tweeted the actors/presenters of the program, movie or event you were watching
None of the above
(%)
MULTI-SCREEN TASKING: RELATED TO CONTENT
BEING VIEWED
OVER A THIRD (36%) OF CANADIANS HAVE LOOKED UP INFORMATION ONLINE ABOUT THE
SHOW THEY WERE WATCHING AT THE TIME
• One out of 5 (20%) have monitored social media activity about the content that they were watching, and 1 in 7 (14%) have updated
social media or have made a comment about the content they were watching.
© 2013 Rogers Communications
10
5
14
31
38
58
71
75
27
90
96
8
4
10
23
27
42
57
60
23
84
90
Another device with a screen
Video projector
Monitor, not part of desktop computer
Tablet
Media player
Smartphone/Phablet
Desktop computer
Laptop computer
Internet-enabled television
Television, not internet-enabled
Television, Any (NET)
% Using device personally % With device available in household
Q100. Total sample; Weight: Population; base n = 1282; effective sample size = 1029 (80%) . Multiple responses were allowed.
Average # used personally Average # in household
1.6 2.2
1.3 1.8
0.3 0.4
0.7 1.1
0.6 0.9
0.5 1.1
0.3 0.6
0.2 0.4
0.1 0.2
0 0.1
0.1 0.1
How many of the following devices, if any, do you, personally, use to view programs, movies and events, and how many, if any, are available in your
household?
(%)
TV MARATHONS: DEVICES USED TO VIEW CONTENT
NINE OUT OF 10 (90%) CANADIANS WATCH CONTENT ON A TELEVISION
• Computers are the second most popular devices to watch content on, with 60% of Canadians viewing content on a laptop, and 57%
on a desktop. Smartphones and tablets are also popular, at 42% and 23% each, respectively.
• Almost 9 out of 10 (86%) Canadians watch content on a device other than a television, rising to 92% for those under 34.
• Seven out of 10 (71%) Canadians watch content on a laptop, smartphone/phablet or tablet, rising to 86% for those under 34.
© 2013 Rogers Communications
76
56
49
47
39
33
19
12
10
9
9
7
5
3
2
1
1
0
7
When eating on your own
In bed
When eating with others
When cooking
When doing household chores
When exercising
When on a phone call
When at work
When sitting on the toilet
In a car/van/truck/motorcycle
When on public transport/commuting
When in the bath
When waiting in line
When at school, but not attending a class
When attending a class at school
During a meeting
When attending a public performance
When attending a religious ceremony
None of the above
Q320. All viewing content on smartphone , phablet or tablet; Weight: Weight; base n = 608; effective sample size = 486 (80%) .
Multiple responses were allowed.
Have you ever watched programs, movies and events in any of the following situations?
VIEWING HABITS: SITUATIONS WHERE CONTENT IS WATCHED
OVER HALF (54%) OF CANADIANS WHO VIEW CONTENT ON A SMARTPHONE, PHABLET OR
TABLET HAVE VIEWED CONTENT IN BED
• More than 1 out of 10 (12%) Canadians who view content on a smartphone, phablet or tablet have viewed content at work.
(%)
© 2013 Rogers Communications
80
44
36
33
26
11
8
6
3
3
2
2
2
13
Went to bed late
Neglected household chores
Been tired at work because you stayed up
Grabbed something quick to eat instead of making a proper meal
Got out of bed early
Been too tired to take as much care in your appearance as normal…
Rescheduled plans to meet friends or family
Arrived at work late because you stayed up
Not gone to planned meetings with friends or family
Arrived at school late because you stayed up
Called in to work "sick"
Stayed away from school "sick"
Skipped/stood up a date
None of the above
Q350. Total sample; Weight: Population; base n = 1282; effective sample size = 994 (78%).
TV MARATHONS: EFFECTS ON DAILY LIFE
EIGHT OUT OF 10 CANADIANS HAVE GONE TO BED LATE IN ORDER TO WATCH A PROGRAM,
EVENT OR MOVIE
• Many have neglected household chores (44%), been tired the next day because they stayed up late (36%), and/or grabbed
something quick to eat instead of making a proper meal (33%) as a result of watching a program, movie or event. One in 10 (11%)
have allowed their viewing habits to affect their appearance the next day from being too tired.
• Significantly more women (51%) than men (38%) say they have neglected household chores in order to watch a program, event or
movie.
Which, if any, of the following have ever happened to you because you wanted to watch a program, movie or
event?
Significant
differences by
Gender
Male Female
Neglected household
chores
38 51
Got out of bed early 30 21
Arrived at work late 8 4
(%)
Significantly higher than other group at 95% confidence. Multiple responses were allowed.
© 2013 Rogers Communications
4
3
10
12
16
17
19
20
33
34
34
37
40
52
53
62
None of the above
Something else
Musicals
Westerns
War
Animation
Horror
Epic/historical
Crime/Gangster
Documentaries
Sci-fi/fantasy
Thrillers
Adventure
Drama
Action
Comedy
Q201. Total sample; Weight: Population; base n = 1282; effective sample size = 1029 (80%)
And which genres or styles of programs or movies are you most likely to spend large single amounts of time
watching? By single amounts of time we mean watching several programs or movies back-to-back, one after the
other, or in a prolonged, concentrated period of time
% Significant differences by age
Genre
34 or
under
35-54 55 or over
Comedy 71 62 52
Horror 28 17 10
Animation 25 17 9
Westerns 6 12 18
(%)
Significantly higher/lower than other group at 95% confidence. Multiple responses were allowed.
TV MARATHONS: PROGRAM OR MOVIE GENRES
CANADIANS’ FAVOURITE GENRES FOR MARATHONS ARE COMEDY, ACTION AND DRAMA
• Six out of 10 (62%) Canadians say they are most likely to spend large single amounts of time watching comedy, and over half (53%)
watching action and/or drama (52%).
• There are significant differences by age: those under 34 are more likely to say they’ll watch comedy, horror and animation, and less
likely to watch Westerns.
© 2013 Rogers Communications
30
22
33 30
17 15
49
0
20
25
32 33
19 16
52
2
25 23
32 31
18 15
51
1
I let my spouse/partner
choose whatever he/she
wants to watch
My spouse/partner lets
me choose whatever I
want to watch
My spouse/partner
chooses something
he/she thinks we'll both
like
I choose something I
think we'll both like
My spouse/partner will
give me a few options to
choose between
I will give my
spouse/partner a few
options to choose
between
We'll decide together Other
Male Female Overall
Q246. All with a spouse/partner but no children who watch content at least rarely with the spouse/partner;
Weight: Population; base n = 514; effective sample size = 399 (78%) . Multiple responses were allowed.
1
1
11
39
49
Never
I prefer not to say
Rarely
Somewhat…
Very frequently
When you watch programs, movies or events with your spouse/partner which, if any, of
the following are ways you decide what to watch?
• The majority (88%) of people who live with a spouse or partner but have no
children in their household watch content together.
• Deciding what to watch is largely a matter of compromise: half (51%) of those
watching content together decide together and almost a further third (31%)
choose something they think their partner will like.
• A quarter (25%) are likely to let their partner choose what to watch, and men are
significantly more likely to claim they let their partner choose what to watch (30%
men vs. 20% women).
How often do you watch
programs, movies or events together
with your spouse/partner?
Q245. All with a spouse/partner but no children; Weight: Population; base n = 520; effective sample size = 404 (78%)
Numbers may not sum to 100% due to rounding
(%)
Significantly higher than named group at 95% confidence
Female
(%)
WATCHING WITH OTHERS: WITH SPOUSE/PARTNER
MEN ARE MORE LIKELY TO CLAIM THAT THEY LET THEIR PARTNER CHOOSE WHAT TO
WATCH
© 2013 Rogers Communications
4
6
3
6
10
13
15
15
30
32
35
36
37
42
53
I am unlikely to spend long, single amounts of time…
Something else
Religious programs
Children's educational content
Children's entertainment, including non-educational…
Music
Travel
Game shows
Interests/hobbies
Reality TV
News, reporting and analysis
Sports
Documentaries
Sitcoms
Drama
Q200. Total sample; Weight: Population; base n = 1282; effective sample size = 1026 (80%)
Which type or types of programs or events are you most likely to spend large single amounts of time watching? By single amounts
of time we mean watching several programs or events back-to-back, one after the other or prolonged coverage of one event (e.g.
news coverage of a catastrophe, golf tournaments)
Significant
differences by gender
Male Female
Sports 52 20
Documentaries 42 32
Drama 43 63
Significantly higher than other group at 95% confidence. Multiple responses were allowed.
(%)
TV MARATHONS: PROGRAM OR EVENT TYPES
CANADIANS ARE MOST LIKELY TO SPEND LARGE AMOUNTS OF TIME WATCHING DRAMA
(53%) AND SITCOMS (42%)
• Documentaries, sports and news/analysis are all also popular at 37%, 36% and 35% respectively.
• Sport is significantly more popular among males than females (52% vs. 20%), and drama significantly less popular among males
than females (43% vs. 63%).
© 2013 Rogers Communications
48
13161620222434
52
87848480787666
ANY TV PARTYSomething elseReality TVAn awards
ceremony (e.g.
Oscars, Golden
Globes)
A season
premiere/finale
Some or all of a
season of a program
Several movies
back-to-back
A sporting event on
any device
Not hosted or attended Hosted or attended
Q300. Total sample; Weight: Population; base n = 1282; effective sample size = 1004 (78%)
Over the past year, have you hosted or attended any parties/get-togethers arranged
for watching any of the following types of programs, movies or events?
Did both men and women attend the most recent
program/movie party/get-together, or was it just for one
gender? 76 13 8 3
How many people in total attended the most recent
program/movie party/get-together?
37 42
16
5
Under 5 5 to 9 10 to 19 20 or more
Average
attendance
7.3
Q301/Q30. All hosting or attending a viewing party; Weight: Population; base n = 609; effective sample size = 491 (81%)
(%)
WATCHING WITH OTHERS: VIEWING PARTIES
ALMOST HALF OF CANADIANS (48%) HAVE ATTENDED A VIEWING PARTY IN THE LAST YEAR
• Sport is the most popular category of viewing party, with 34% having attended and/or hosted a sports-based viewing party.
• The majority of viewing parties (76%) are open to men and women, and the average number of attendees is just over seven (7.3).
© 2013 Rogers Communications
Appendix
© 2013 Rogers Communications
30
19
11 9
12 12
9
38
24
13 11
2 2
11
0
10
20
30
40
50
Ontario Quebec British
Columbia
Alberta New Brunswick Newfoundland
and Labrador
Other
Region Unweigted
Weighted
15
18
24
16 16
11
15
18
24
16 17
10
0
10
20
30
40
Less than $30,000 $30,000 to
$49,999
$50,000 to
$74,999
$75,000 to
$99,999
$100,000 or more Don't know/Prefer
not to answer
Household Income
4
30
34
22
4 64
30
34
22
4 6
0
10
20
30
40
50
Less than high
school
Completed high
school
Partial/complete
technical, college or
CEGEP
Partial/complete
undergraduate
Partial/complete
professional
Partial/complete
master's or higher
Educational attainment
46
5450 50
0
20
40
60
80
Male Female
Gender
28
40
3231
40
29
0
10
20
30
40
50
60
34 or under 35-54 55 or over
Age
18
30
41
11
19
30
38
13
0
10
20
30
40
50
60
Single person With children Spouse/partner, no
children
Other
Household Status
Total sample. Weighted. base n = 1282; effective sample size = 1029 (80%)
Numbers may not sum to 100% due to rounding
APPENDIX: DEMOGRAPHICS
DATA WERE WEIGHTED TO THE NATIONAL POPULATION PROFILE

More Related Content

Similar to Rogers Innovation Report tackles Canadian video viewing habits

Long-Distance Romantic Relationships Survey Report
Long-Distance Romantic Relationships Survey ReportLong-Distance Romantic Relationships Survey Report
Long-Distance Romantic Relationships Survey ReportJonathan (Yoni) Karpfen
 
Extension's On TV - What Does the Public Think ? ACE Charleston
Extension's On TV - What Does the Public Think ?  ACE CharlestonExtension's On TV - What Does the Public Think ?  ACE Charleston
Extension's On TV - What Does the Public Think ? ACE CharlestonLeighton Spann, APR
 
Anticipating 2017 Trends and What to Do About Them | Peter Robinson
Anticipating 2017 Trends and What to Do About Them | Peter RobinsonAnticipating 2017 Trends and What to Do About Them | Peter Robinson
Anticipating 2017 Trends and What to Do About Them | Peter RobinsonJessica Tams
 
2013 Edelman Global Entertainment Study - Brazil
2013 Edelman Global Entertainment Study - Brazil2013 Edelman Global Entertainment Study - Brazil
2013 Edelman Global Entertainment Study - BrazilEdelman
 
ThinkNow Media™ Explores Streaming and Live TV Habits of Total Market Consumers
ThinkNow Media™ Explores Streaming and Live TV Habits of Total Market ConsumersThinkNow Media™ Explores Streaming and Live TV Habits of Total Market Consumers
ThinkNow Media™ Explores Streaming and Live TV Habits of Total Market ConsumersThinkNow
 
F&M survey, presentation of results 23 nov
F&M survey, presentation of results 23 novF&M survey, presentation of results 23 nov
F&M survey, presentation of results 23 novGAD3_com
 
A look at the UK's alcohol drinking habits
A look at the UK's alcohol drinking habitsA look at the UK's alcohol drinking habits
A look at the UK's alcohol drinking habitsHarris Interactive UK
 
Podcast Listening Habits Survey
Podcast Listening Habits SurveyPodcast Listening Habits Survey
Podcast Listening Habits SurveyJeffrey Henning
 
Enjoying the Outdoors - Monitoring the impact of Coronavirus and social dista...
Enjoying the Outdoors - Monitoring the impact of Coronavirus and social dista...Enjoying the Outdoors - Monitoring the impact of Coronavirus and social dista...
Enjoying the Outdoors - Monitoring the impact of Coronavirus and social dista...AnasUnended
 
Rss Oct 2011 Mixed Modes Pres5
Rss Oct 2011 Mixed Modes Pres5Rss Oct 2011 Mixed Modes Pres5
Rss Oct 2011 Mixed Modes Pres5GerryNicolaas
 
Audience Research Results Analysis
Audience Research Results AnalysisAudience Research Results Analysis
Audience Research Results Analysisdb04803167
 
Reston Community Center 2019 Community Survey
Reston Community Center 2019 Community SurveyReston Community Center 2019 Community Survey
Reston Community Center 2019 Community SurveyFairfax County
 
Target audience questionnaire results
Target audience questionnaire resultsTarget audience questionnaire results
Target audience questionnaire resultsasmediakirbyholsgrove
 
Target audience questionnaire results
Target audience questionnaire resultsTarget audience questionnaire results
Target audience questionnaire resultsasmediakirbyholsgrove
 
Covenant Eyes Barna Study Data
Covenant Eyes Barna Study DataCovenant Eyes Barna Study Data
Covenant Eyes Barna Study DataCovenant Eyes
 
Marketing Research Analysis Report
Marketing Research Analysis ReportMarketing Research Analysis Report
Marketing Research Analysis ReportJoshua Favaro
 
Motorola Phone-Life Balance Study
Motorola Phone-Life Balance StudyMotorola Phone-Life Balance Study
Motorola Phone-Life Balance StudyEmisor Digital
 
Survey results
Survey resultsSurvey results
Survey resultsjjgmedia
 

Similar to Rogers Innovation Report tackles Canadian video viewing habits (20)

Long-Distance Romantic Relationships Survey Report
Long-Distance Romantic Relationships Survey ReportLong-Distance Romantic Relationships Survey Report
Long-Distance Romantic Relationships Survey Report
 
Extension's On TV - What Does the Public Think ? ACE Charleston
Extension's On TV - What Does the Public Think ?  ACE CharlestonExtension's On TV - What Does the Public Think ?  ACE Charleston
Extension's On TV - What Does the Public Think ? ACE Charleston
 
Anticipating 2017 Trends and What to Do About Them | Peter Robinson
Anticipating 2017 Trends and What to Do About Them | Peter RobinsonAnticipating 2017 Trends and What to Do About Them | Peter Robinson
Anticipating 2017 Trends and What to Do About Them | Peter Robinson
 
2013 Edelman Global Entertainment Study - Brazil
2013 Edelman Global Entertainment Study - Brazil2013 Edelman Global Entertainment Study - Brazil
2013 Edelman Global Entertainment Study - Brazil
 
ThinkNow Media™ Explores Streaming and Live TV Habits of Total Market Consumers
ThinkNow Media™ Explores Streaming and Live TV Habits of Total Market ConsumersThinkNow Media™ Explores Streaming and Live TV Habits of Total Market Consumers
ThinkNow Media™ Explores Streaming and Live TV Habits of Total Market Consumers
 
F&M survey, presentation of results 23 nov
F&M survey, presentation of results 23 novF&M survey, presentation of results 23 nov
F&M survey, presentation of results 23 nov
 
A look at the UK's alcohol drinking habits
A look at the UK's alcohol drinking habitsA look at the UK's alcohol drinking habits
A look at the UK's alcohol drinking habits
 
Podcast Listening Habits Survey
Podcast Listening Habits SurveyPodcast Listening Habits Survey
Podcast Listening Habits Survey
 
Q3
Q3Q3
Q3
 
Enjoying the Outdoors - Monitoring the impact of Coronavirus and social dista...
Enjoying the Outdoors - Monitoring the impact of Coronavirus and social dista...Enjoying the Outdoors - Monitoring the impact of Coronavirus and social dista...
Enjoying the Outdoors - Monitoring the impact of Coronavirus and social dista...
 
Rss Oct 2011 Mixed Modes Pres5
Rss Oct 2011 Mixed Modes Pres5Rss Oct 2011 Mixed Modes Pres5
Rss Oct 2011 Mixed Modes Pres5
 
Audience Research Results Analysis
Audience Research Results AnalysisAudience Research Results Analysis
Audience Research Results Analysis
 
Reston Community Center 2019 Community Survey
Reston Community Center 2019 Community SurveyReston Community Center 2019 Community Survey
Reston Community Center 2019 Community Survey
 
Target audience questionnaire results
Target audience questionnaire resultsTarget audience questionnaire results
Target audience questionnaire results
 
Target audience questionnaire results
Target audience questionnaire resultsTarget audience questionnaire results
Target audience questionnaire results
 
Covenant Eyes Barna Study Data
Covenant Eyes Barna Study DataCovenant Eyes Barna Study Data
Covenant Eyes Barna Study Data
 
Marketing Research Analysis Report
Marketing Research Analysis ReportMarketing Research Analysis Report
Marketing Research Analysis Report
 
Motorola Phone-Life Balance Study
Motorola Phone-Life Balance StudyMotorola Phone-Life Balance Study
Motorola Phone-Life Balance Study
 
Unit 4 assignment 1
Unit 4 assignment 1Unit 4 assignment 1
Unit 4 assignment 1
 
Survey results
Survey resultsSurvey results
Survey results
 

More from Rogers Communications

Rogers - Canadian Business Leaders Survey 2015
Rogers - Canadian Business Leaders Survey 2015Rogers - Canadian Business Leaders Survey 2015
Rogers - Canadian Business Leaders Survey 2015Rogers Communications
 
Rogers Innovation Report: Tech Trends 2013
Rogers Innovation Report: Tech Trends 2013Rogers Innovation Report: Tech Trends 2013
Rogers Innovation Report: Tech Trends 2013Rogers Communications
 
Rogers Connected Workplace report 2013
Rogers Connected Workplace report 2013Rogers Connected Workplace report 2013
Rogers Connected Workplace report 2013Rogers Communications
 
Data roaming: The mobile habits of Canadians travelling in the U.S.
Data roaming: The mobile habits of Canadians travelling in the U.S.Data roaming: The mobile habits of Canadians travelling in the U.S.
Data roaming: The mobile habits of Canadians travelling in the U.S.Rogers Communications
 
Rogers Innovation Report: 2012 trend watch
Rogers Innovation Report: 2012 trend watchRogers Innovation Report: 2012 trend watch
Rogers Innovation Report: 2012 trend watchRogers Communications
 
White Paper: Enabling the Mobile Workforce
White Paper: Enabling the Mobile WorkforceWhite Paper: Enabling the Mobile Workforce
White Paper: Enabling the Mobile WorkforceRogers Communications
 
Tech Tips for Small Business - Travel
Tech Tips for Small Business - TravelTech Tips for Small Business - Travel
Tech Tips for Small Business - TravelRogers Communications
 
Rogers 2011- Rapport annuel sur la responsabilité sociale d'entreprise
Rogers 2011- Rapport annuel sur la responsabilité sociale d'entrepriseRogers 2011- Rapport annuel sur la responsabilité sociale d'entreprise
Rogers 2011- Rapport annuel sur la responsabilité sociale d'entrepriseRogers Communications
 
Rogers 2011 Corporate Social Responsibility Report
Rogers 2011 Corporate Social Responsibility ReportRogers 2011 Corporate Social Responsibility Report
Rogers 2011 Corporate Social Responsibility ReportRogers Communications
 
Case Study: The Weather Network (FR)
Case Study: The Weather Network (FR)Case Study: The Weather Network (FR)
Case Study: The Weather Network (FR)Rogers Communications
 

More from Rogers Communications (20)

Rogers - Canadian Business Leaders Survey 2015
Rogers - Canadian Business Leaders Survey 2015Rogers - Canadian Business Leaders Survey 2015
Rogers - Canadian Business Leaders Survey 2015
 
Rogers 2013 transparency report
Rogers 2013 transparency reportRogers 2013 transparency report
Rogers 2013 transparency report
 
Rogers Innovation Report: Tech Trends 2013
Rogers Innovation Report: Tech Trends 2013Rogers Innovation Report: Tech Trends 2013
Rogers Innovation Report: Tech Trends 2013
 
Rogers Connected Workplace report 2013
Rogers Connected Workplace report 2013Rogers Connected Workplace report 2013
Rogers Connected Workplace report 2013
 
Data roaming: The mobile habits of Canadians travelling in the U.S.
Data roaming: The mobile habits of Canadians travelling in the U.S.Data roaming: The mobile habits of Canadians travelling in the U.S.
Data roaming: The mobile habits of Canadians travelling in the U.S.
 
Rogers Innovation Report: 2012 trend watch
Rogers Innovation Report: 2012 trend watchRogers Innovation Report: 2012 trend watch
Rogers Innovation Report: 2012 trend watch
 
White Paper: Enabling the Mobile Workforce
White Paper: Enabling the Mobile WorkforceWhite Paper: Enabling the Mobile Workforce
White Paper: Enabling the Mobile Workforce
 
White Paper: Mobile Security
White Paper: Mobile SecurityWhite Paper: Mobile Security
White Paper: Mobile Security
 
Tech Tips for Small Business - Travel
Tech Tips for Small Business - TravelTech Tips for Small Business - Travel
Tech Tips for Small Business - Travel
 
Tech Tips: M2N - what is it?
Tech Tips: M2N - what is it?Tech Tips: M2N - what is it?
Tech Tips: M2N - what is it?
 
Tech Tips: Blackberry
Tech Tips: BlackberryTech Tips: Blackberry
Tech Tips: Blackberry
 
Rogers 2011- Rapport annuel sur la responsabilité sociale d'entreprise
Rogers 2011- Rapport annuel sur la responsabilité sociale d'entrepriseRogers 2011- Rapport annuel sur la responsabilité sociale d'entreprise
Rogers 2011- Rapport annuel sur la responsabilité sociale d'entreprise
 
Rogers 2011 Corporate Social Responsibility Report
Rogers 2011 Corporate Social Responsibility ReportRogers 2011 Corporate Social Responsibility Report
Rogers 2011 Corporate Social Responsibility Report
 
Rogers solutions fleet diagnostics
Rogers solutions fleet diagnosticsRogers solutions fleet diagnostics
Rogers solutions fleet diagnostics
 
Rogers Ecosystem - Transportation
Rogers Ecosystem - TransportationRogers Ecosystem - Transportation
Rogers Ecosystem - Transportation
 
Rogers Solutions - Digital Signage
Rogers Solutions - Digital SignageRogers Solutions - Digital Signage
Rogers Solutions - Digital Signage
 
FLEET OPTIMIZATION HANDBOOK
FLEET OPTIMIZATION HANDBOOKFLEET OPTIMIZATION HANDBOOK
FLEET OPTIMIZATION HANDBOOK
 
Rogers Ecosystem Healthcare
Rogers Ecosystem HealthcareRogers Ecosystem Healthcare
Rogers Ecosystem Healthcare
 
Rogers eBook Security
Rogers eBook SecurityRogers eBook Security
Rogers eBook Security
 
Case Study: The Weather Network (FR)
Case Study: The Weather Network (FR)Case Study: The Weather Network (FR)
Case Study: The Weather Network (FR)
 

Recently uploaded

Presentation on how to chat with PDF using ChatGPT code interpreter
Presentation on how to chat with PDF using ChatGPT code interpreterPresentation on how to chat with PDF using ChatGPT code interpreter
Presentation on how to chat with PDF using ChatGPT code interpreternaman860154
 
FULL ENJOY 🔝 8264348440 🔝 Call Girls in Diplomatic Enclave | Delhi
FULL ENJOY 🔝 8264348440 🔝 Call Girls in Diplomatic Enclave | DelhiFULL ENJOY 🔝 8264348440 🔝 Call Girls in Diplomatic Enclave | Delhi
FULL ENJOY 🔝 8264348440 🔝 Call Girls in Diplomatic Enclave | Delhisoniya singh
 
Pigging Solutions in Pet Food Manufacturing
Pigging Solutions in Pet Food ManufacturingPigging Solutions in Pet Food Manufacturing
Pigging Solutions in Pet Food ManufacturingPigging Solutions
 
Understanding the Laravel MVC Architecture
Understanding the Laravel MVC ArchitectureUnderstanding the Laravel MVC Architecture
Understanding the Laravel MVC ArchitecturePixlogix Infotech
 
Unleash Your Potential - Namagunga Girls Coding Club
Unleash Your Potential - Namagunga Girls Coding ClubUnleash Your Potential - Namagunga Girls Coding Club
Unleash Your Potential - Namagunga Girls Coding ClubKalema Edgar
 
Enhancing Worker Digital Experience: A Hands-on Workshop for Partners
Enhancing Worker Digital Experience: A Hands-on Workshop for PartnersEnhancing Worker Digital Experience: A Hands-on Workshop for Partners
Enhancing Worker Digital Experience: A Hands-on Workshop for PartnersThousandEyes
 
Human Factors of XR: Using Human Factors to Design XR Systems
Human Factors of XR: Using Human Factors to Design XR SystemsHuman Factors of XR: Using Human Factors to Design XR Systems
Human Factors of XR: Using Human Factors to Design XR SystemsMark Billinghurst
 
Unblocking The Main Thread Solving ANRs and Frozen Frames
Unblocking The Main Thread Solving ANRs and Frozen FramesUnblocking The Main Thread Solving ANRs and Frozen Frames
Unblocking The Main Thread Solving ANRs and Frozen FramesSinan KOZAK
 
APIForce Zurich 5 April Automation LPDG
APIForce Zurich 5 April  Automation LPDGAPIForce Zurich 5 April  Automation LPDG
APIForce Zurich 5 April Automation LPDGMarianaLemus7
 
Maximizing Board Effectiveness 2024 Webinar.pptx
Maximizing Board Effectiveness 2024 Webinar.pptxMaximizing Board Effectiveness 2024 Webinar.pptx
Maximizing Board Effectiveness 2024 Webinar.pptxOnBoard
 
Install Stable Diffusion in windows machine
Install Stable Diffusion in windows machineInstall Stable Diffusion in windows machine
Install Stable Diffusion in windows machinePadma Pradeep
 
SIEMENS: RAPUNZEL – A Tale About Knowledge Graph
SIEMENS: RAPUNZEL – A Tale About Knowledge GraphSIEMENS: RAPUNZEL – A Tale About Knowledge Graph
SIEMENS: RAPUNZEL – A Tale About Knowledge GraphNeo4j
 
Kotlin Multiplatform & Compose Multiplatform - Starter kit for pragmatics
Kotlin Multiplatform & Compose Multiplatform - Starter kit for pragmaticsKotlin Multiplatform & Compose Multiplatform - Starter kit for pragmatics
Kotlin Multiplatform & Compose Multiplatform - Starter kit for pragmaticscarlostorres15106
 
Scanning the Internet for External Cloud Exposures via SSL Certs
Scanning the Internet for External Cloud Exposures via SSL CertsScanning the Internet for External Cloud Exposures via SSL Certs
Scanning the Internet for External Cloud Exposures via SSL CertsRizwan Syed
 
Injustice - Developers Among Us (SciFiDevCon 2024)
Injustice - Developers Among Us (SciFiDevCon 2024)Injustice - Developers Among Us (SciFiDevCon 2024)
Injustice - Developers Among Us (SciFiDevCon 2024)Allon Mureinik
 
Beyond Boundaries: Leveraging No-Code Solutions for Industry Innovation
Beyond Boundaries: Leveraging No-Code Solutions for Industry InnovationBeyond Boundaries: Leveraging No-Code Solutions for Industry Innovation
Beyond Boundaries: Leveraging No-Code Solutions for Industry InnovationSafe Software
 
Tech-Forward - Achieving Business Readiness For Copilot in Microsoft 365
Tech-Forward - Achieving Business Readiness For Copilot in Microsoft 365Tech-Forward - Achieving Business Readiness For Copilot in Microsoft 365
Tech-Forward - Achieving Business Readiness For Copilot in Microsoft 3652toLead Limited
 
Unlocking the Potential of the Cloud for IBM Power Systems
Unlocking the Potential of the Cloud for IBM Power SystemsUnlocking the Potential of the Cloud for IBM Power Systems
Unlocking the Potential of the Cloud for IBM Power SystemsPrecisely
 
AI as an Interface for Commercial Buildings
AI as an Interface for Commercial BuildingsAI as an Interface for Commercial Buildings
AI as an Interface for Commercial BuildingsMemoori
 

Recently uploaded (20)

Presentation on how to chat with PDF using ChatGPT code interpreter
Presentation on how to chat with PDF using ChatGPT code interpreterPresentation on how to chat with PDF using ChatGPT code interpreter
Presentation on how to chat with PDF using ChatGPT code interpreter
 
FULL ENJOY 🔝 8264348440 🔝 Call Girls in Diplomatic Enclave | Delhi
FULL ENJOY 🔝 8264348440 🔝 Call Girls in Diplomatic Enclave | DelhiFULL ENJOY 🔝 8264348440 🔝 Call Girls in Diplomatic Enclave | Delhi
FULL ENJOY 🔝 8264348440 🔝 Call Girls in Diplomatic Enclave | Delhi
 
Pigging Solutions in Pet Food Manufacturing
Pigging Solutions in Pet Food ManufacturingPigging Solutions in Pet Food Manufacturing
Pigging Solutions in Pet Food Manufacturing
 
Understanding the Laravel MVC Architecture
Understanding the Laravel MVC ArchitectureUnderstanding the Laravel MVC Architecture
Understanding the Laravel MVC Architecture
 
Unleash Your Potential - Namagunga Girls Coding Club
Unleash Your Potential - Namagunga Girls Coding ClubUnleash Your Potential - Namagunga Girls Coding Club
Unleash Your Potential - Namagunga Girls Coding Club
 
E-Vehicle_Hacking_by_Parul Sharma_null_owasp.pptx
E-Vehicle_Hacking_by_Parul Sharma_null_owasp.pptxE-Vehicle_Hacking_by_Parul Sharma_null_owasp.pptx
E-Vehicle_Hacking_by_Parul Sharma_null_owasp.pptx
 
Enhancing Worker Digital Experience: A Hands-on Workshop for Partners
Enhancing Worker Digital Experience: A Hands-on Workshop for PartnersEnhancing Worker Digital Experience: A Hands-on Workshop for Partners
Enhancing Worker Digital Experience: A Hands-on Workshop for Partners
 
Human Factors of XR: Using Human Factors to Design XR Systems
Human Factors of XR: Using Human Factors to Design XR SystemsHuman Factors of XR: Using Human Factors to Design XR Systems
Human Factors of XR: Using Human Factors to Design XR Systems
 
Unblocking The Main Thread Solving ANRs and Frozen Frames
Unblocking The Main Thread Solving ANRs and Frozen FramesUnblocking The Main Thread Solving ANRs and Frozen Frames
Unblocking The Main Thread Solving ANRs and Frozen Frames
 
APIForce Zurich 5 April Automation LPDG
APIForce Zurich 5 April  Automation LPDGAPIForce Zurich 5 April  Automation LPDG
APIForce Zurich 5 April Automation LPDG
 
Maximizing Board Effectiveness 2024 Webinar.pptx
Maximizing Board Effectiveness 2024 Webinar.pptxMaximizing Board Effectiveness 2024 Webinar.pptx
Maximizing Board Effectiveness 2024 Webinar.pptx
 
Install Stable Diffusion in windows machine
Install Stable Diffusion in windows machineInstall Stable Diffusion in windows machine
Install Stable Diffusion in windows machine
 
SIEMENS: RAPUNZEL – A Tale About Knowledge Graph
SIEMENS: RAPUNZEL – A Tale About Knowledge GraphSIEMENS: RAPUNZEL – A Tale About Knowledge Graph
SIEMENS: RAPUNZEL – A Tale About Knowledge Graph
 
Kotlin Multiplatform & Compose Multiplatform - Starter kit for pragmatics
Kotlin Multiplatform & Compose Multiplatform - Starter kit for pragmaticsKotlin Multiplatform & Compose Multiplatform - Starter kit for pragmatics
Kotlin Multiplatform & Compose Multiplatform - Starter kit for pragmatics
 
Scanning the Internet for External Cloud Exposures via SSL Certs
Scanning the Internet for External Cloud Exposures via SSL CertsScanning the Internet for External Cloud Exposures via SSL Certs
Scanning the Internet for External Cloud Exposures via SSL Certs
 
Injustice - Developers Among Us (SciFiDevCon 2024)
Injustice - Developers Among Us (SciFiDevCon 2024)Injustice - Developers Among Us (SciFiDevCon 2024)
Injustice - Developers Among Us (SciFiDevCon 2024)
 
Beyond Boundaries: Leveraging No-Code Solutions for Industry Innovation
Beyond Boundaries: Leveraging No-Code Solutions for Industry InnovationBeyond Boundaries: Leveraging No-Code Solutions for Industry Innovation
Beyond Boundaries: Leveraging No-Code Solutions for Industry Innovation
 
Tech-Forward - Achieving Business Readiness For Copilot in Microsoft 365
Tech-Forward - Achieving Business Readiness For Copilot in Microsoft 365Tech-Forward - Achieving Business Readiness For Copilot in Microsoft 365
Tech-Forward - Achieving Business Readiness For Copilot in Microsoft 365
 
Unlocking the Potential of the Cloud for IBM Power Systems
Unlocking the Potential of the Cloud for IBM Power SystemsUnlocking the Potential of the Cloud for IBM Power Systems
Unlocking the Potential of the Cloud for IBM Power Systems
 
AI as an Interface for Commercial Buildings
AI as an Interface for Commercial BuildingsAI as an Interface for Commercial Buildings
AI as an Interface for Commercial Buildings
 

Rogers Innovation Report tackles Canadian video viewing habits

  • 1. © 2013 Rogers Communications ROGERS INNOVATION REPORT: TV VIEWING HABITS Quantitative Research Highlights May 2013
  • 2. © 2013 Rogers Communications ROGERS INNOVATION REPORT: RESEARCH METHOD • A national survey of n=1,000 respondents was conducted by Head Research among adult Canadians, along with an additional n=275 interviews to augment the sample size of particular regions. – Respondents were sourced from available non-probability based panels. The national sample size of N=1,275 provides a statistical margin of error of +/- 2.7%, 19 times out of 20, assuming that panelists do not differ from non-panelists and respondents do not differ from non-respondents. Analyses of sub-groups are subject to a larger margin of error due to the smaller size of such groups. – The national-level data in this report has been weighted to match the national population profile, therefore reducing the influence of regions with additional interviews back to their non-augmented proportions. – Fieldwork was conducted between April 3 and April 8, 2013. – Numbers shown in the report may not sum to 100% due to rounding to the nearest whole number, or where multiple responses were allowed. These instances are noted on relevant charts.
  • 3. © 2013 Rogers Communications 56 69 12 18 22 16 21 31 22 15 67 51 0 20 40 60 80 100 Up to 2 hours 3 to 4 hours 5 hours or more Think back over the last year and try to recall when you spent the most amount of time watching programs, movies and events from any source. Please tell us the number of hours you recall spending on each of the items below. Average hours 5.6 6.8 2.4 3.1 Q130a/b. Total, excluding Don't knows; bases Q130a n=1022, Q130b n= 1032; effective sample sizes Q130a n=813, Q130b n=821 (80%) Q130c/d. All On-Demand viewers, excluding Don’t knows; Weight: Population; Q130c base n= 559, Q130d base n=562; effective sample sizes Q130c n=445, Q130d n=447 (80%) The greatest number of hours you have spent watching… …programs, movies or events in one day during the week ...programs, movies or events in one day during the weekend ...On-demand content in one day during the week ...On-demand content in one day during the weekend (%) TV MARATHONS: TOTAL HOURS VIEWED THE AVERAGE CANADIAN’S LONGEST VIEWING MARATHON LASTED 5.6 HOURS ON A WEEK DAY AND ALMOST 7 HOURS DURING THE WEEKEND • Two-thirds of Canadians (67%) have had a viewing marathon that has lasted 5 hours or more during the weekend and half (51%) have watched the same amount on a week day. • Growing in momentum, the average On-Demand viewing marathon is less than half the length of the average viewing marathon from other sources, with marathon viewing more predominant on weekends than weekdays. • Households with children have had significantly shorter weekday viewing marathons than households without (4.9 hours on average vs. 6.0 hours). Males have had significantly longer weekend viewing marathons than females (7.2 hours on average vs. 6.3 hours).
  • 4. © 2013 Rogers Communications 68 84 36 47 25 11 27 30 7 5 37 24 0 20 40 60 80 100 Up to 2 episodes/movies 3 to 4 episodes/movies 5 episodes/movies or more Some people like to watch several episodes of a program or movies back-to-back, or in a concentrated period of time. So, still regarding the past year, please now think about the total number of episodes of a program, or total number of movies you recall watching back-to-back, one after the other, from any source. Please enter the numbers below. Average # 4.0 4.6 1.7 2.2 …episodes of a program that you've watched back- to-back, one after the other during the week ... episodes of a program that you've watched back-to-back, one after the other during the weekend ...movies that you've watched back-to-back, one after the other during the week ...movies that you've watched back-to-back, one after the other during the weekend TV MARATHONS: TOTAL EPISODES/MOVIES VIEWED BACK-TO- BACK THE AVERAGE CANADIAN HAS WATCHED 4 EPISODES OF A PROGRAM BACK-TO-BACK ON A WEEKDAY • Viewing sessions during the weekend are longer: an average of 4.6 episodes on the weekend vs. 4.0 episodes on a weekday. • Over a third of Canadians (37%) have watched 5 or more episodes in a row on the weekend. • Almost a third (32%) of Canadians have watched 3 or more movies in a row on the weekend (a combination of 25% who have watched 3 to 4 movies and 7% who have watched 5 or more movies). • Overall, 81% of Canadians have watched 3 or more episodes back-to-back or 2 or more movies back-to-back at some point in the past year. Q135a-d. Total, excluding Don't knows, Weight: Population; bases range from 1004 to 1034; effective bases range from 798 to 828 (79%); Numbers may not sum to 100% due to rounding The greatest number of hours you have spent watching… (%)
  • 5. © 2013 Rogers Communications TV MARATHONS: TOTAL EPISODES/MOVIES VIEWED BACK-TO- BACK BY AGE CANADIANS 34 OR UNDER HAVE HAD SIGNIFICANTLY LONGER TV MARATHONS THAN THOSE OVER 34 • Canadians aged 35 to 54 have significantly longer weekend marathons than those aged 55 or over. 5.4 3.5 3.3 6.6 4.2 3.2 2.1 1.6 1.4 2.6 2.2 1.8 0 1 2 3 4 5 6 7 34 or under 35 to 54 55 or over Averagenumberofepisodes/moviesviewedback-to-back Episodes back-to-back during the week Episodes back-to-back during the weekend Movies back-to-back during the week Movies back-to-back during the weekend Some people like to watch several episodes of a program or movies back-to-back, or in a concentrated period of time. So, still regarding the past year, please now think about the total number of episodes of a program, or total number of movies you recall watching back-to-back, one after the other, from any source. Please enter the numbers below. All All All All Significantly higher than named group at 95% confidence 55 or over 55 or over Q135a-d. Total, excluding Don't knows, Weight: Population; bases range from 290 to 409; effective bases range from 213 to 330 (79%)
  • 6. © 2013 Rogers Communications • An On-Demand Marathon Viewer has watched one of the following amounts of On-Demand content on their television in the past year: • 3 or more episodes of a program back-to-back on a weekday • 3 or more episodes of a program back-to- back during the weekend • 3 or more episodes of a program over an entire weekend • More than 2 movies back-to-back on a weekday • More than 2 movies back-to-back during the weekend • More than 2 movies over an entire weekend On- Demand Marathon Viewers 57% 43% ON-DEMAND MARATHON VIEWERS: DEFINITION MORE THAN 4 OUT OF 10 ON-DEMAND VIEW CONTENT IN MARATHON SESSIONS Q137. Now think about the maximum amount of time you have spent watching programs or movies using On-Demand services over the past year on your television. Please enter the numbers in the boxes below.Constructed variable from Q137a-f. All On-Demand Viewers with a television, excluding Don't knows answering at least one of Q137a-f. Weight: Population; base n = 567; effective sample sizes = 456 (80%)
  • 7. © 2013 Rogers Communications 1 4 7 22 27 29 32 36 37 43 47 54 Why do you watch many episodes of a program or movies in a short space of time? Quebecois significantly less likely to say this: 13% vs. 30% elsewhere Significant Differences By Age 34 or Under Over 34 57 41 56 36 53 28 (%) Significantly higher than other group at 95% confidence. TV MARATHONS: REASONS FOR WATCHING MULTIPLE EPISODES OR MOVIES THE REASONS FOR WATCHING MULTIPLE ITEMS GIVE A CLEAR PICTURE OF ENGAGEMENT AND ENJOYMENT • The most popular reason why the majority of Canadians who watch multiple episodes or movies one after another is for personal enjoyment (54%), followed by almost half (47%) who like to ‘watch as much of it as (they) can’. • Canadians 34 or under are significantly more likely than those over 34 to say they watch multiple episodes or movies because of wanting to ‘watch as much of it as (they) can,’ being able to ‘really get in to the storyline’ and/or not wanting to ‘wait to find out what happens next.’ I just really enjoy watching them When I find a program I like I just want to watch as much of it as I can I can really get in to the storyline I don't want to wait to find out what happens next It means I have less interruption from advertisements I want to catch up on episodes so I am at the same point as friends/family/colleagues I don't normally have time to watch much so when I get time I like to make up for it I prefer to watch something I know I like rather than try and find something new They start automatically and it's easy to just let them run It is an excuse to get together with friends/family/colleagues Something else None of the above Q140. All watching in one go more than: two episodes or two movies in one day or four episodes or three movies at the weekend; Weight: Population; base n = 645; effective sample size = 513 (79%). Multiple responses were allowed.
  • 8. © 2013 Rogers Communications 17 22 23 16 9 6 3 1 2 - 5 10 15 20 25 < 7hrs p.w. <1 hr p.d on average8-14 hrs p.w. >1 <2 hrs p.d on average15-24 hrs p.w. >2 <3 hrs p.d on average25-32 hrs p.w. >3 <4 hrs p.d on average33-40 hrs p.w. >4 <5 hrs p.d on average41-48 hrs p.w. >5 <6 hrs p.d on average 49-56 hrs p.w. >6 <7 hrs p.d on average 57-64 hrs p.w. >7 <8 hrs p.d on average >64 hrs p.w. >8 hrs p.d on average Q110. Total sample, excluding ‘don’t know’; Weight: Population; base n = 1272; effective sample size = 1017 (80%) In total, approximately how much time do you spend watching programs, movies and events in an average week, from Monday to Sunday, regardless of device used? Average hours 22 % > 24 hours 38 % > 32 hours 22 % > 40 hours 12 Numbers may not sum to 100% due to rounding (%) TV MARATHONS: TOTAL HOURS VIEWED THE AVERAGE CANADIAN WATCHES 22 HOURS OF CONTENT IN A NORMAL WEEK - JUST OVER 3 HOURS A DAY • Just over 1 out of 10 Canadians (12%) watches more than 40 hours of content in a normal week. • Canadians 55 years or older watch significantly more hours of content than those under 55 (25.7 hours on average vs. 20.5 hours). • British Columbians watch significantly more content than other Canadians (25.2 hours on average vs. 21.5 hours).
  • 9. © 2013 Rogers Communications Q291.All who personally watch a television but have other devices available; Weight: Population; base n = 1110; effective sample size = 871 (78%). Q293. All using a smartphone, phablet, tablet, laptop or desktop computer while watching television; Weight: Population; base n = 774; effective sample size = 605 (78%) . Multiple responses were allowed. Device % used by you Laptop computer 41 Smartphone/phablet 33 Desktop computer 22 Tablet 15 ONE OF THE ABOVE FOUR 70 A media player (e.g. iPod touch, Galaxy player etc.) 9 Monitor, not part of a desktop computer 3 Video projector 1 Another device with a screen 2 None of the above 29 64 59 46 45 36 21 18 15 13 13 12 6 5 5 7 General internet browsing Reading or sending emails Playing games Checking social media Reading or sending text messages. Working or studying Writing status… Instant Messaging (e.g.… Posting photos to social media Listening to music/radio Watching short videos (e.g. YouTube) Watching another program or movie Making video calls Other (specify) None of the above Which, if any, of the following things are you personally doing with a smartphone, tablet or computer while watching programs, movies or events on another device in the same room? When you are watching programs, movies or events on the television, which, if any, of the following devices are often being used at the same time, in the same room, by you or by other household members? (%) MULTI-SCREEN TASKING: WHEN WATCHING TELEVISION SEVEN OUT OF 10 CANADIANS WITH THE DEVICES AVAILABLE OFTEN USE A SMARTPHONE, TABLET OR COMPUTER WHILE WATCHING TELEVISION • General internet browsing is the most popular activity on a second screen (64%), followed by checking emails (59%), playing games (46%) and checking social media (45%)
  • 10. © 2013 Rogers Communications 36 20 17 15 14 14 3 46 Q294. Total sample; Weight: Population; base n = 1282; effective sample size = 1015 (79%). Multiple responses were allowed. In the past three months which, if any, of the following have you personally done while watching programs, movies or events on any device? Looked up information online about the program, movie or event you were watching or the actors in it Read comments/updates/tweets on social media about the program, movie or event you were watching Sent a text message to someone about the program, movie or event you were watching Checked the program, movie or event site or social media page/feed Made a status update/comment/tweet on social media about the program, movie or event you were watching Received a text message from someone about the program, movie or event you were watching Tweeted the actors/presenters of the program, movie or event you were watching None of the above (%) MULTI-SCREEN TASKING: RELATED TO CONTENT BEING VIEWED OVER A THIRD (36%) OF CANADIANS HAVE LOOKED UP INFORMATION ONLINE ABOUT THE SHOW THEY WERE WATCHING AT THE TIME • One out of 5 (20%) have monitored social media activity about the content that they were watching, and 1 in 7 (14%) have updated social media or have made a comment about the content they were watching.
  • 11. © 2013 Rogers Communications 10 5 14 31 38 58 71 75 27 90 96 8 4 10 23 27 42 57 60 23 84 90 Another device with a screen Video projector Monitor, not part of desktop computer Tablet Media player Smartphone/Phablet Desktop computer Laptop computer Internet-enabled television Television, not internet-enabled Television, Any (NET) % Using device personally % With device available in household Q100. Total sample; Weight: Population; base n = 1282; effective sample size = 1029 (80%) . Multiple responses were allowed. Average # used personally Average # in household 1.6 2.2 1.3 1.8 0.3 0.4 0.7 1.1 0.6 0.9 0.5 1.1 0.3 0.6 0.2 0.4 0.1 0.2 0 0.1 0.1 0.1 How many of the following devices, if any, do you, personally, use to view programs, movies and events, and how many, if any, are available in your household? (%) TV MARATHONS: DEVICES USED TO VIEW CONTENT NINE OUT OF 10 (90%) CANADIANS WATCH CONTENT ON A TELEVISION • Computers are the second most popular devices to watch content on, with 60% of Canadians viewing content on a laptop, and 57% on a desktop. Smartphones and tablets are also popular, at 42% and 23% each, respectively. • Almost 9 out of 10 (86%) Canadians watch content on a device other than a television, rising to 92% for those under 34. • Seven out of 10 (71%) Canadians watch content on a laptop, smartphone/phablet or tablet, rising to 86% for those under 34.
  • 12. © 2013 Rogers Communications 76 56 49 47 39 33 19 12 10 9 9 7 5 3 2 1 1 0 7 When eating on your own In bed When eating with others When cooking When doing household chores When exercising When on a phone call When at work When sitting on the toilet In a car/van/truck/motorcycle When on public transport/commuting When in the bath When waiting in line When at school, but not attending a class When attending a class at school During a meeting When attending a public performance When attending a religious ceremony None of the above Q320. All viewing content on smartphone , phablet or tablet; Weight: Weight; base n = 608; effective sample size = 486 (80%) . Multiple responses were allowed. Have you ever watched programs, movies and events in any of the following situations? VIEWING HABITS: SITUATIONS WHERE CONTENT IS WATCHED OVER HALF (54%) OF CANADIANS WHO VIEW CONTENT ON A SMARTPHONE, PHABLET OR TABLET HAVE VIEWED CONTENT IN BED • More than 1 out of 10 (12%) Canadians who view content on a smartphone, phablet or tablet have viewed content at work. (%)
  • 13. © 2013 Rogers Communications 80 44 36 33 26 11 8 6 3 3 2 2 2 13 Went to bed late Neglected household chores Been tired at work because you stayed up Grabbed something quick to eat instead of making a proper meal Got out of bed early Been too tired to take as much care in your appearance as normal… Rescheduled plans to meet friends or family Arrived at work late because you stayed up Not gone to planned meetings with friends or family Arrived at school late because you stayed up Called in to work "sick" Stayed away from school "sick" Skipped/stood up a date None of the above Q350. Total sample; Weight: Population; base n = 1282; effective sample size = 994 (78%). TV MARATHONS: EFFECTS ON DAILY LIFE EIGHT OUT OF 10 CANADIANS HAVE GONE TO BED LATE IN ORDER TO WATCH A PROGRAM, EVENT OR MOVIE • Many have neglected household chores (44%), been tired the next day because they stayed up late (36%), and/or grabbed something quick to eat instead of making a proper meal (33%) as a result of watching a program, movie or event. One in 10 (11%) have allowed their viewing habits to affect their appearance the next day from being too tired. • Significantly more women (51%) than men (38%) say they have neglected household chores in order to watch a program, event or movie. Which, if any, of the following have ever happened to you because you wanted to watch a program, movie or event? Significant differences by Gender Male Female Neglected household chores 38 51 Got out of bed early 30 21 Arrived at work late 8 4 (%) Significantly higher than other group at 95% confidence. Multiple responses were allowed.
  • 14. © 2013 Rogers Communications 4 3 10 12 16 17 19 20 33 34 34 37 40 52 53 62 None of the above Something else Musicals Westerns War Animation Horror Epic/historical Crime/Gangster Documentaries Sci-fi/fantasy Thrillers Adventure Drama Action Comedy Q201. Total sample; Weight: Population; base n = 1282; effective sample size = 1029 (80%) And which genres or styles of programs or movies are you most likely to spend large single amounts of time watching? By single amounts of time we mean watching several programs or movies back-to-back, one after the other, or in a prolonged, concentrated period of time % Significant differences by age Genre 34 or under 35-54 55 or over Comedy 71 62 52 Horror 28 17 10 Animation 25 17 9 Westerns 6 12 18 (%) Significantly higher/lower than other group at 95% confidence. Multiple responses were allowed. TV MARATHONS: PROGRAM OR MOVIE GENRES CANADIANS’ FAVOURITE GENRES FOR MARATHONS ARE COMEDY, ACTION AND DRAMA • Six out of 10 (62%) Canadians say they are most likely to spend large single amounts of time watching comedy, and over half (53%) watching action and/or drama (52%). • There are significant differences by age: those under 34 are more likely to say they’ll watch comedy, horror and animation, and less likely to watch Westerns.
  • 15. © 2013 Rogers Communications 30 22 33 30 17 15 49 0 20 25 32 33 19 16 52 2 25 23 32 31 18 15 51 1 I let my spouse/partner choose whatever he/she wants to watch My spouse/partner lets me choose whatever I want to watch My spouse/partner chooses something he/she thinks we'll both like I choose something I think we'll both like My spouse/partner will give me a few options to choose between I will give my spouse/partner a few options to choose between We'll decide together Other Male Female Overall Q246. All with a spouse/partner but no children who watch content at least rarely with the spouse/partner; Weight: Population; base n = 514; effective sample size = 399 (78%) . Multiple responses were allowed. 1 1 11 39 49 Never I prefer not to say Rarely Somewhat… Very frequently When you watch programs, movies or events with your spouse/partner which, if any, of the following are ways you decide what to watch? • The majority (88%) of people who live with a spouse or partner but have no children in their household watch content together. • Deciding what to watch is largely a matter of compromise: half (51%) of those watching content together decide together and almost a further third (31%) choose something they think their partner will like. • A quarter (25%) are likely to let their partner choose what to watch, and men are significantly more likely to claim they let their partner choose what to watch (30% men vs. 20% women). How often do you watch programs, movies or events together with your spouse/partner? Q245. All with a spouse/partner but no children; Weight: Population; base n = 520; effective sample size = 404 (78%) Numbers may not sum to 100% due to rounding (%) Significantly higher than named group at 95% confidence Female (%) WATCHING WITH OTHERS: WITH SPOUSE/PARTNER MEN ARE MORE LIKELY TO CLAIM THAT THEY LET THEIR PARTNER CHOOSE WHAT TO WATCH
  • 16. © 2013 Rogers Communications 4 6 3 6 10 13 15 15 30 32 35 36 37 42 53 I am unlikely to spend long, single amounts of time… Something else Religious programs Children's educational content Children's entertainment, including non-educational… Music Travel Game shows Interests/hobbies Reality TV News, reporting and analysis Sports Documentaries Sitcoms Drama Q200. Total sample; Weight: Population; base n = 1282; effective sample size = 1026 (80%) Which type or types of programs or events are you most likely to spend large single amounts of time watching? By single amounts of time we mean watching several programs or events back-to-back, one after the other or prolonged coverage of one event (e.g. news coverage of a catastrophe, golf tournaments) Significant differences by gender Male Female Sports 52 20 Documentaries 42 32 Drama 43 63 Significantly higher than other group at 95% confidence. Multiple responses were allowed. (%) TV MARATHONS: PROGRAM OR EVENT TYPES CANADIANS ARE MOST LIKELY TO SPEND LARGE AMOUNTS OF TIME WATCHING DRAMA (53%) AND SITCOMS (42%) • Documentaries, sports and news/analysis are all also popular at 37%, 36% and 35% respectively. • Sport is significantly more popular among males than females (52% vs. 20%), and drama significantly less popular among males than females (43% vs. 63%).
  • 17. © 2013 Rogers Communications 48 13161620222434 52 87848480787666 ANY TV PARTYSomething elseReality TVAn awards ceremony (e.g. Oscars, Golden Globes) A season premiere/finale Some or all of a season of a program Several movies back-to-back A sporting event on any device Not hosted or attended Hosted or attended Q300. Total sample; Weight: Population; base n = 1282; effective sample size = 1004 (78%) Over the past year, have you hosted or attended any parties/get-togethers arranged for watching any of the following types of programs, movies or events? Did both men and women attend the most recent program/movie party/get-together, or was it just for one gender? 76 13 8 3 How many people in total attended the most recent program/movie party/get-together? 37 42 16 5 Under 5 5 to 9 10 to 19 20 or more Average attendance 7.3 Q301/Q30. All hosting or attending a viewing party; Weight: Population; base n = 609; effective sample size = 491 (81%) (%) WATCHING WITH OTHERS: VIEWING PARTIES ALMOST HALF OF CANADIANS (48%) HAVE ATTENDED A VIEWING PARTY IN THE LAST YEAR • Sport is the most popular category of viewing party, with 34% having attended and/or hosted a sports-based viewing party. • The majority of viewing parties (76%) are open to men and women, and the average number of attendees is just over seven (7.3).
  • 18. © 2013 Rogers Communications Appendix
  • 19. © 2013 Rogers Communications 30 19 11 9 12 12 9 38 24 13 11 2 2 11 0 10 20 30 40 50 Ontario Quebec British Columbia Alberta New Brunswick Newfoundland and Labrador Other Region Unweigted Weighted 15 18 24 16 16 11 15 18 24 16 17 10 0 10 20 30 40 Less than $30,000 $30,000 to $49,999 $50,000 to $74,999 $75,000 to $99,999 $100,000 or more Don't know/Prefer not to answer Household Income 4 30 34 22 4 64 30 34 22 4 6 0 10 20 30 40 50 Less than high school Completed high school Partial/complete technical, college or CEGEP Partial/complete undergraduate Partial/complete professional Partial/complete master's or higher Educational attainment 46 5450 50 0 20 40 60 80 Male Female Gender 28 40 3231 40 29 0 10 20 30 40 50 60 34 or under 35-54 55 or over Age 18 30 41 11 19 30 38 13 0 10 20 30 40 50 60 Single person With children Spouse/partner, no children Other Household Status Total sample. Weighted. base n = 1282; effective sample size = 1029 (80%) Numbers may not sum to 100% due to rounding APPENDIX: DEMOGRAPHICS DATA WERE WEIGHTED TO THE NATIONAL POPULATION PROFILE