Downloaded 1,217 times

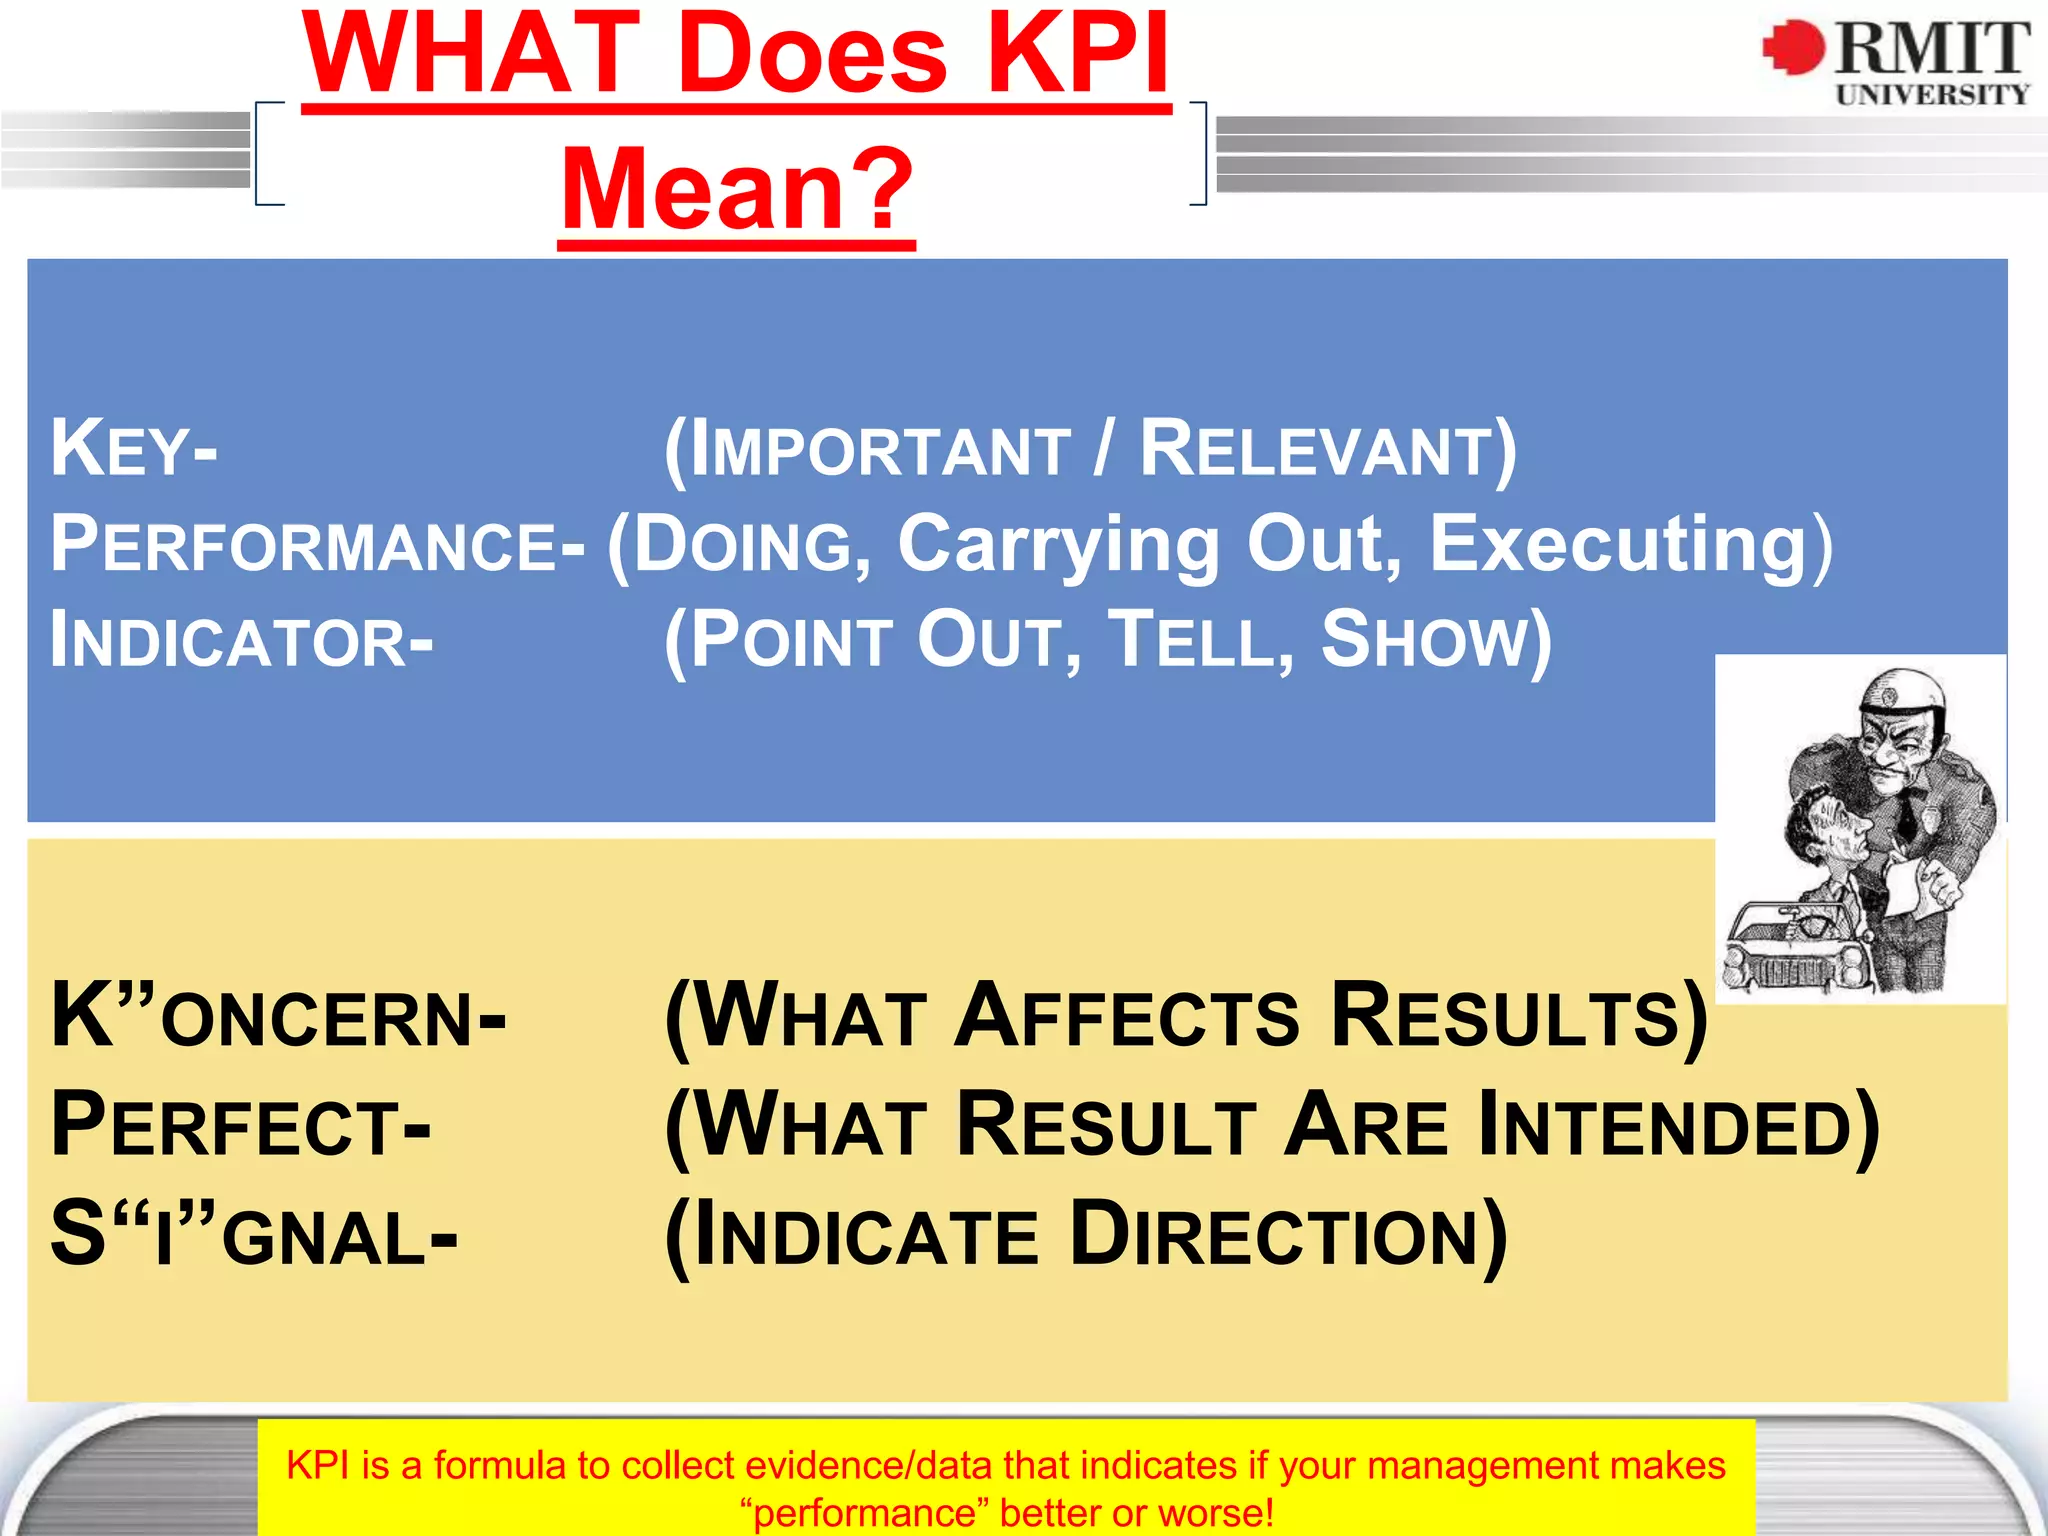
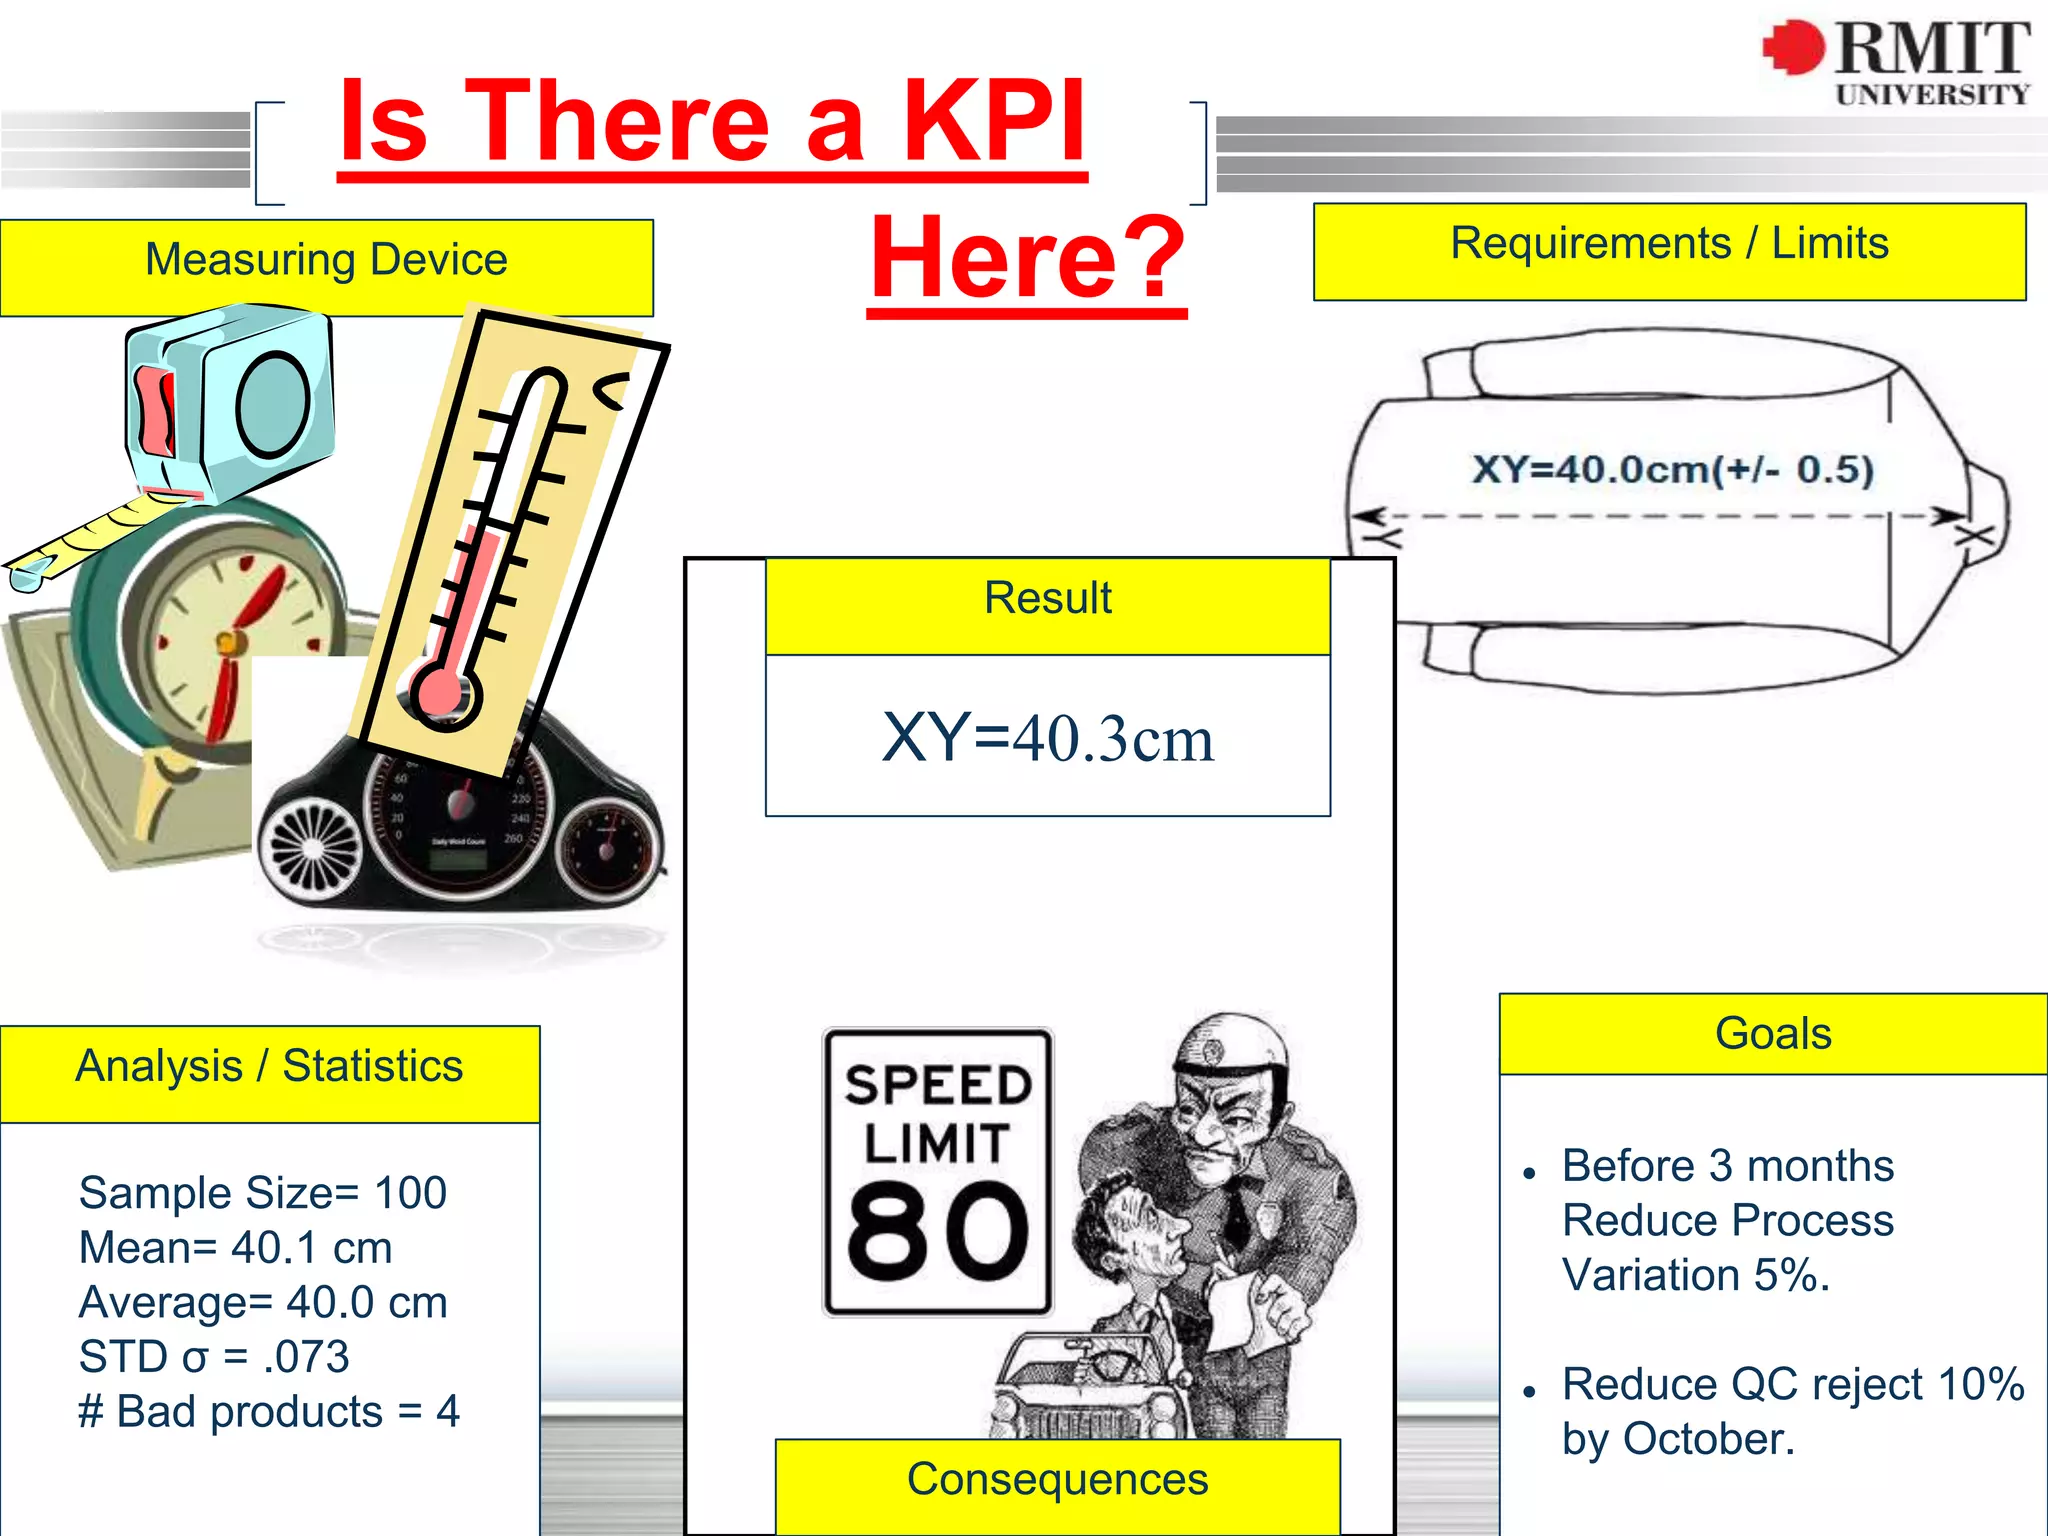
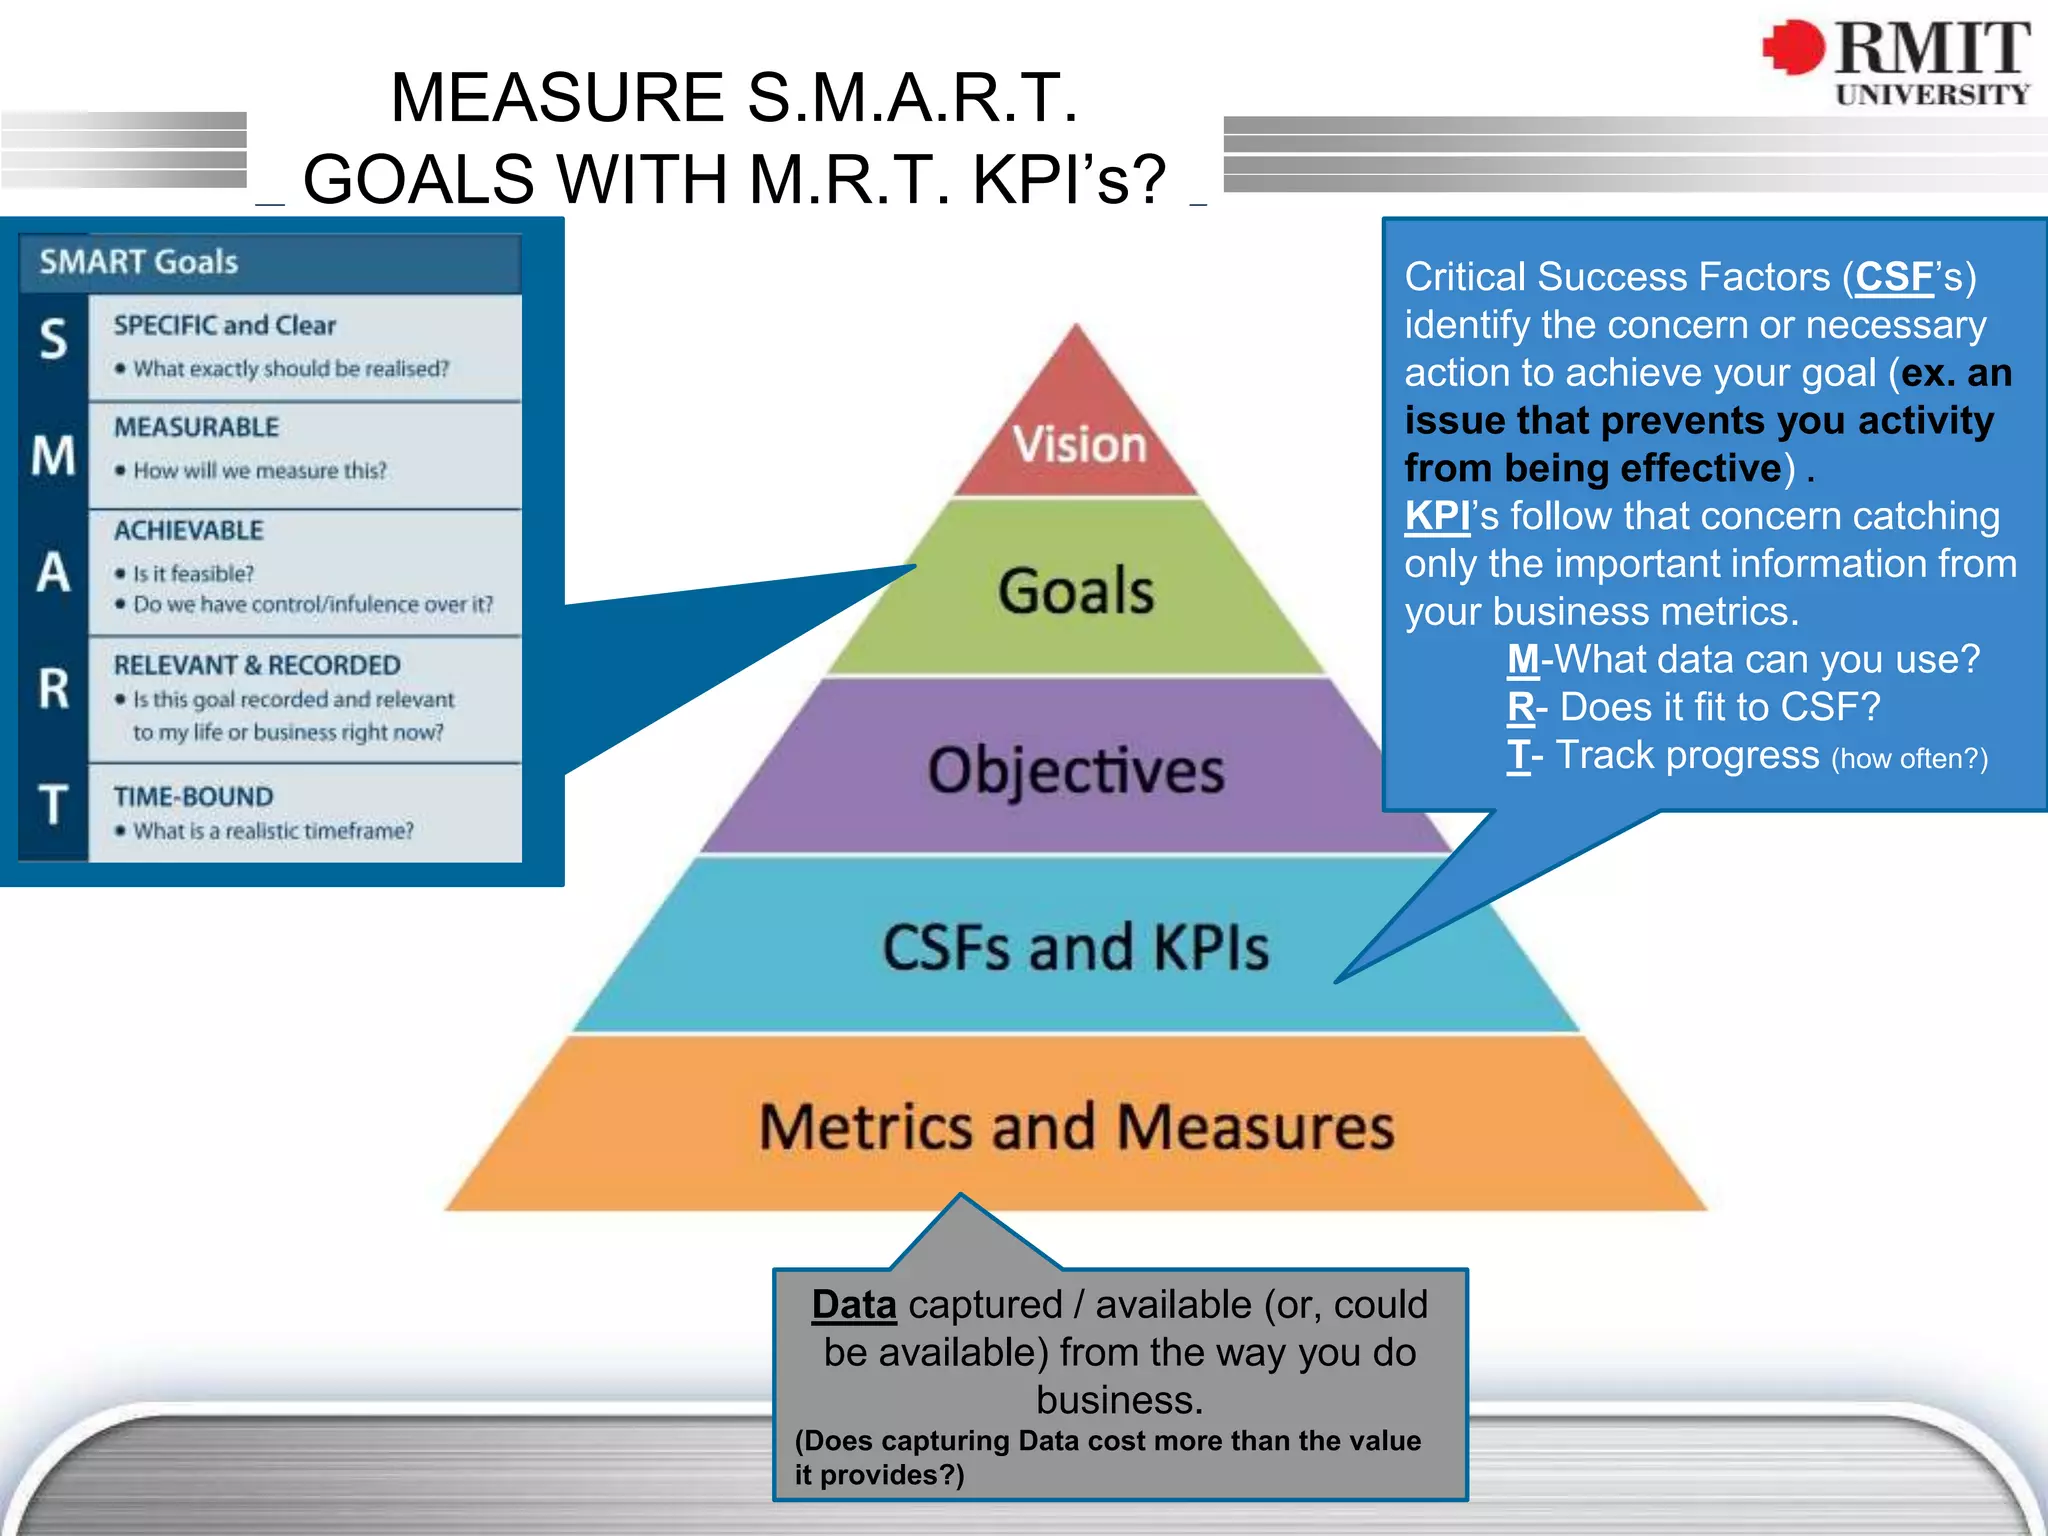


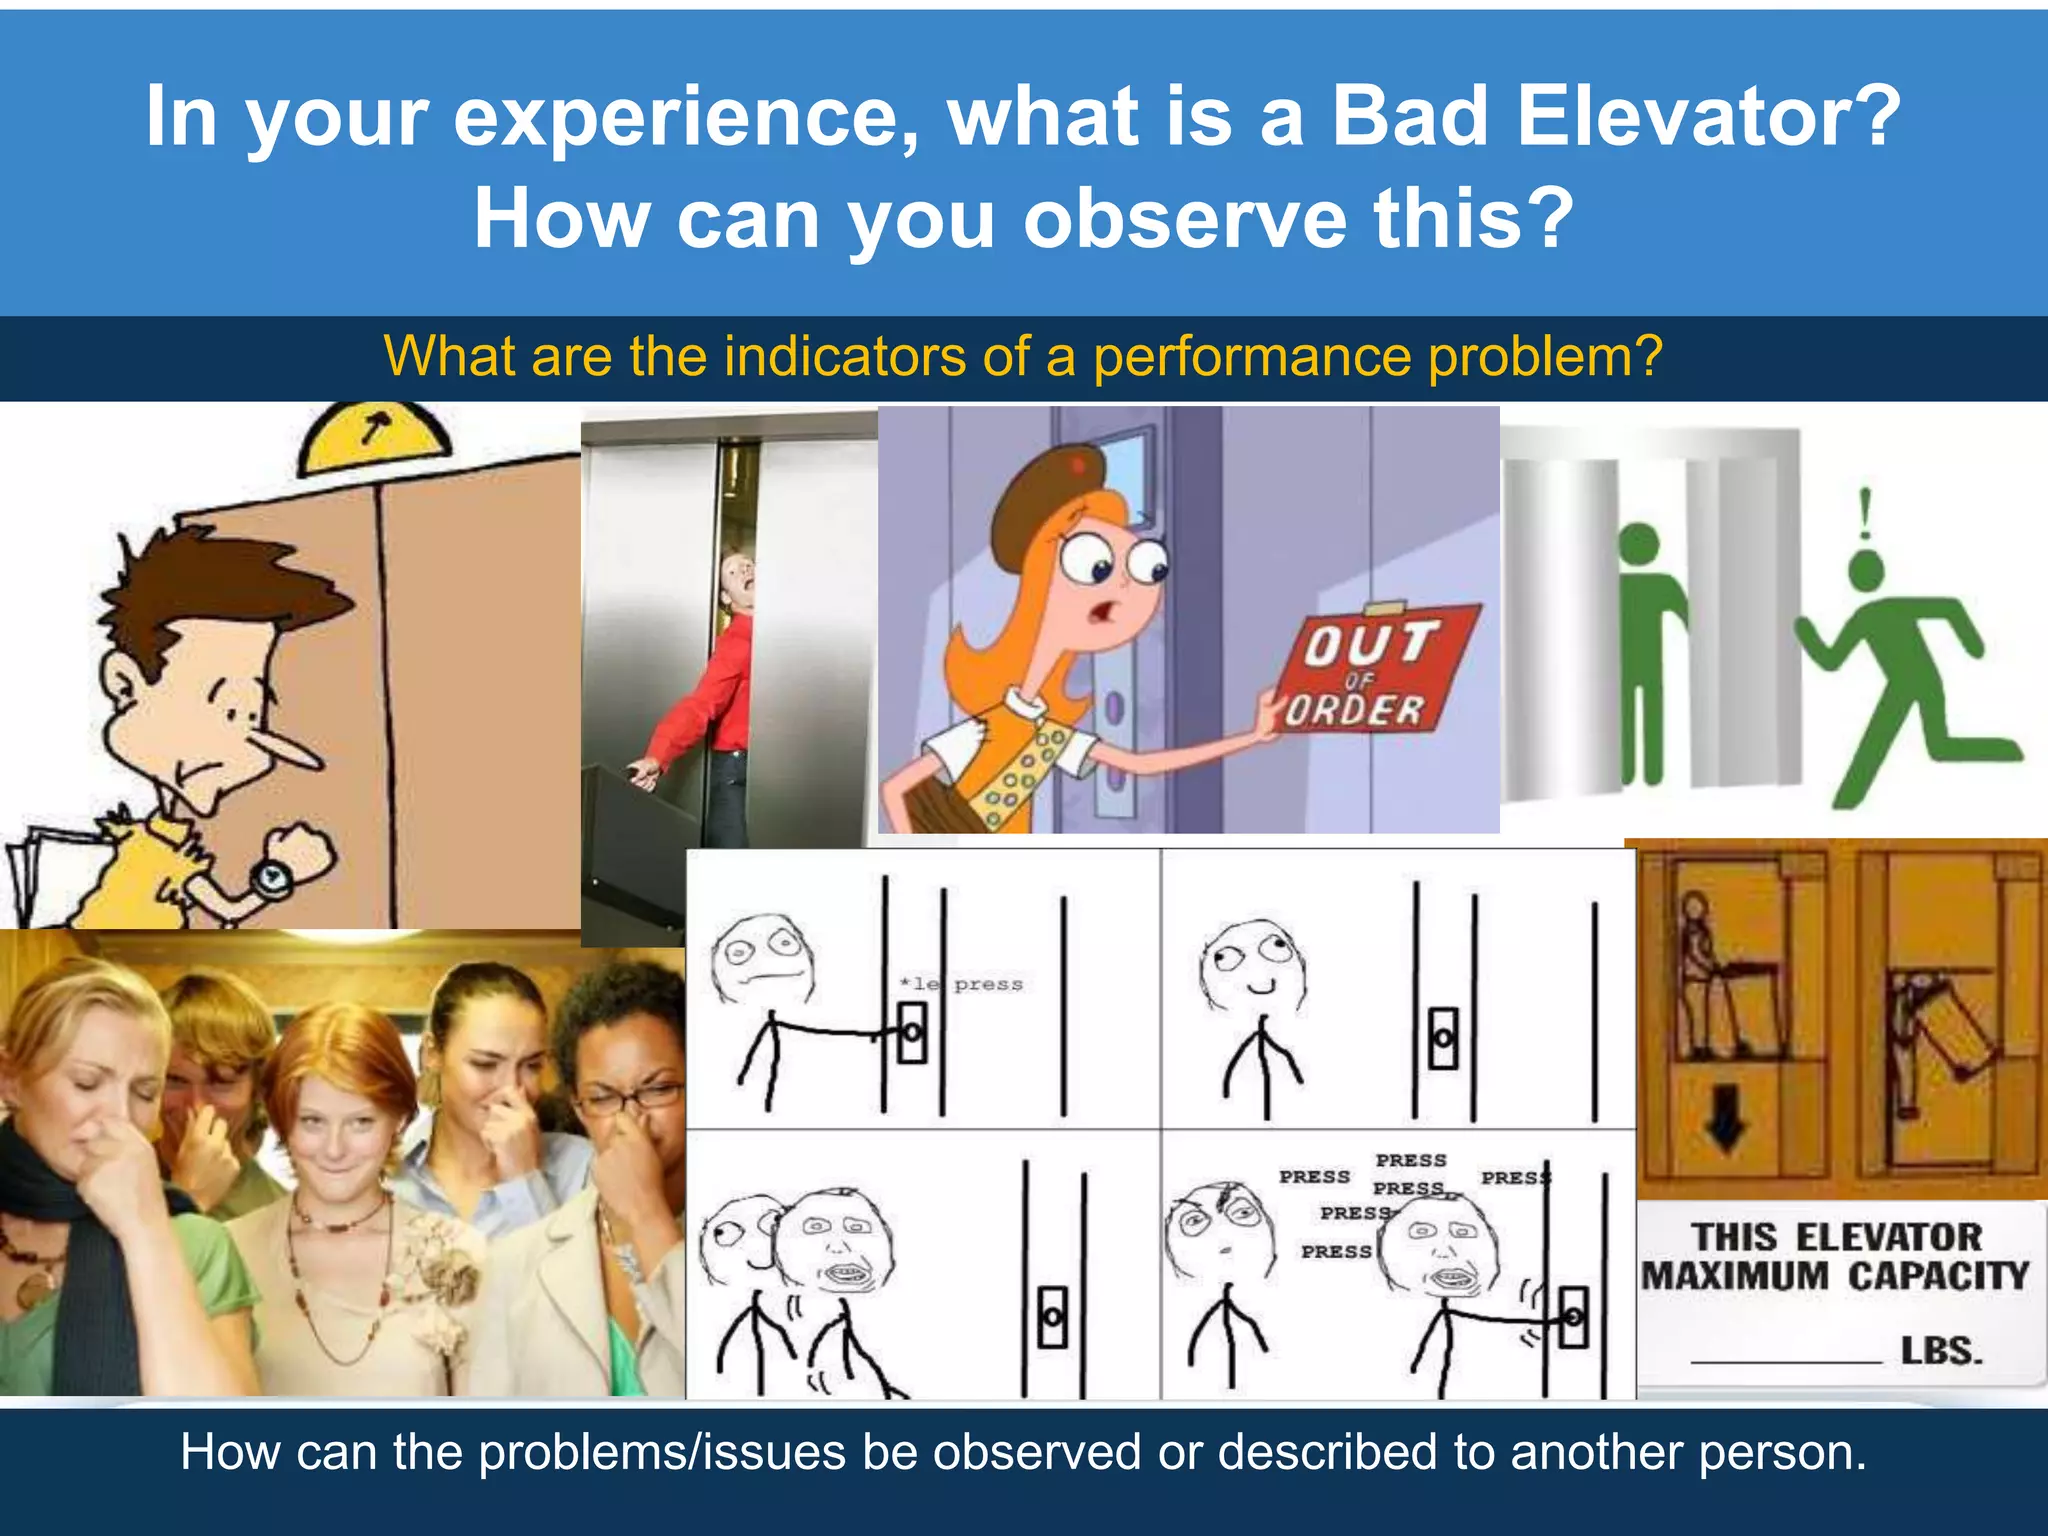
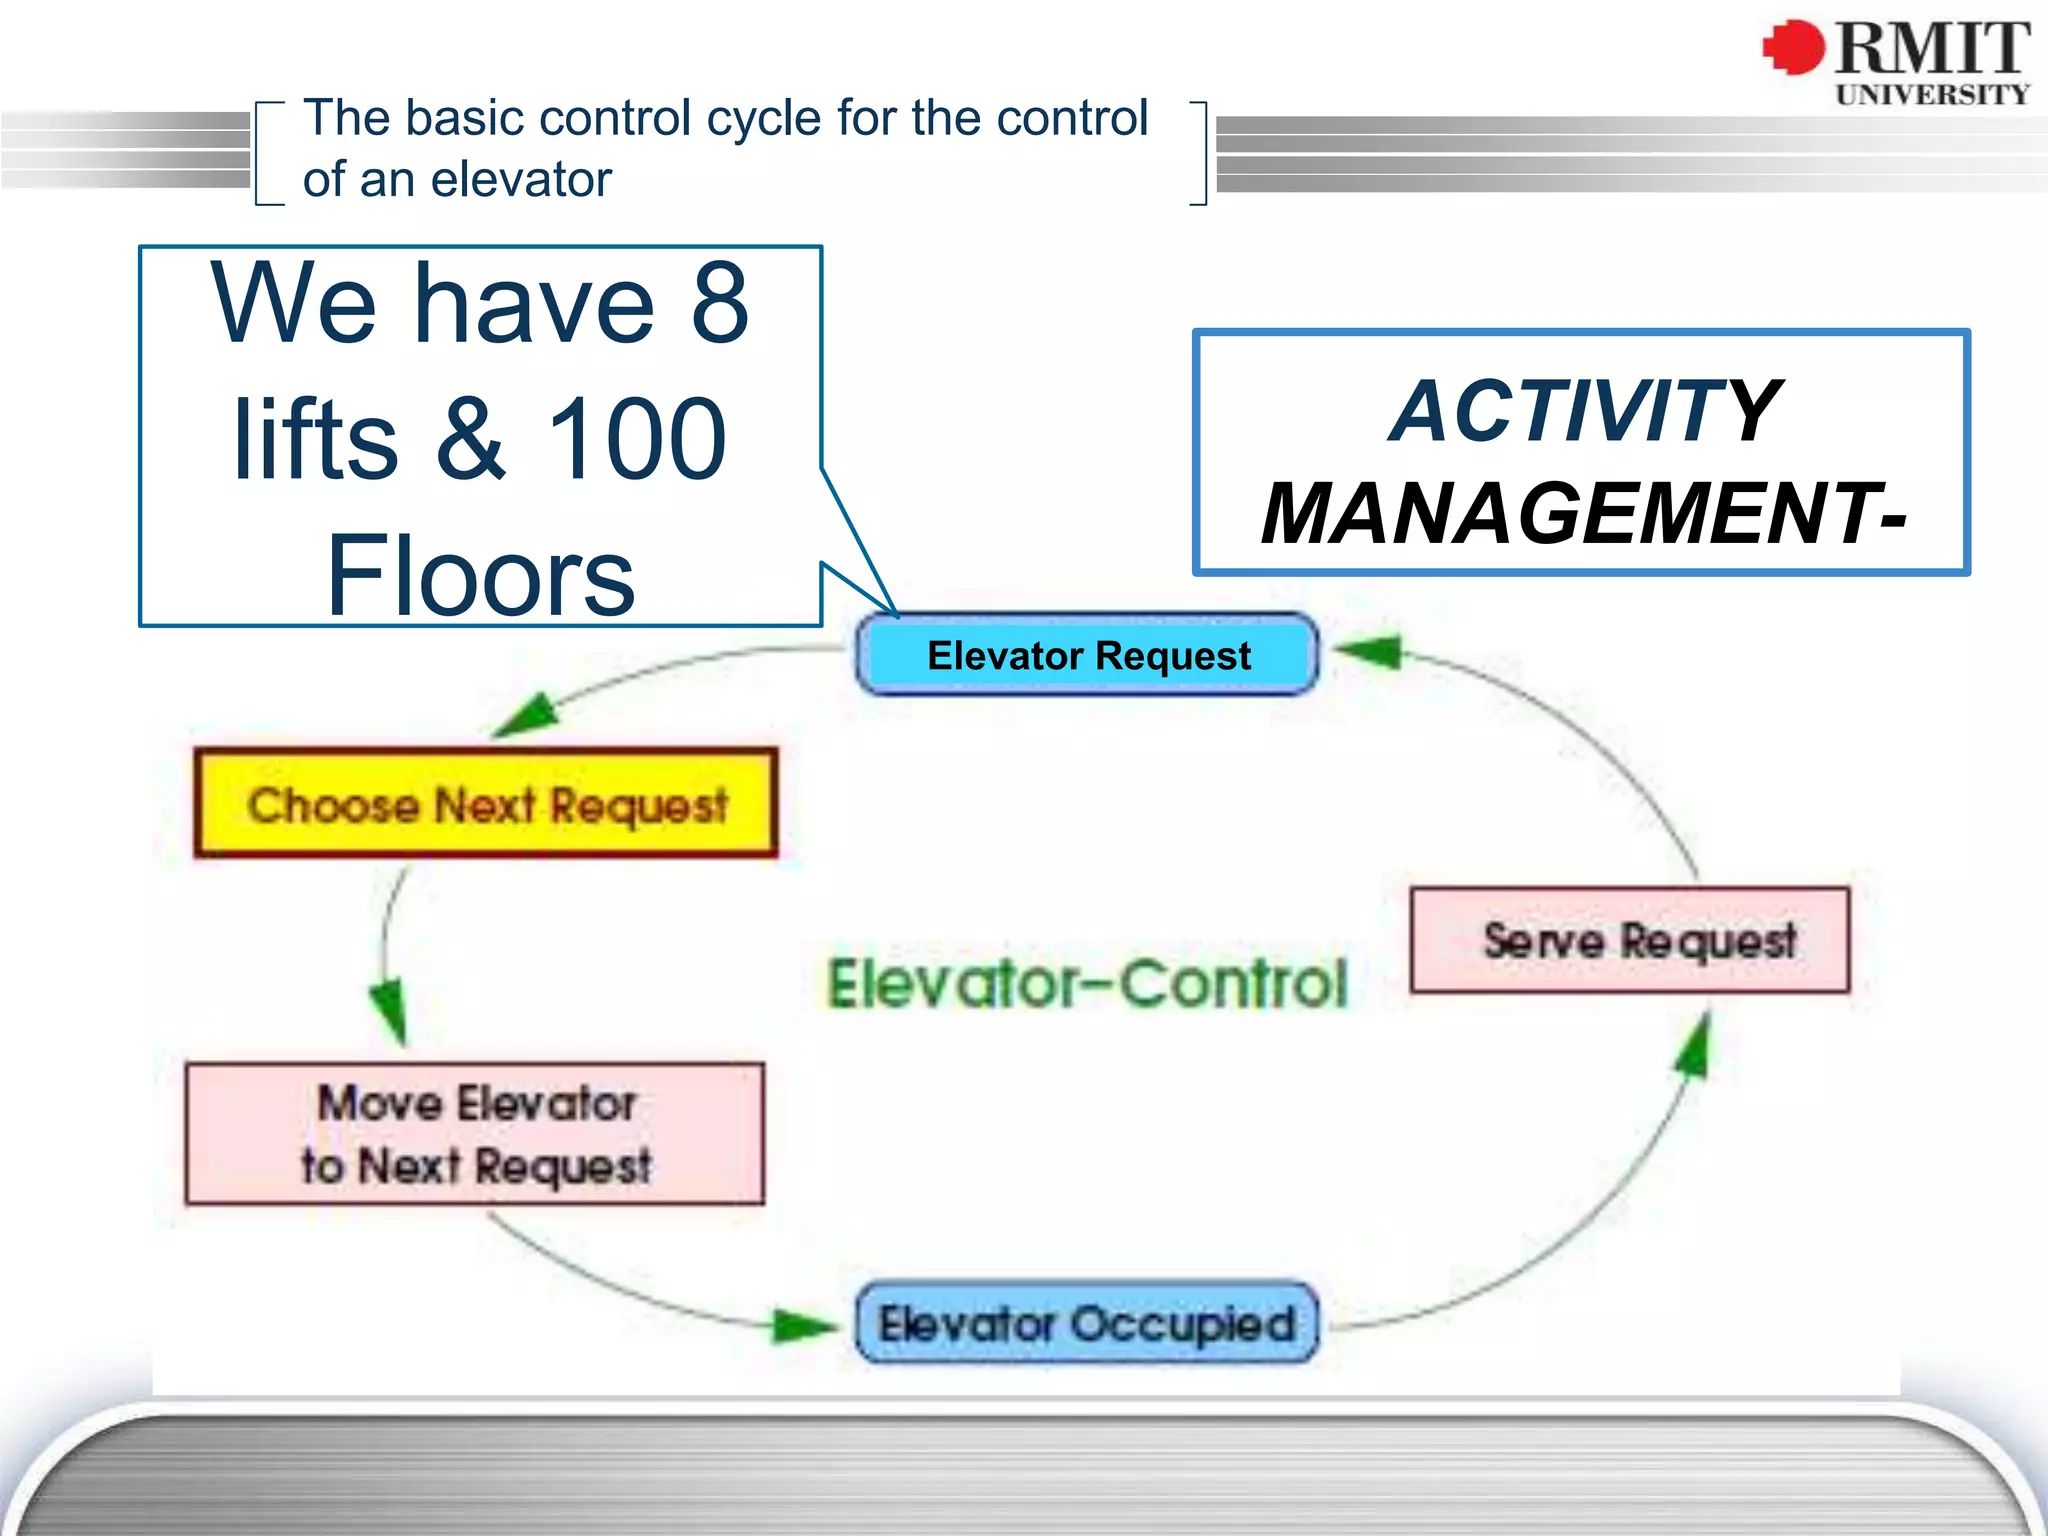
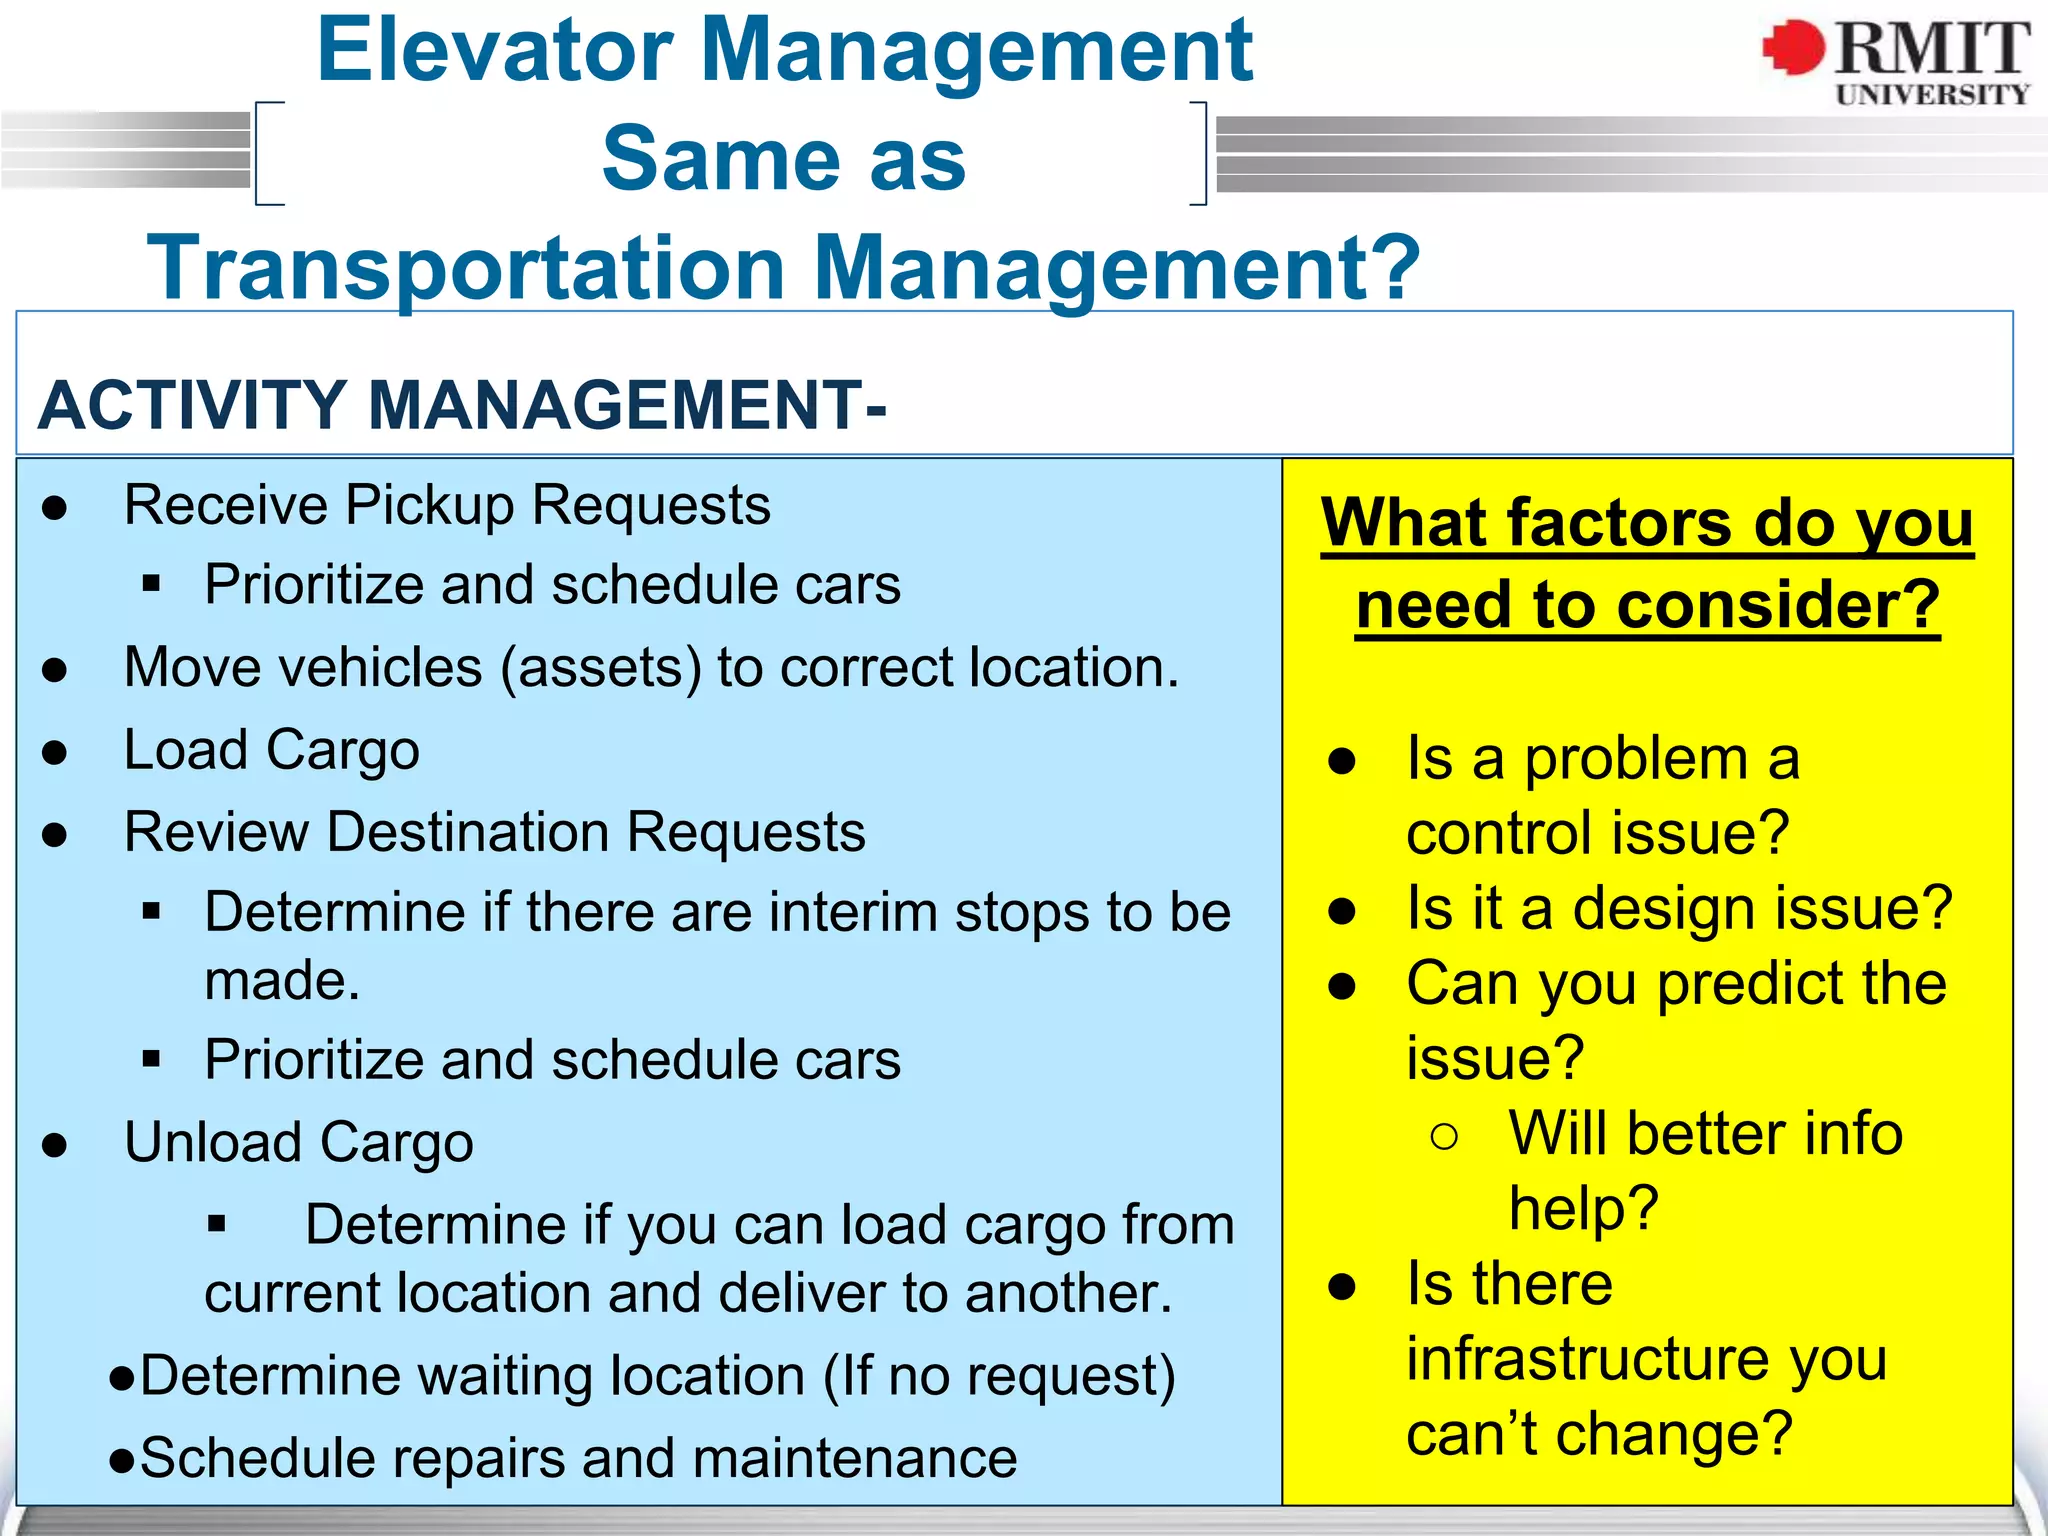


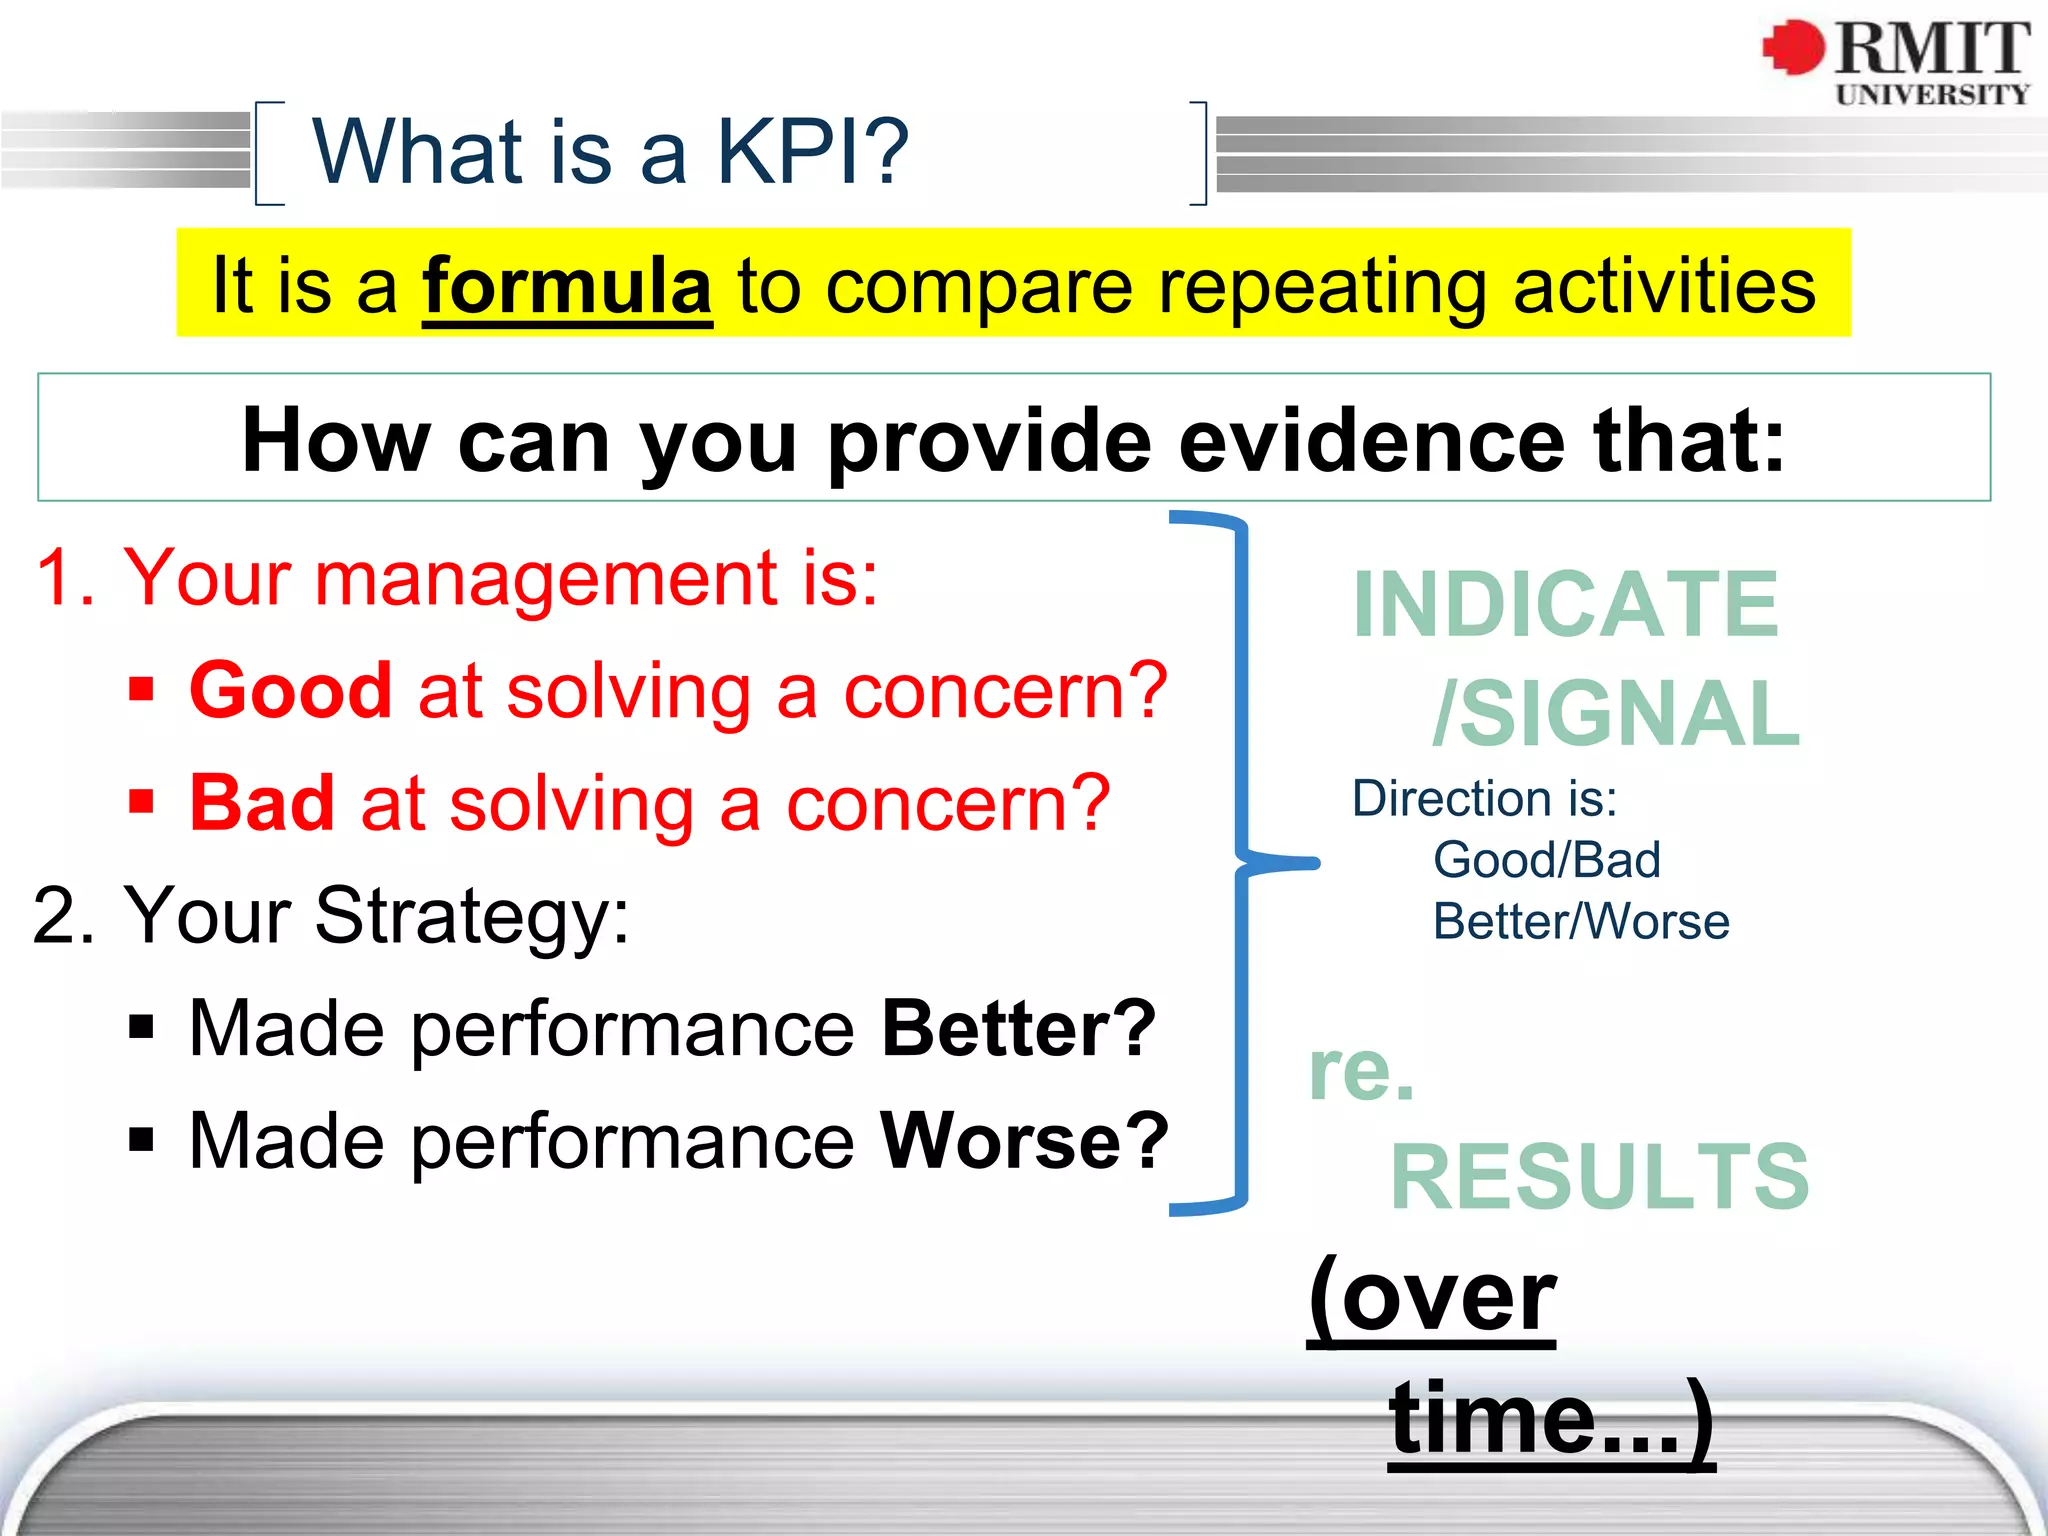
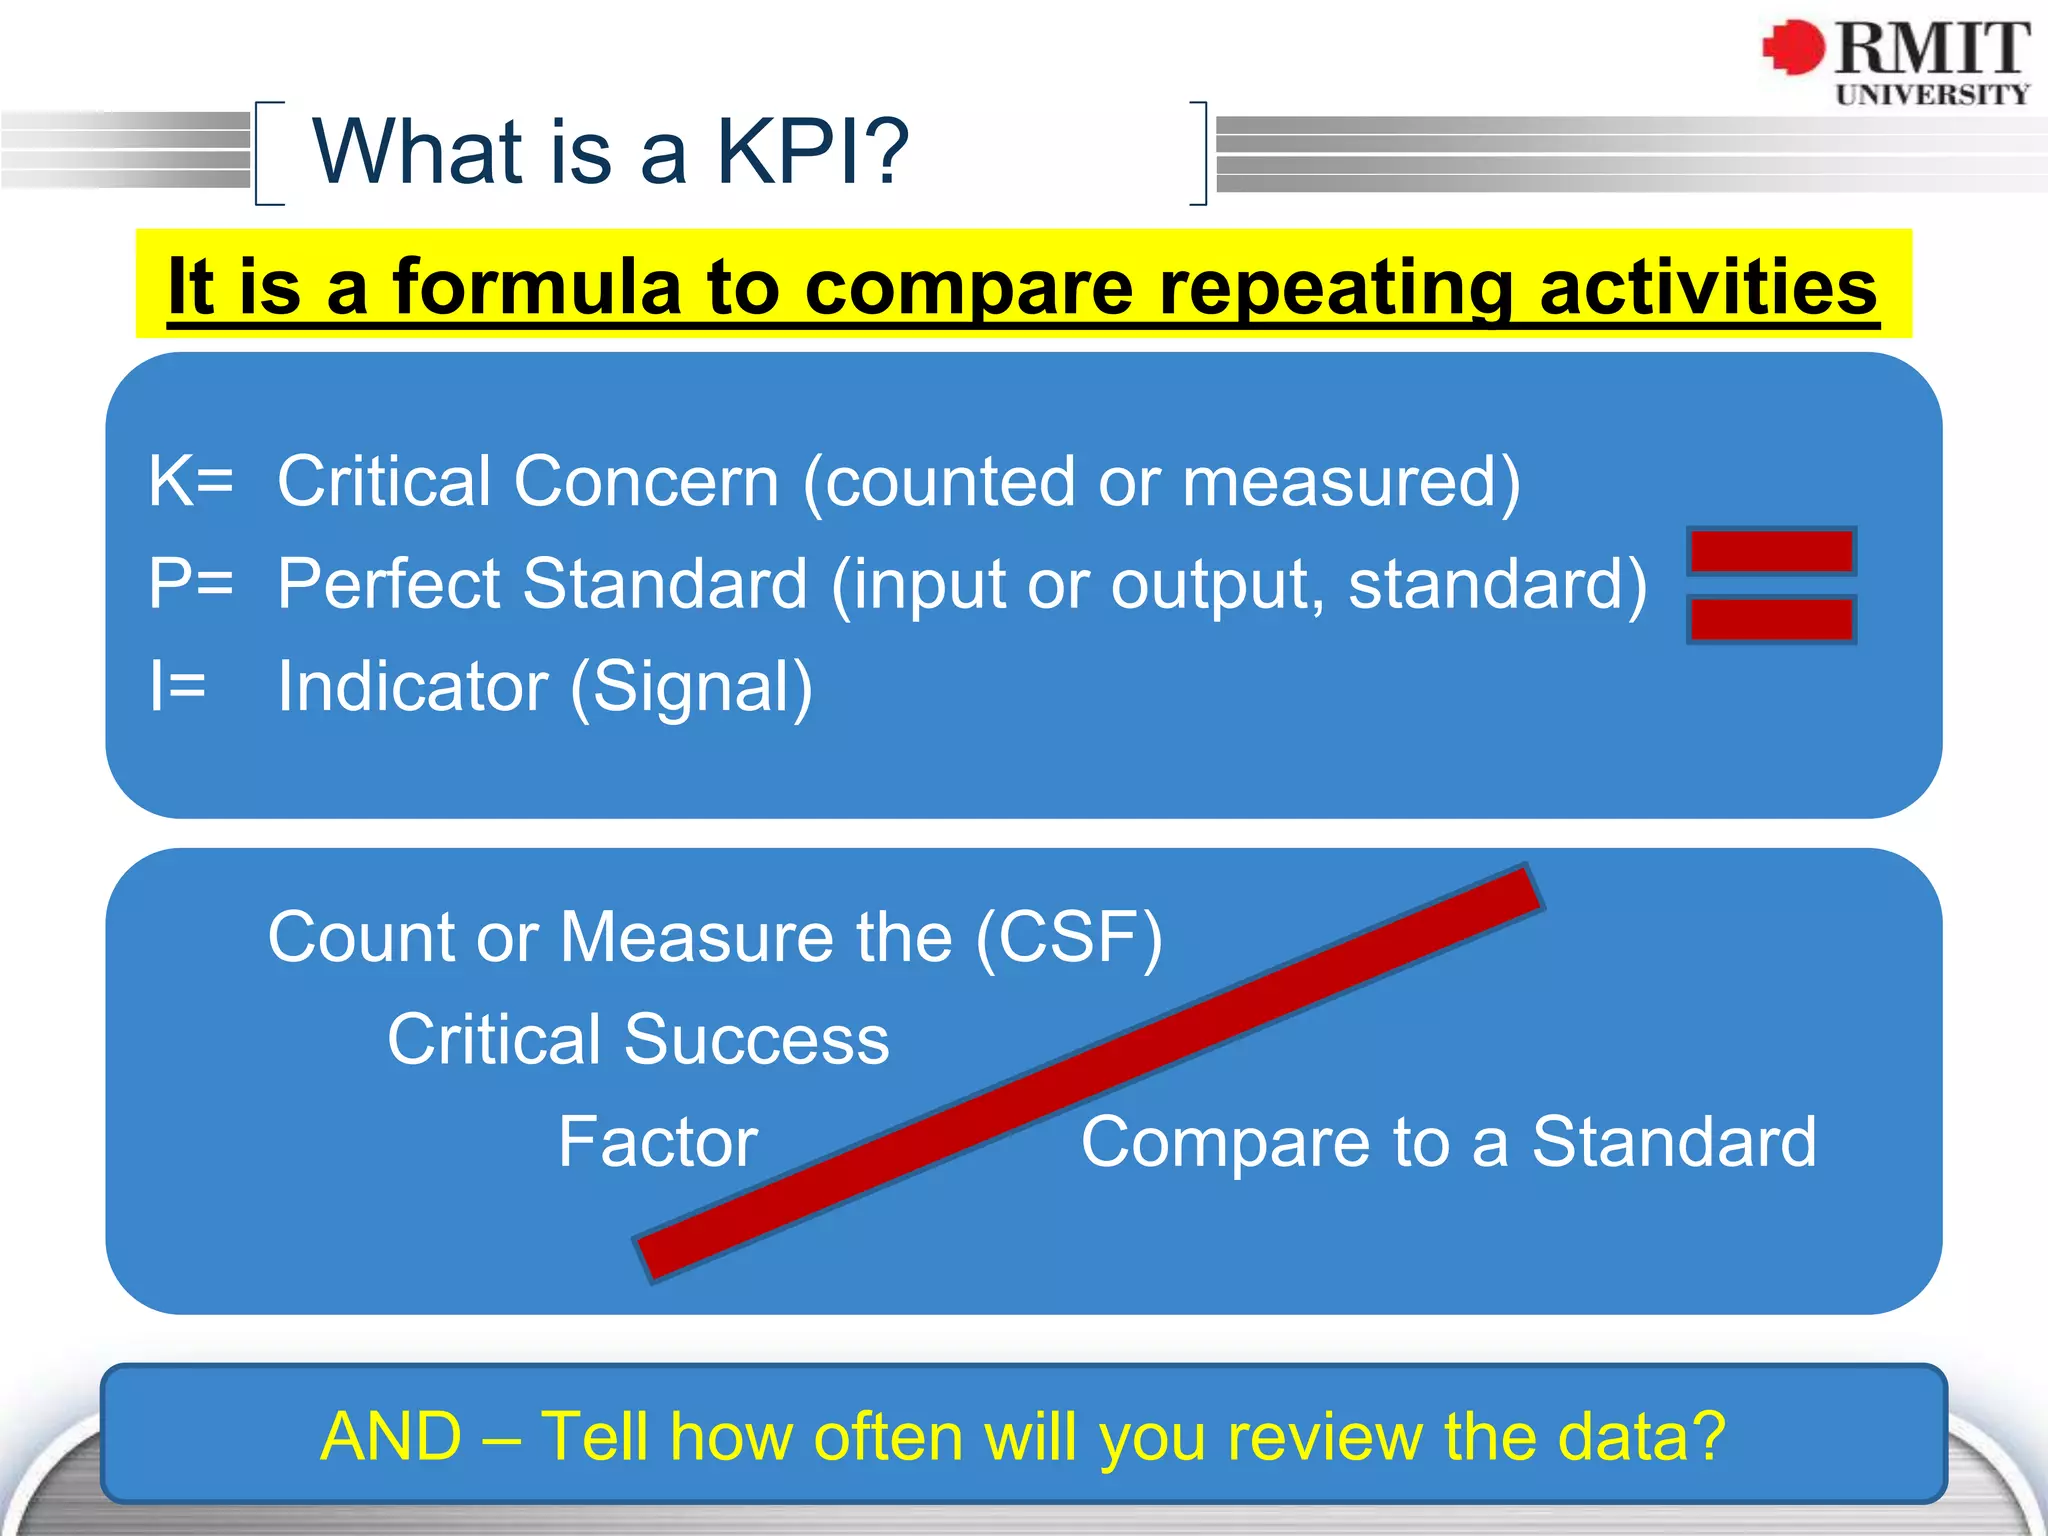
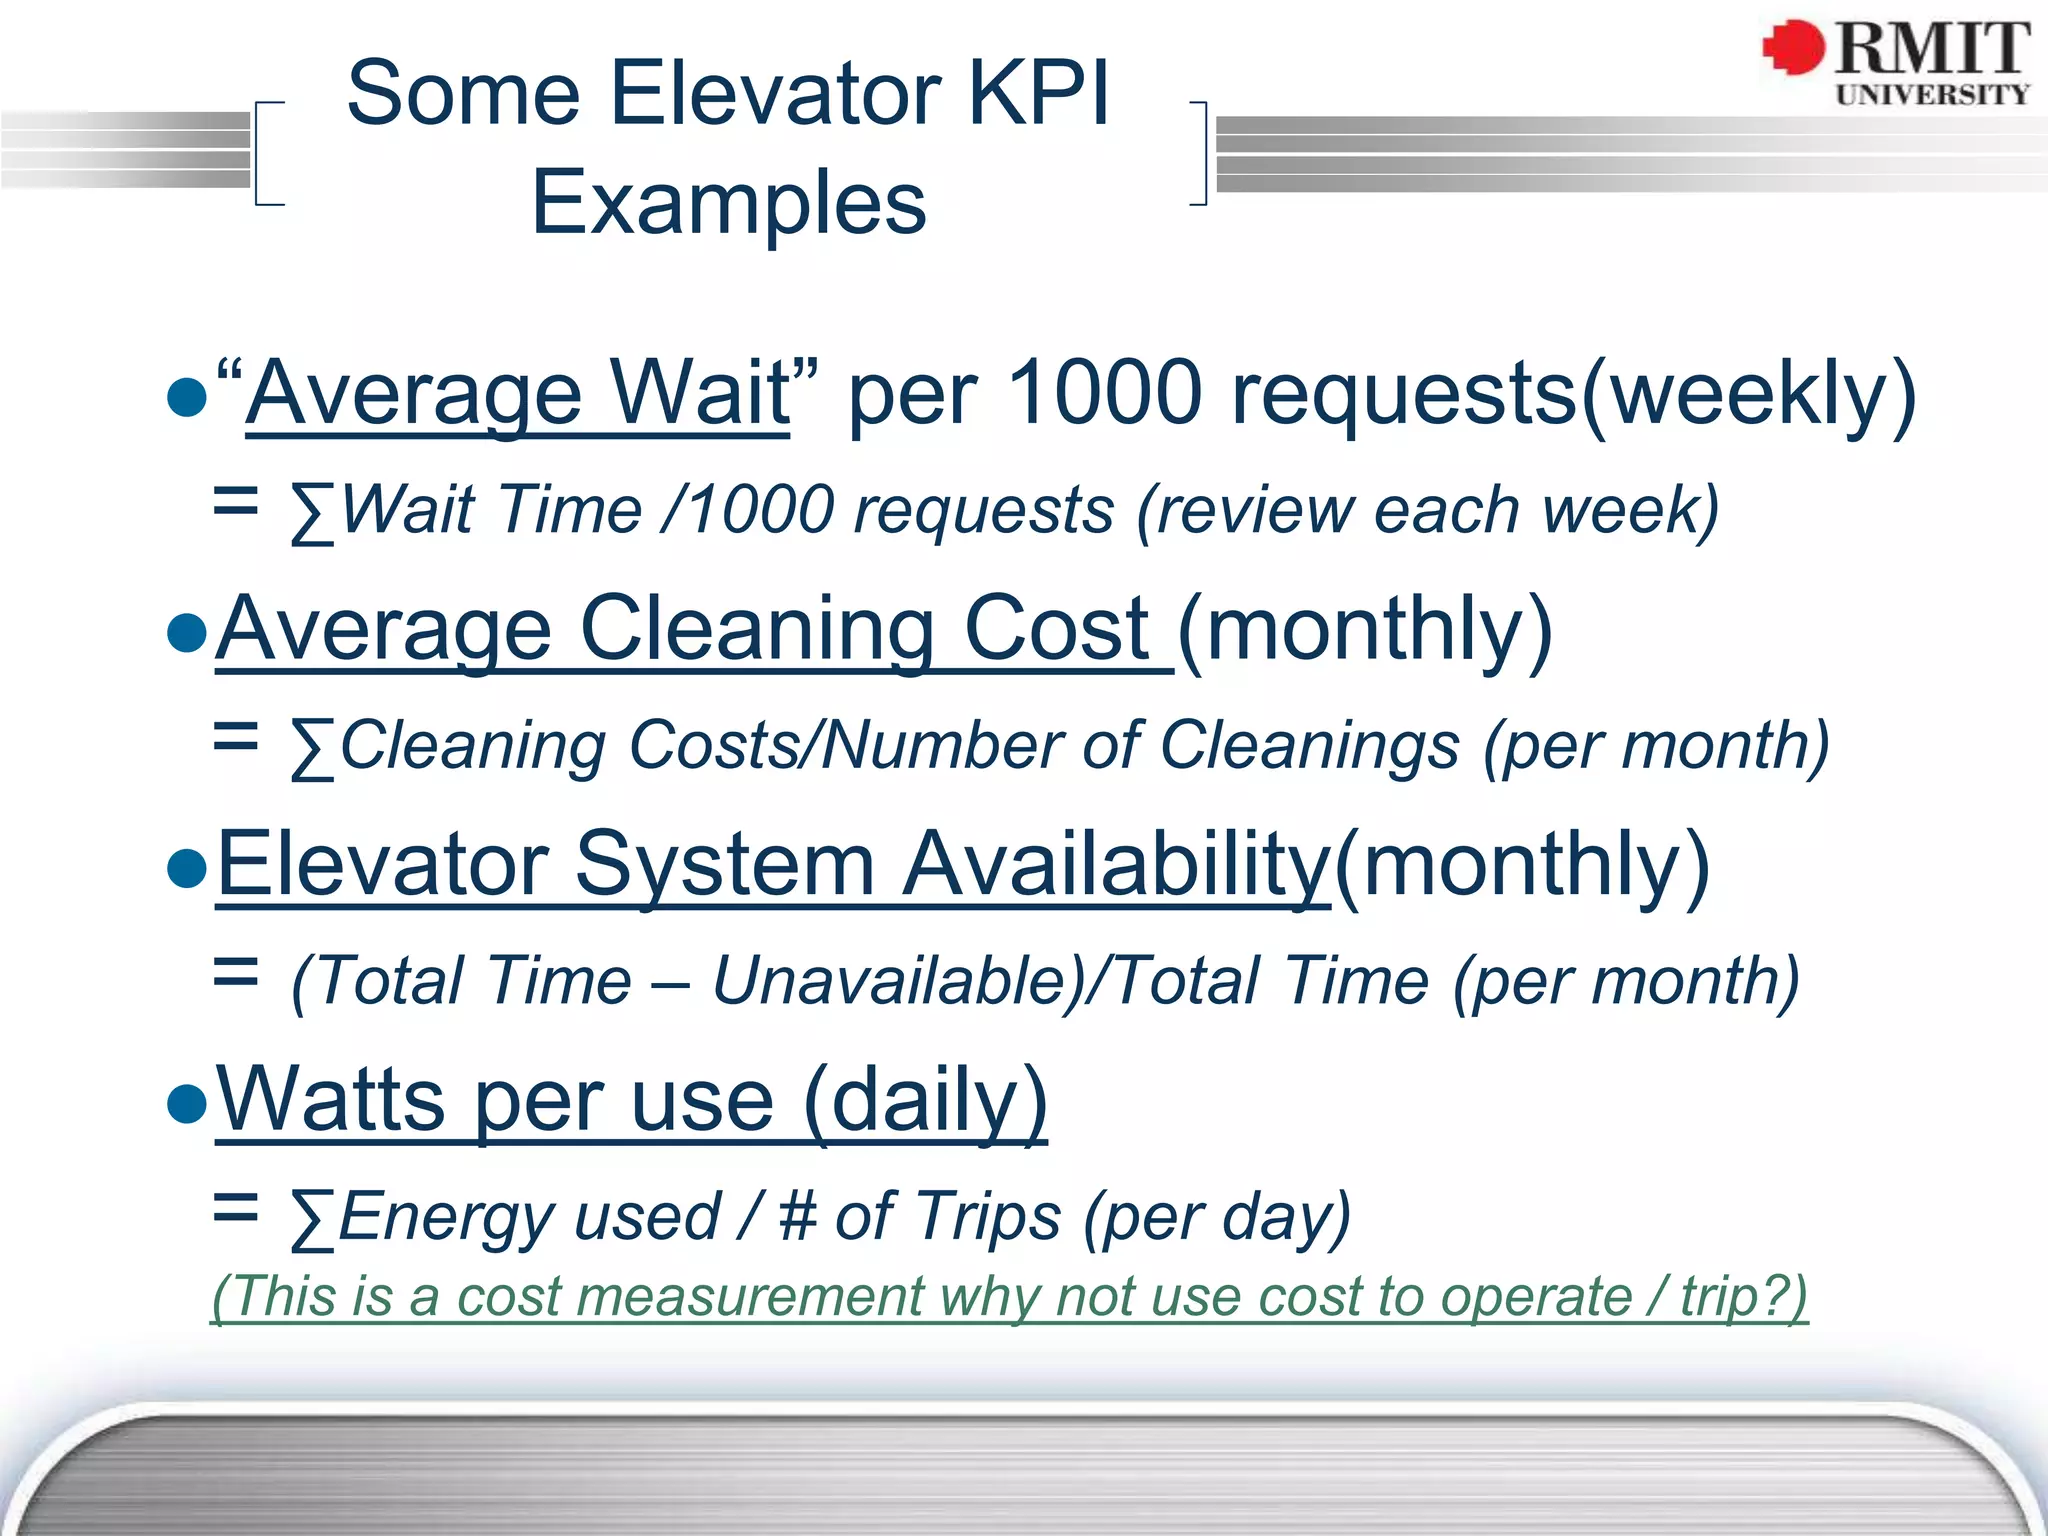
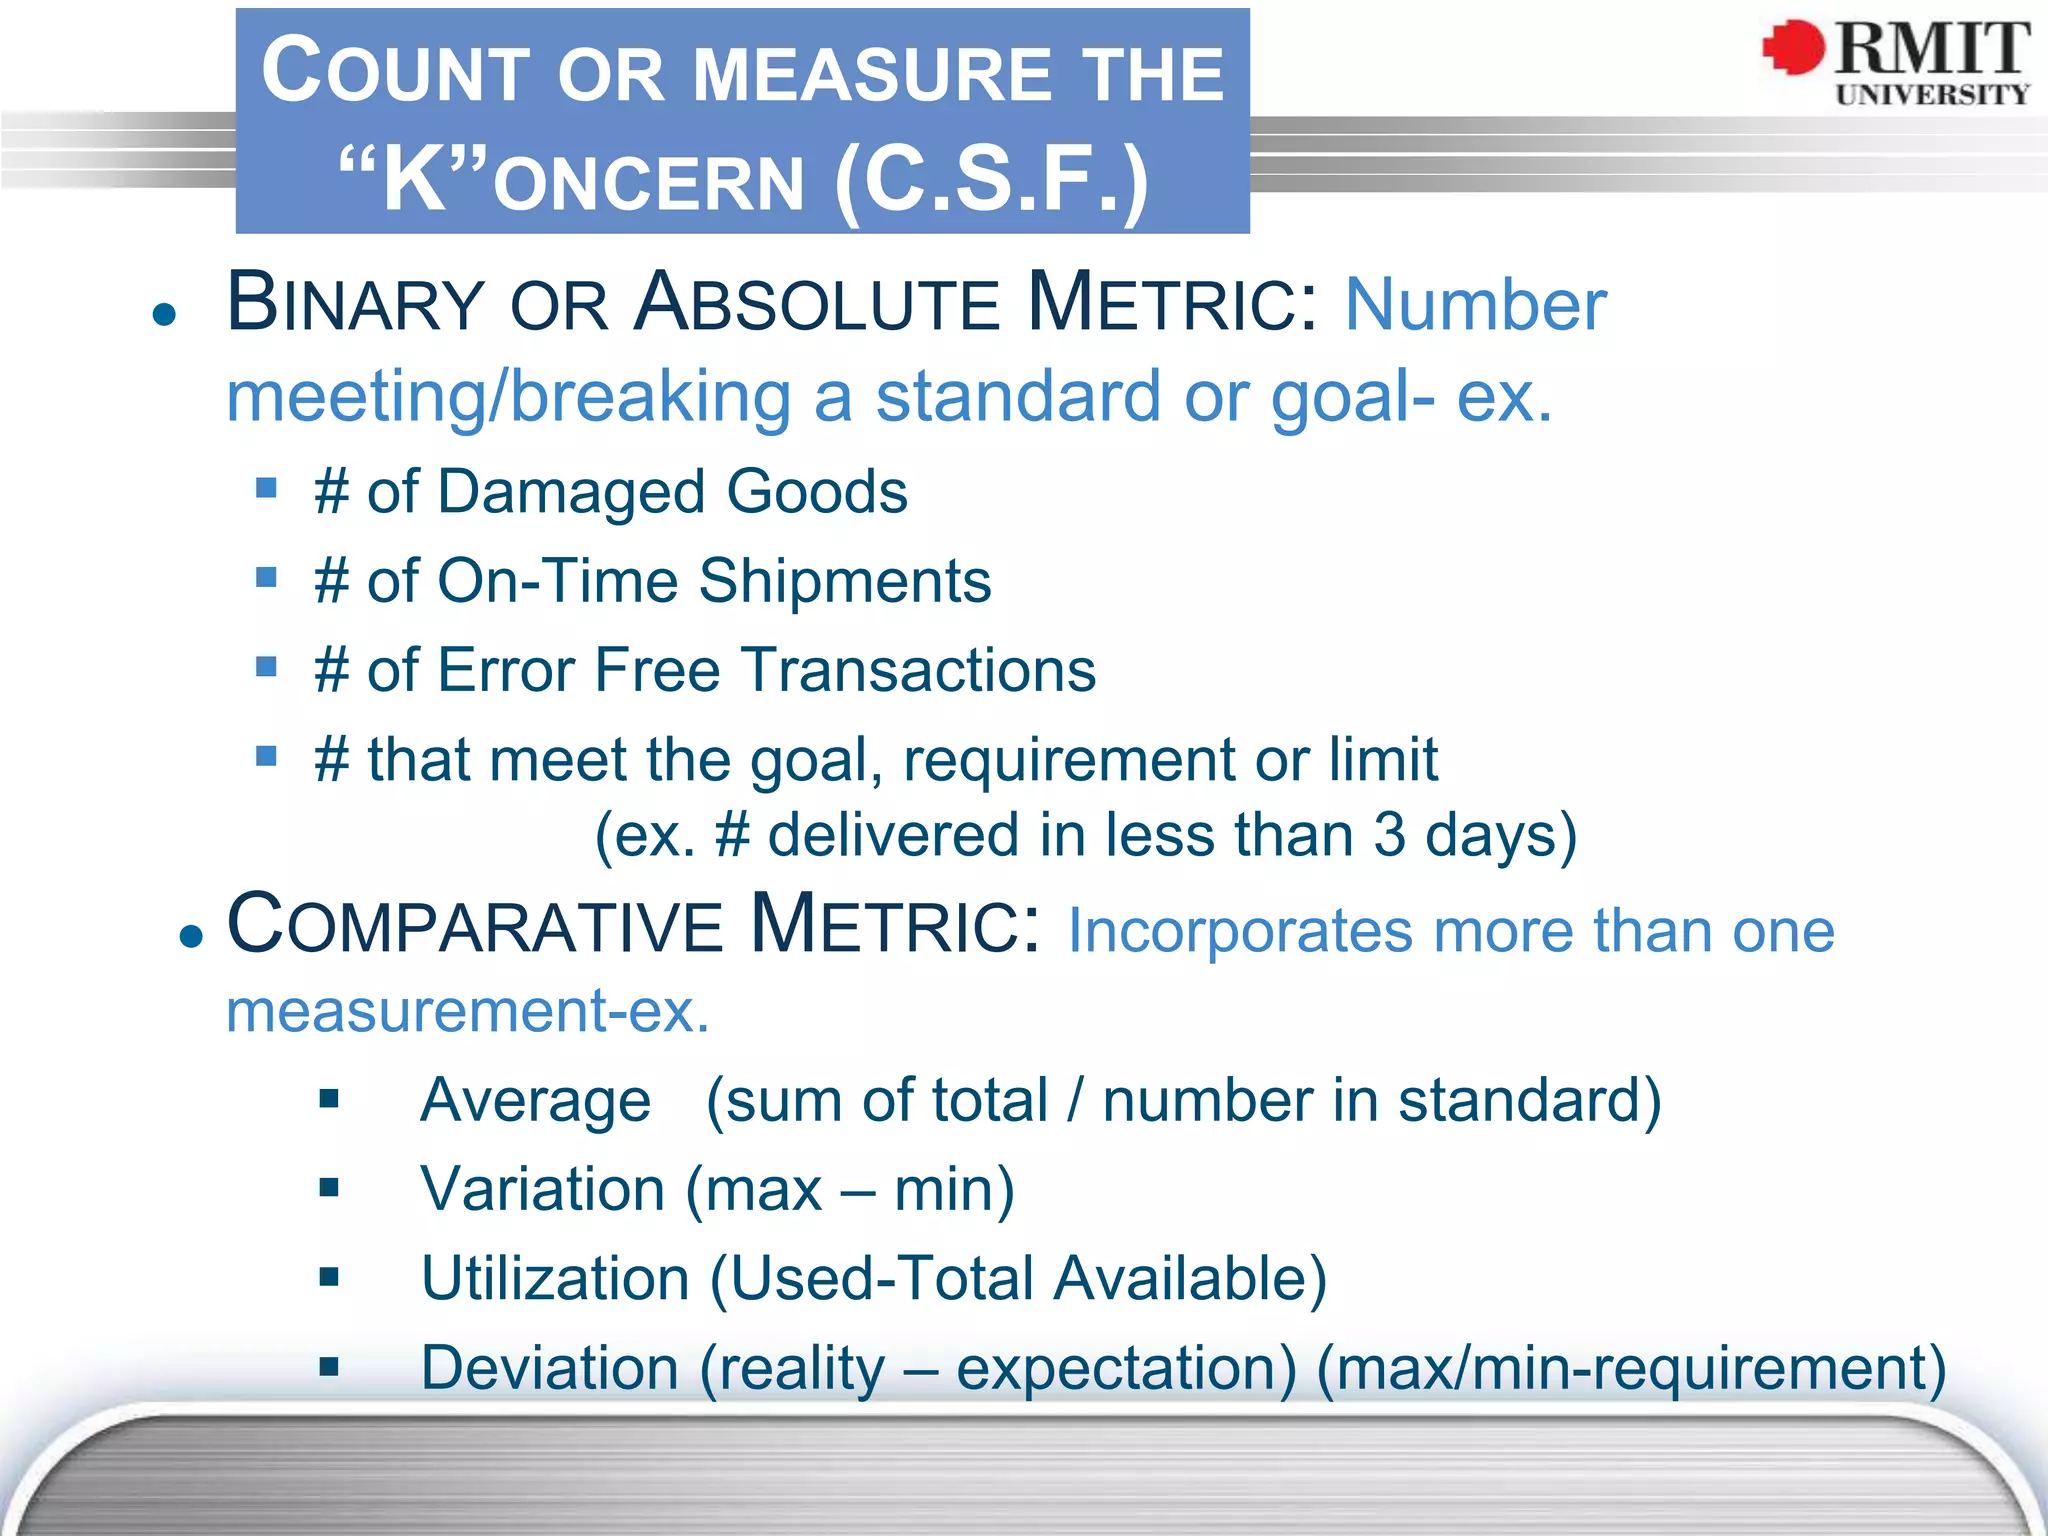
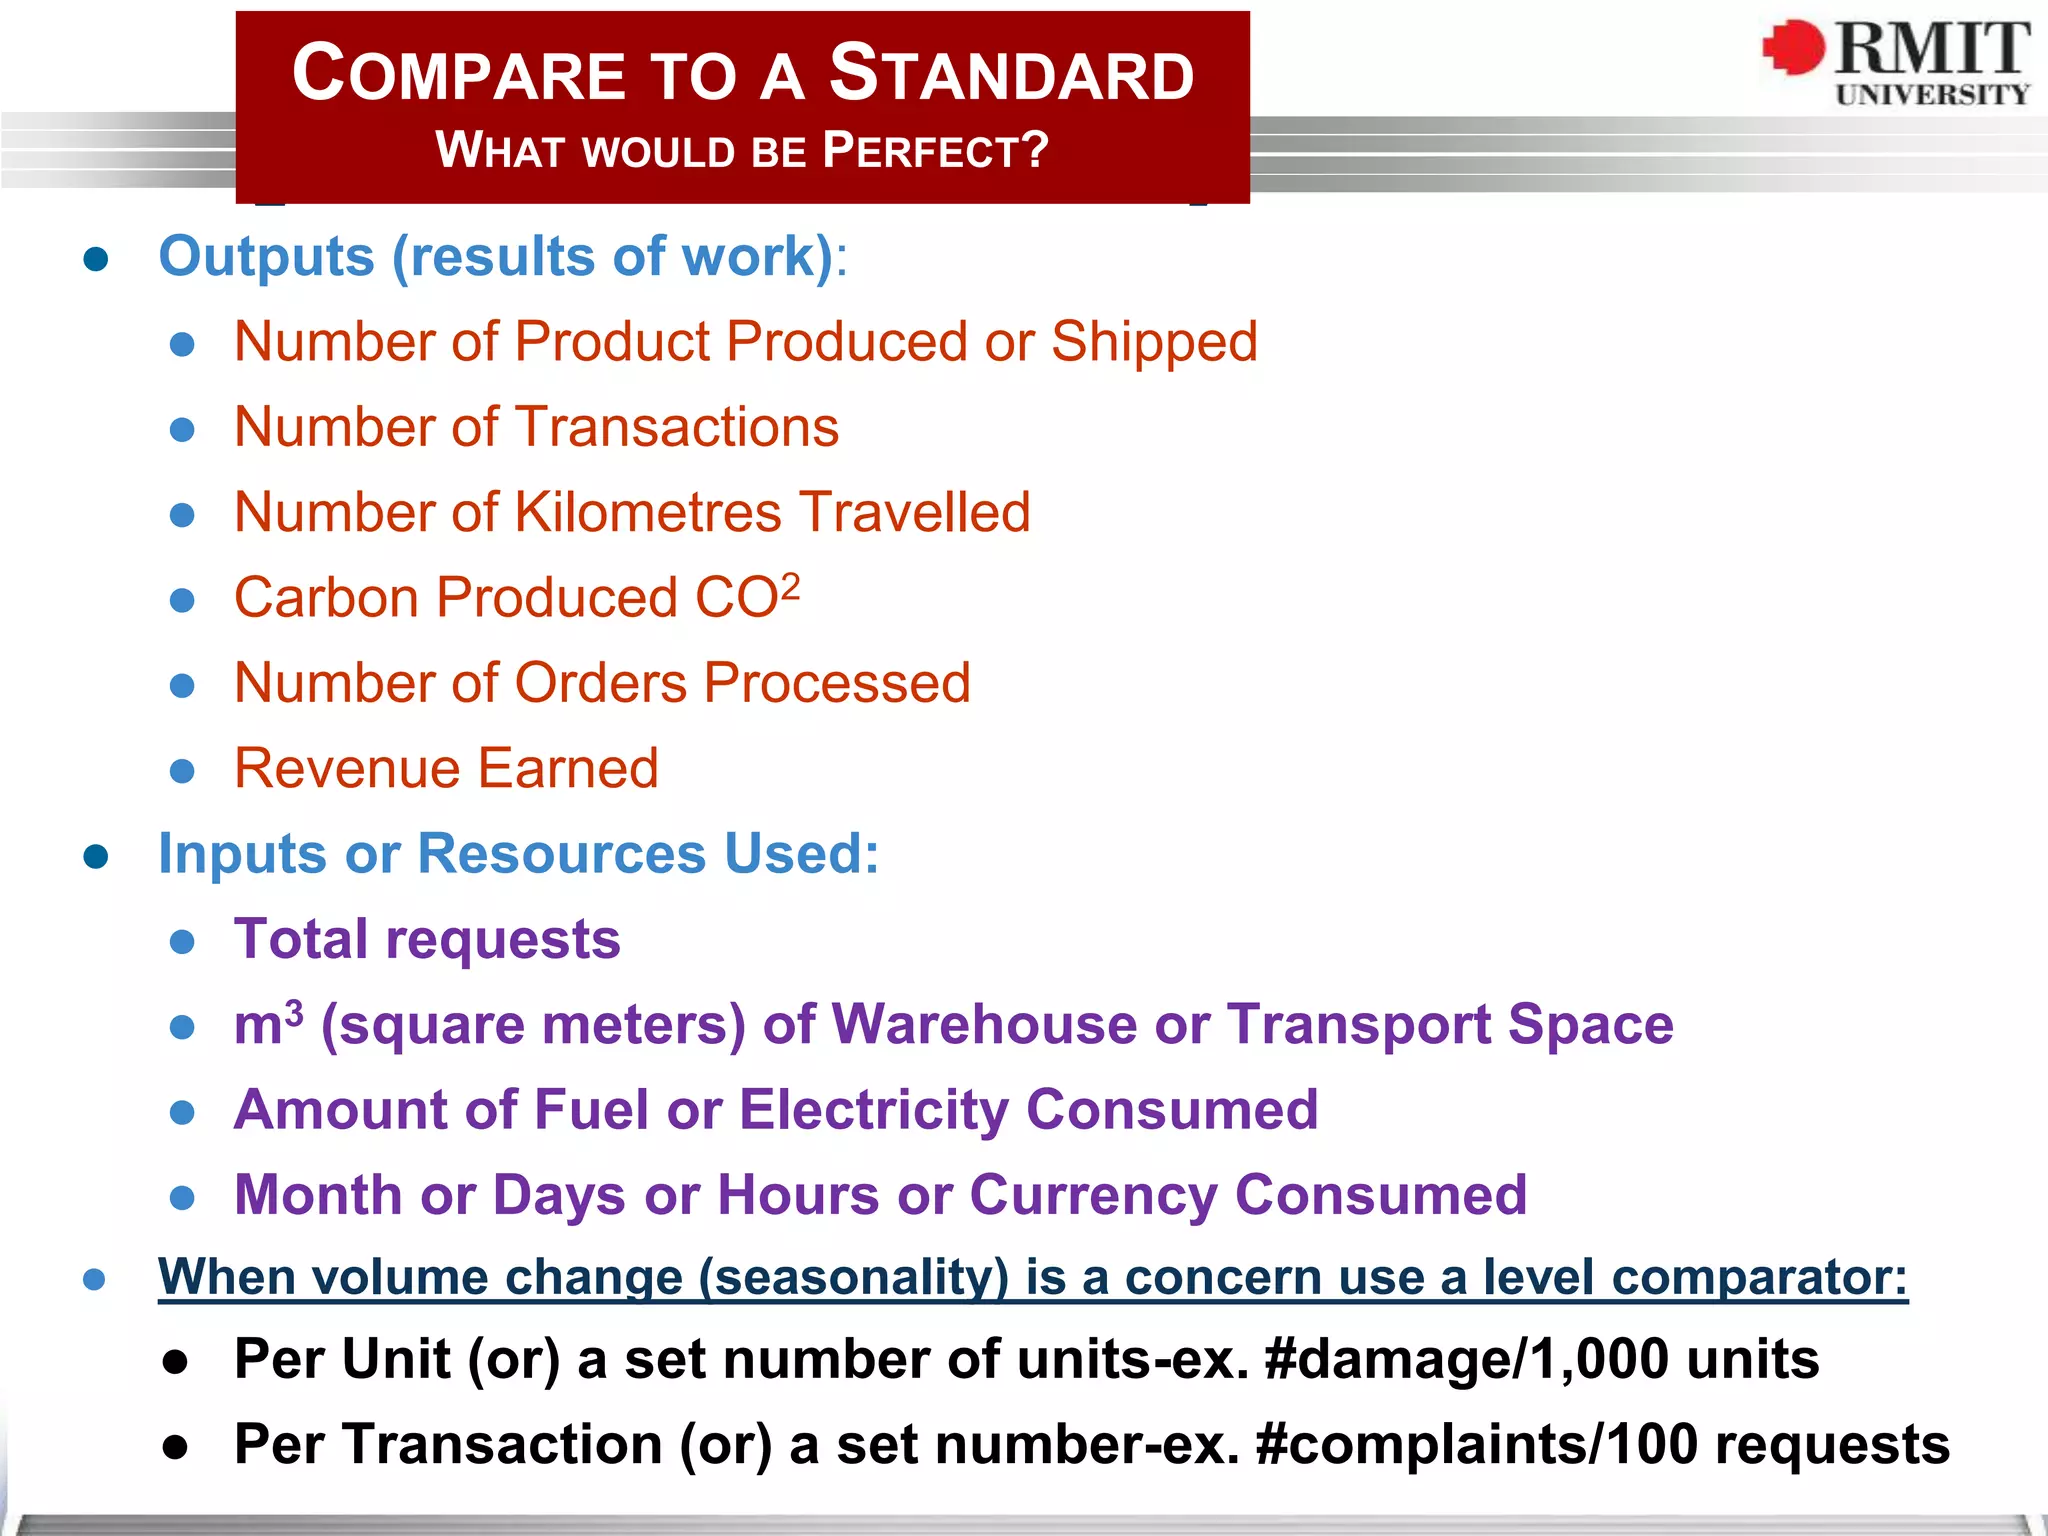
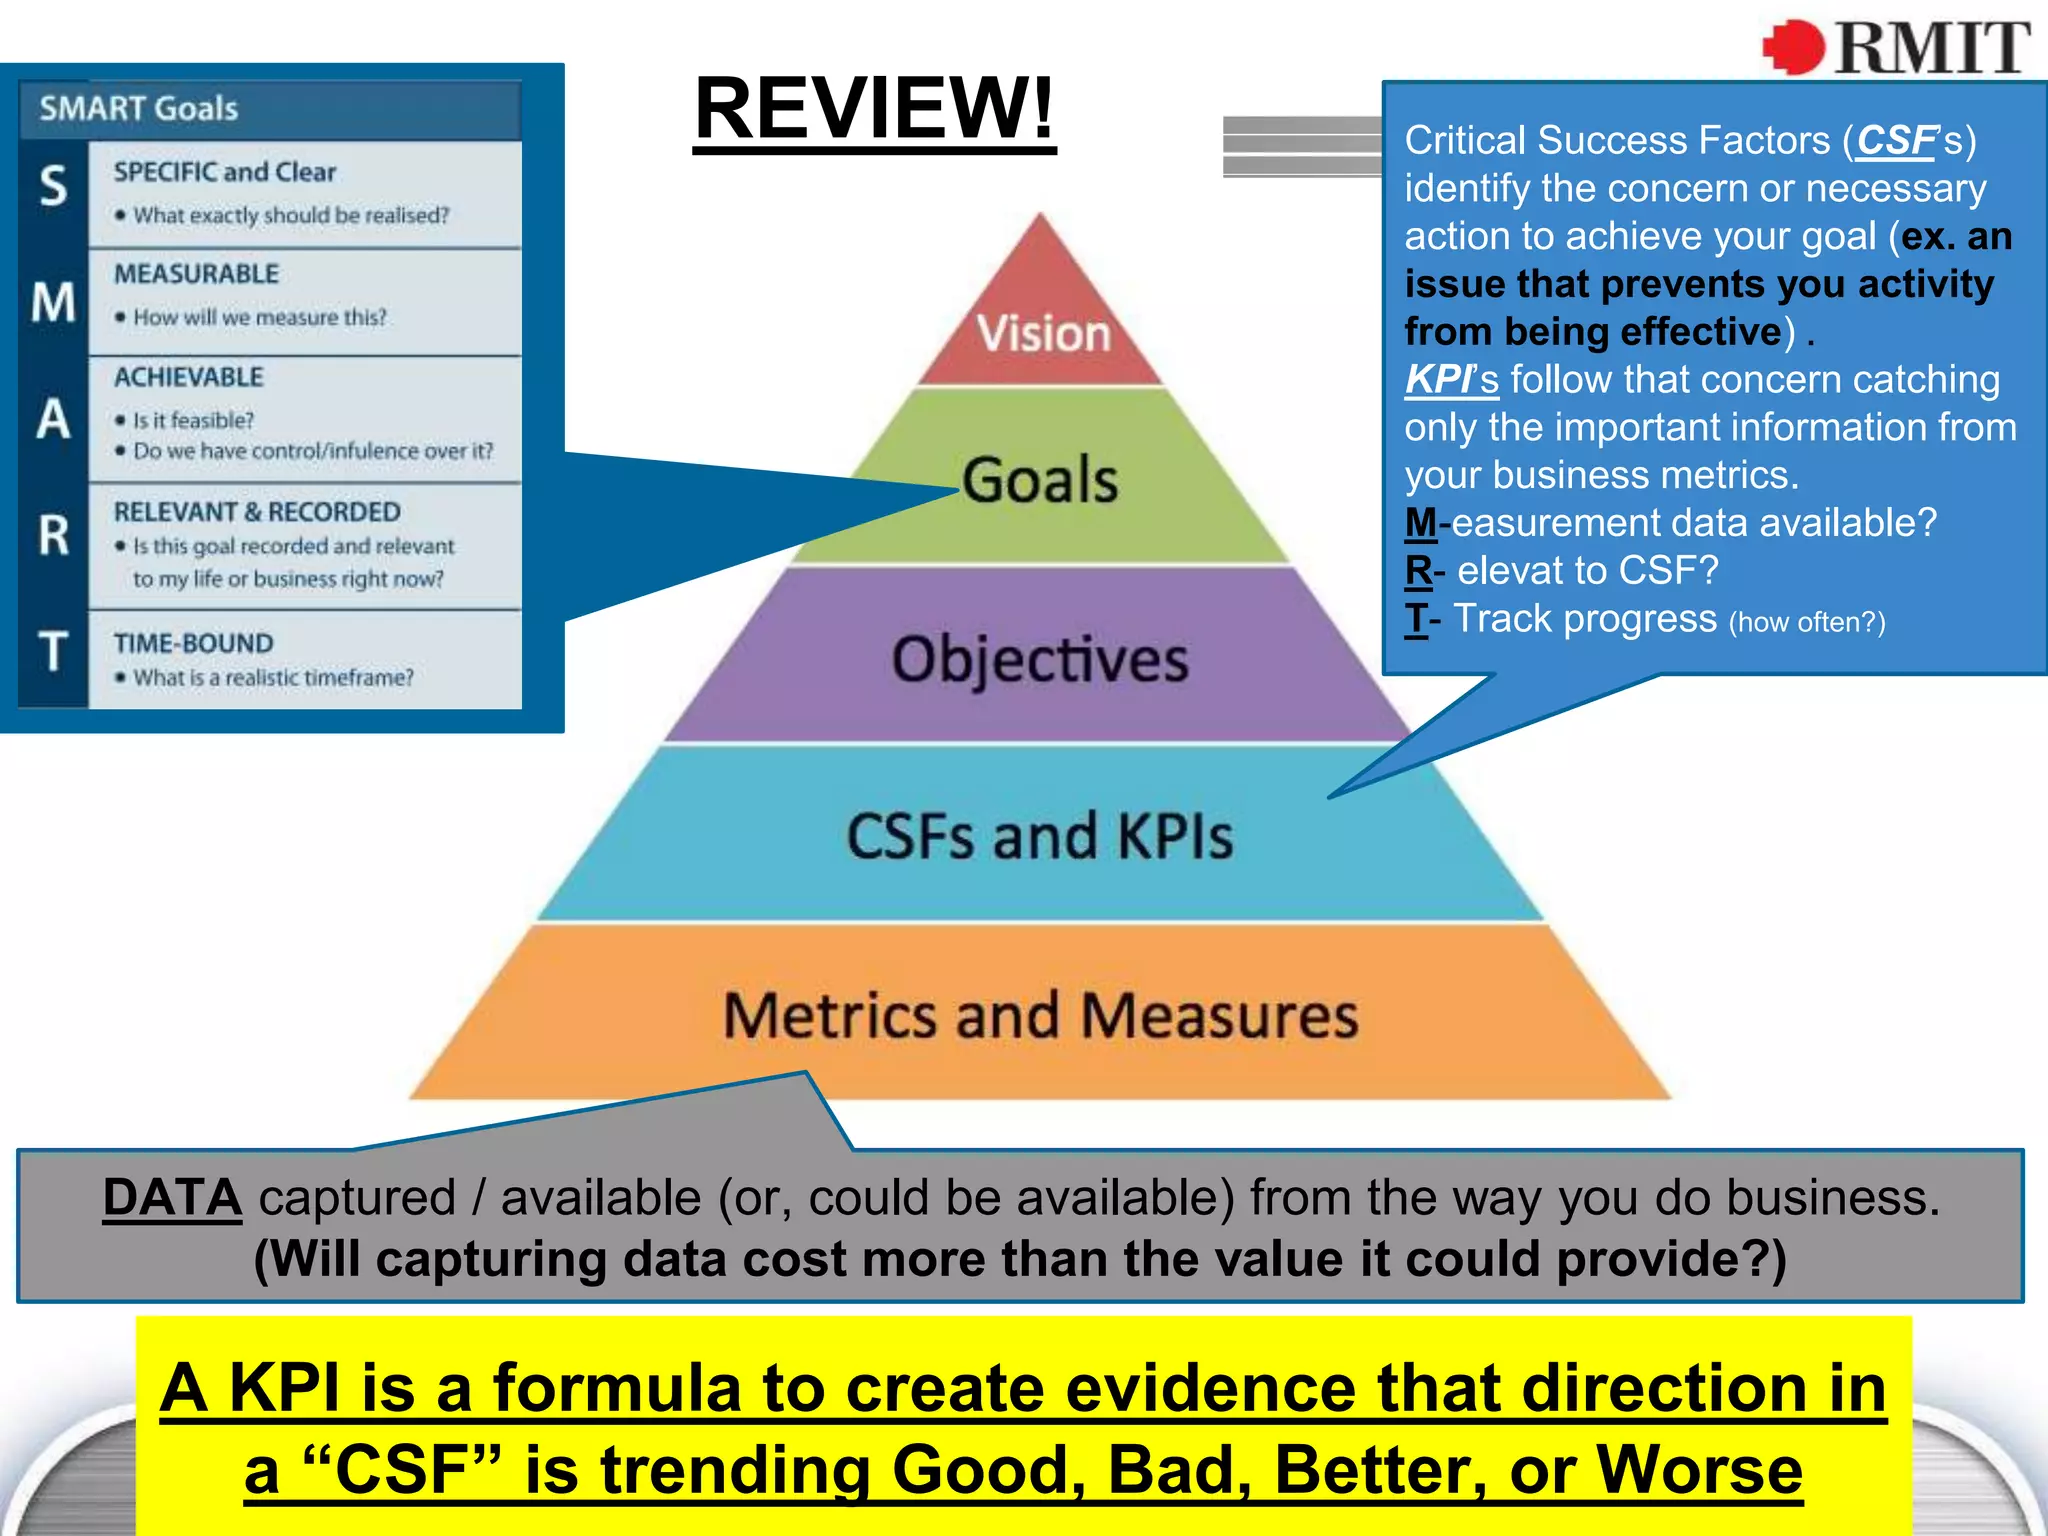


The document discusses the concept of Key Performance Indicators (KPIs), detailing their definition, importance in business management, and how to create effective KPIs based on critical success factors. It emphasizes the need for collecting relevant data and analyzing it to track performance, using examples related to elevator management. The document also highlights the different metrics that can be used to measure success and the necessity of continually reviewing data to ensure that management strategies are effective.


![Intro to Key Performance Indicators [Infographic]](https://cdn.slidesharecdn.com/ss_thumbnails/kpi-infographic-160217090723-thumbnail.jpg?width=640&height=640&fit=bounds)


![LUXr 1-day workshop, Wed November 07, 2012 [San Francisco]](https://cdn.slidesharecdn.com/ss_thumbnails/1day-luxr20121107slideshare-121114152425-phpapp02-thumbnail.jpg?width=640&height=640&fit=bounds)


