Top 6 leadership skills gaps and training trends infographic
•
0 likes•117 views

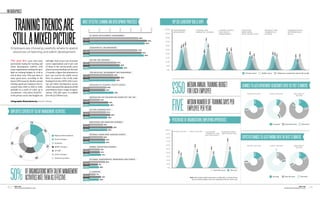
The infographic summarizes key findings from a survey on training trends and talent development practices: - Median annual training spend per employee has increased to £350 but budgets remain tight, with few organizations planning to increase funding. - Employers are choosing cost-effective options like on-the-job training, coaching by line managers, and internal knowledge sharing over external training. - While many organizations have talent management activities, only about half rate them as effective.

Recommended
More Related Content
What's hot
What's hot (8)
Viewers also liked
Viewers also liked (11)
Similar to Top 6 leadership skills gaps and training trends infographic
Similar to Top 6 leadership skills gaps and training trends infographic (20)
More from People Management
More from People Management (19)
Recently uploaded
Recently uploaded (20)
Top 6 leadership skills gaps and training trends infographic
- 1. INFOGRAPHICS TRAINING TRENDS ARE MOST EFFECTIVE LEARNING AND DEVELOPMENT PRACTICES TOP SIX LEADERSHIP SKILLS GAPS 60% 40% 30% 50% 20% 10% 100% 0% PERFORMANCE LEADING AND LEADING PEOPLE COACHING BUSINESS AND C O M M U N I C AT I O N STILL A MIXED PICTURE MANAGEMENT MANAGING CHANGE AND PEOPLE MENTORING COMMERCIAL INTERPERSONAL 90% MANAGEMENT D E V E L O P I N G S TA F F ACUMEN SKILLS IN�HOUSE DEVELOPMENT PROGRAMMES 48% 80% 71% 2009 2010 56% 70% 59% 2011 54% 55% 55% 60% 52% Employers are choosing carefully where to spend COACHING BY LINE MANAGERS 45% 45% 47% 50% 40% resources on learning and talent development 2009 36% 36% 51% 35% 34% 2010 40% 31% 31% 31% 53% 29% 2011 26% 30% The past few 18% O N �T H E �J O B T R A I N I N G years have been still tight. Only 16 per cent of private 20% 27% particularly testing for learning and sector organisations and 15 per cent 2009 2010 30% 10% talent development (L&TD), with of those in the not-for-profit sector 2011 33% many organisations turning the spot- plan to increase funding over the next 0% light on training budgets in a bid to 12 months, a figure that plummets to J O B R O TAT I O N , S E C O N D M E N T A N D S H A D O W I N G Private sector Public sector Voluntary, community and not-for-profit rein in their costs. This year there is just 1 per cent for the public sector. 2009 24% some good news, according to the Here we present a few of the main 2010 30% 26% £350 latest cIPD research. Median annual findings from the cIPD’s 2011 Learn- 2011 training spend per employee has in- creased from £250 in 2010 to £350, ing and Talent Development survey, which canvassed the opinions of 600 COACHING BY EXTERNAL PRACTITIONERS 18% MEDIAN ANNUAL TRAINING BUDGET CHANGES TO L&TD DEPARTMENT HEADCOUNTS OVER THE PAST 12 MONTHS FOR EACH EMPLOYEE 2009 probably as a result of a pick up in practitioners from a range of organi- 2010 16% recruitment – a key driver of L&TD – sations. (The full report is available 2011 24% P R I VAT E S E C TO R PUBLIC SECTOR NON�PROFIT in the private sector. But budgets are from bit.ly/CIPDsurveys). SECTOR INSTRUCTOR�LED TRAINING DELIVERED OFF THE JOB FIVE EMPLOYEE PER YEAR MEDIAN NUMBER OF TRAINING DAYS PER 2009 12% 22% Infographic illustrations by: Section Design 21% 7% 19% 14 % 2010 % 34 2011 20% ACTION LEARNING SETS 27% 52% 63% EMPLOYEES COVERED BY TALENT MANAGEMENT ACTIVITIES 2009 17% 2010 21% 59 18% % 2011 77% M E N TO R I N G A N D B U D DY I N G S C H E M E S PERCENTAGE OF ORGANISATIONS EMPLOYING APPRENTICES 14% Increased Stayed the same Decreased 2009 % 2010 23% 18% 35 2011 100% 64% P R I VAT E S E C TO R PUBLIC SECTOR V O L U N T A R Y, M A N U FAC T U R I N G 90% COMMUNITY AND AND PRODUCTION INTERNAL KNOWLEDGE�SHARING EVENTS High-potential employees EXPECTED CHANGES TO L&TD FUNDING OVER THE NEXT 12 MONTHS N OT� F O R � P R O F I T 2009 14% 80% Senior managers 68% 2010 16% 70% 16% 36% Graduates 2011 53% 60% P R I VAT E S E C TO R PUBLIC SECTOR NON�PROFIT 51% Middle managers F O R M A L E D U C AT I O N C O U R S E S 46% 45% SECTOR 11% 50% 1% 2009 39% All staff 35% 11% 34% 2010 40% 15% 16% 20 % 31% Junior managers 2011 12% 40% 44% 30% Technical specialists % % EXTERNAL CONFERENCES, WORKSHOPS AND EVENTS 20% 57 52 2009 16% 27% 78% 10% % 2010 9% 33 10% 50% 2011 0% OF ORGANISATIONS WITH TALENT MANAGEMENT E�LEARNING 7% Past three years This year ACTIVITIES RATE THEM AS EFFECTIVE 2009 2010 12% Note: Only includes English organisations as skills policy is a devolved issue. Increase Stay the same Decrease 2011 10% Does not include employers who were undecided at the time of the survey. 40 ⁄ May 2011 PEOPLEMANAGEMENT.cO.uk May 2011 PEOPLEMANAGEMENT.cO.uk ⁄ 41