Download as PDF, PPTX

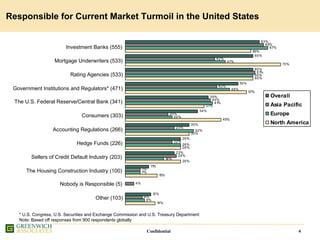
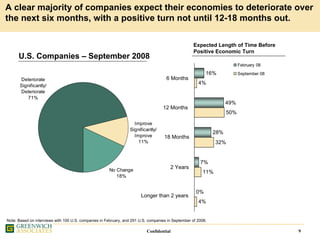
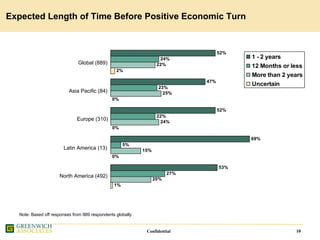
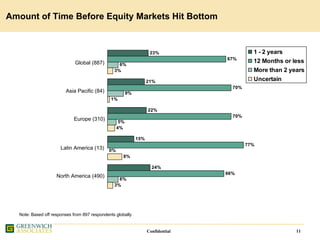
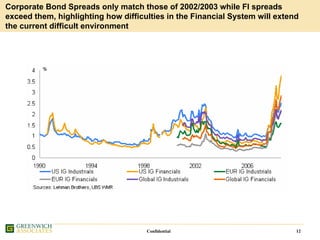
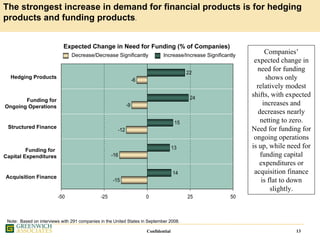
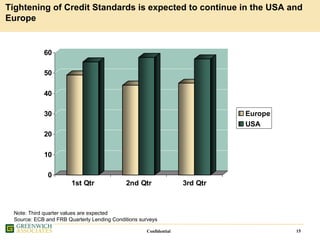
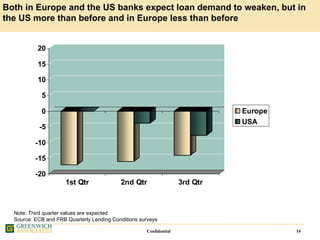
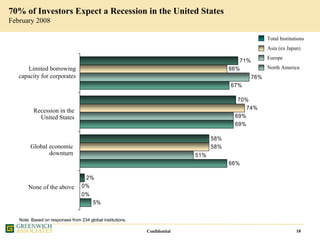
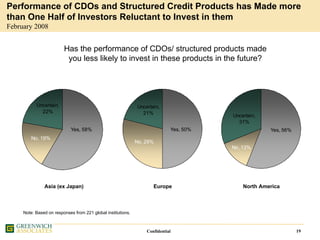
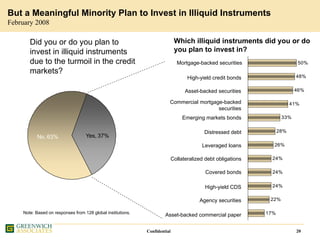
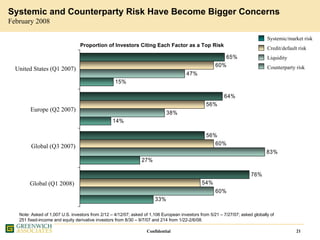

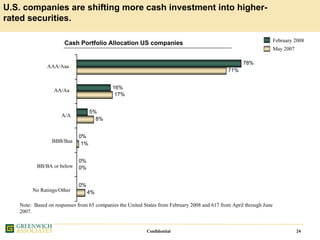
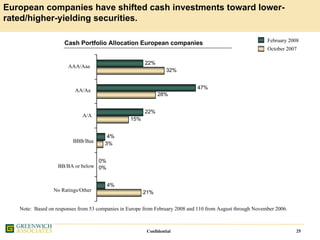
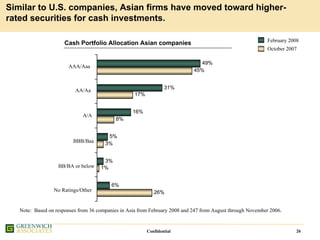
The document provides an agenda for a discussion on "Living in Interesting Times" and summarizes market conditions and investor sentiment in 2008 during the liquidity crunch and financial crisis. Key points from surveys of investors and companies around the world include: most believe a recession is coming to the US; confidence in structured credit products has declined; concerns about systemic, counterparty, and liquidity risks have increased; return expectations and risk tolerances for cash investments have fallen; and companies are shifting cash to higher rated securities. Tightening credit is expected to continue squeezing loan demand and economic growth in both Europe and the US.


