Downloaded 139 times


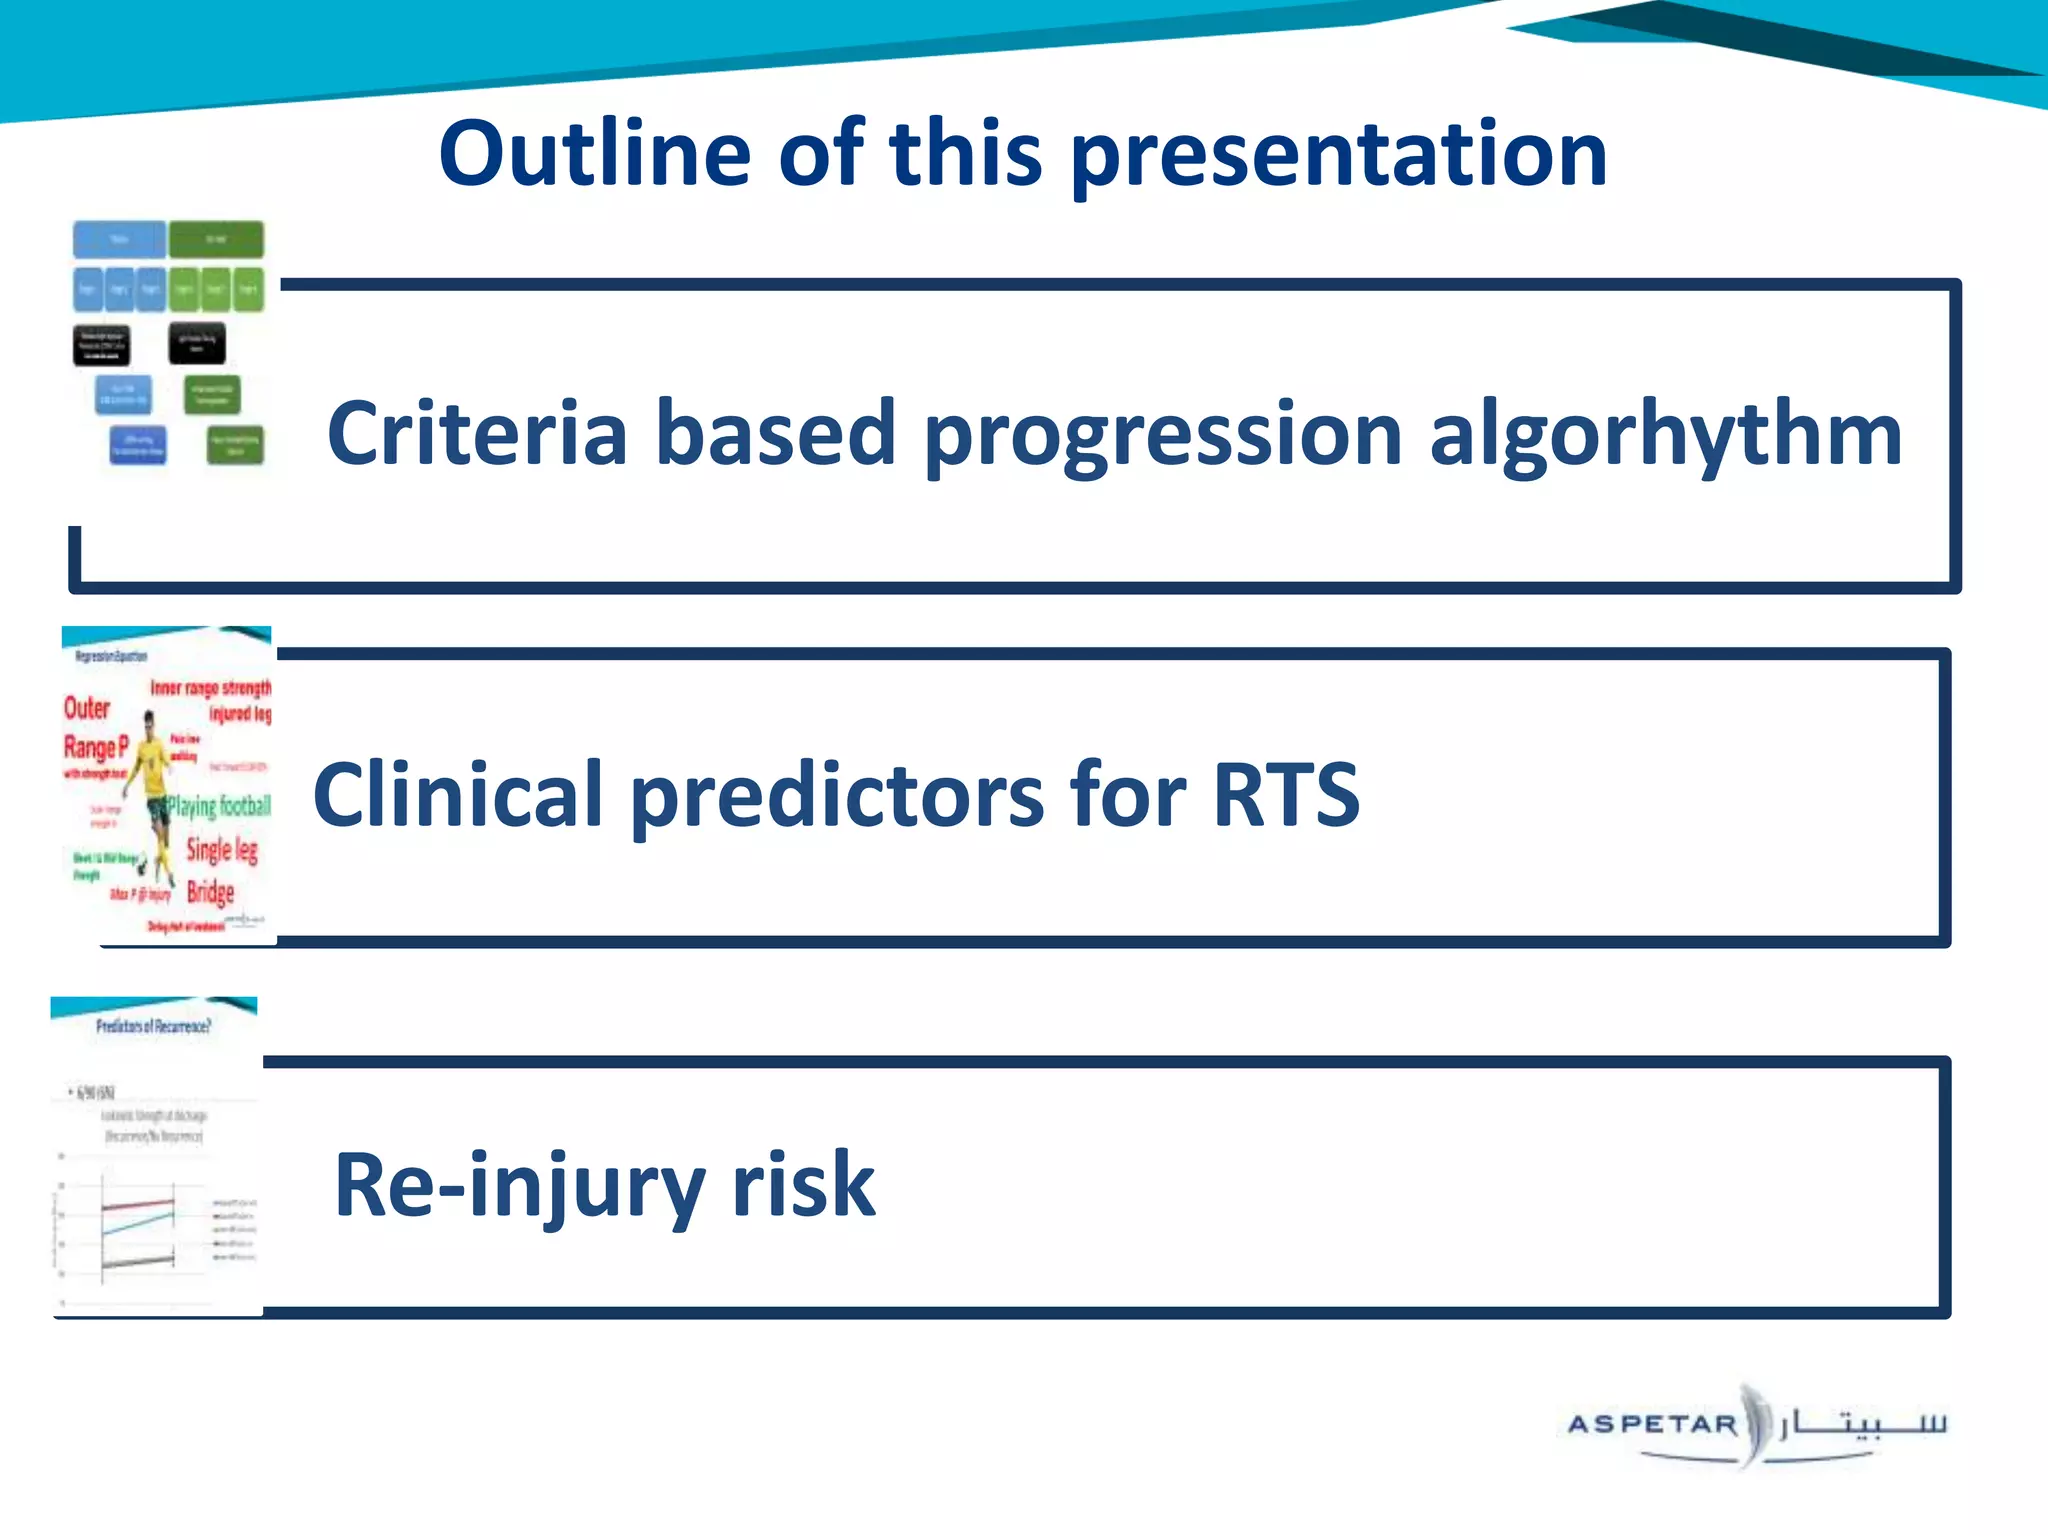


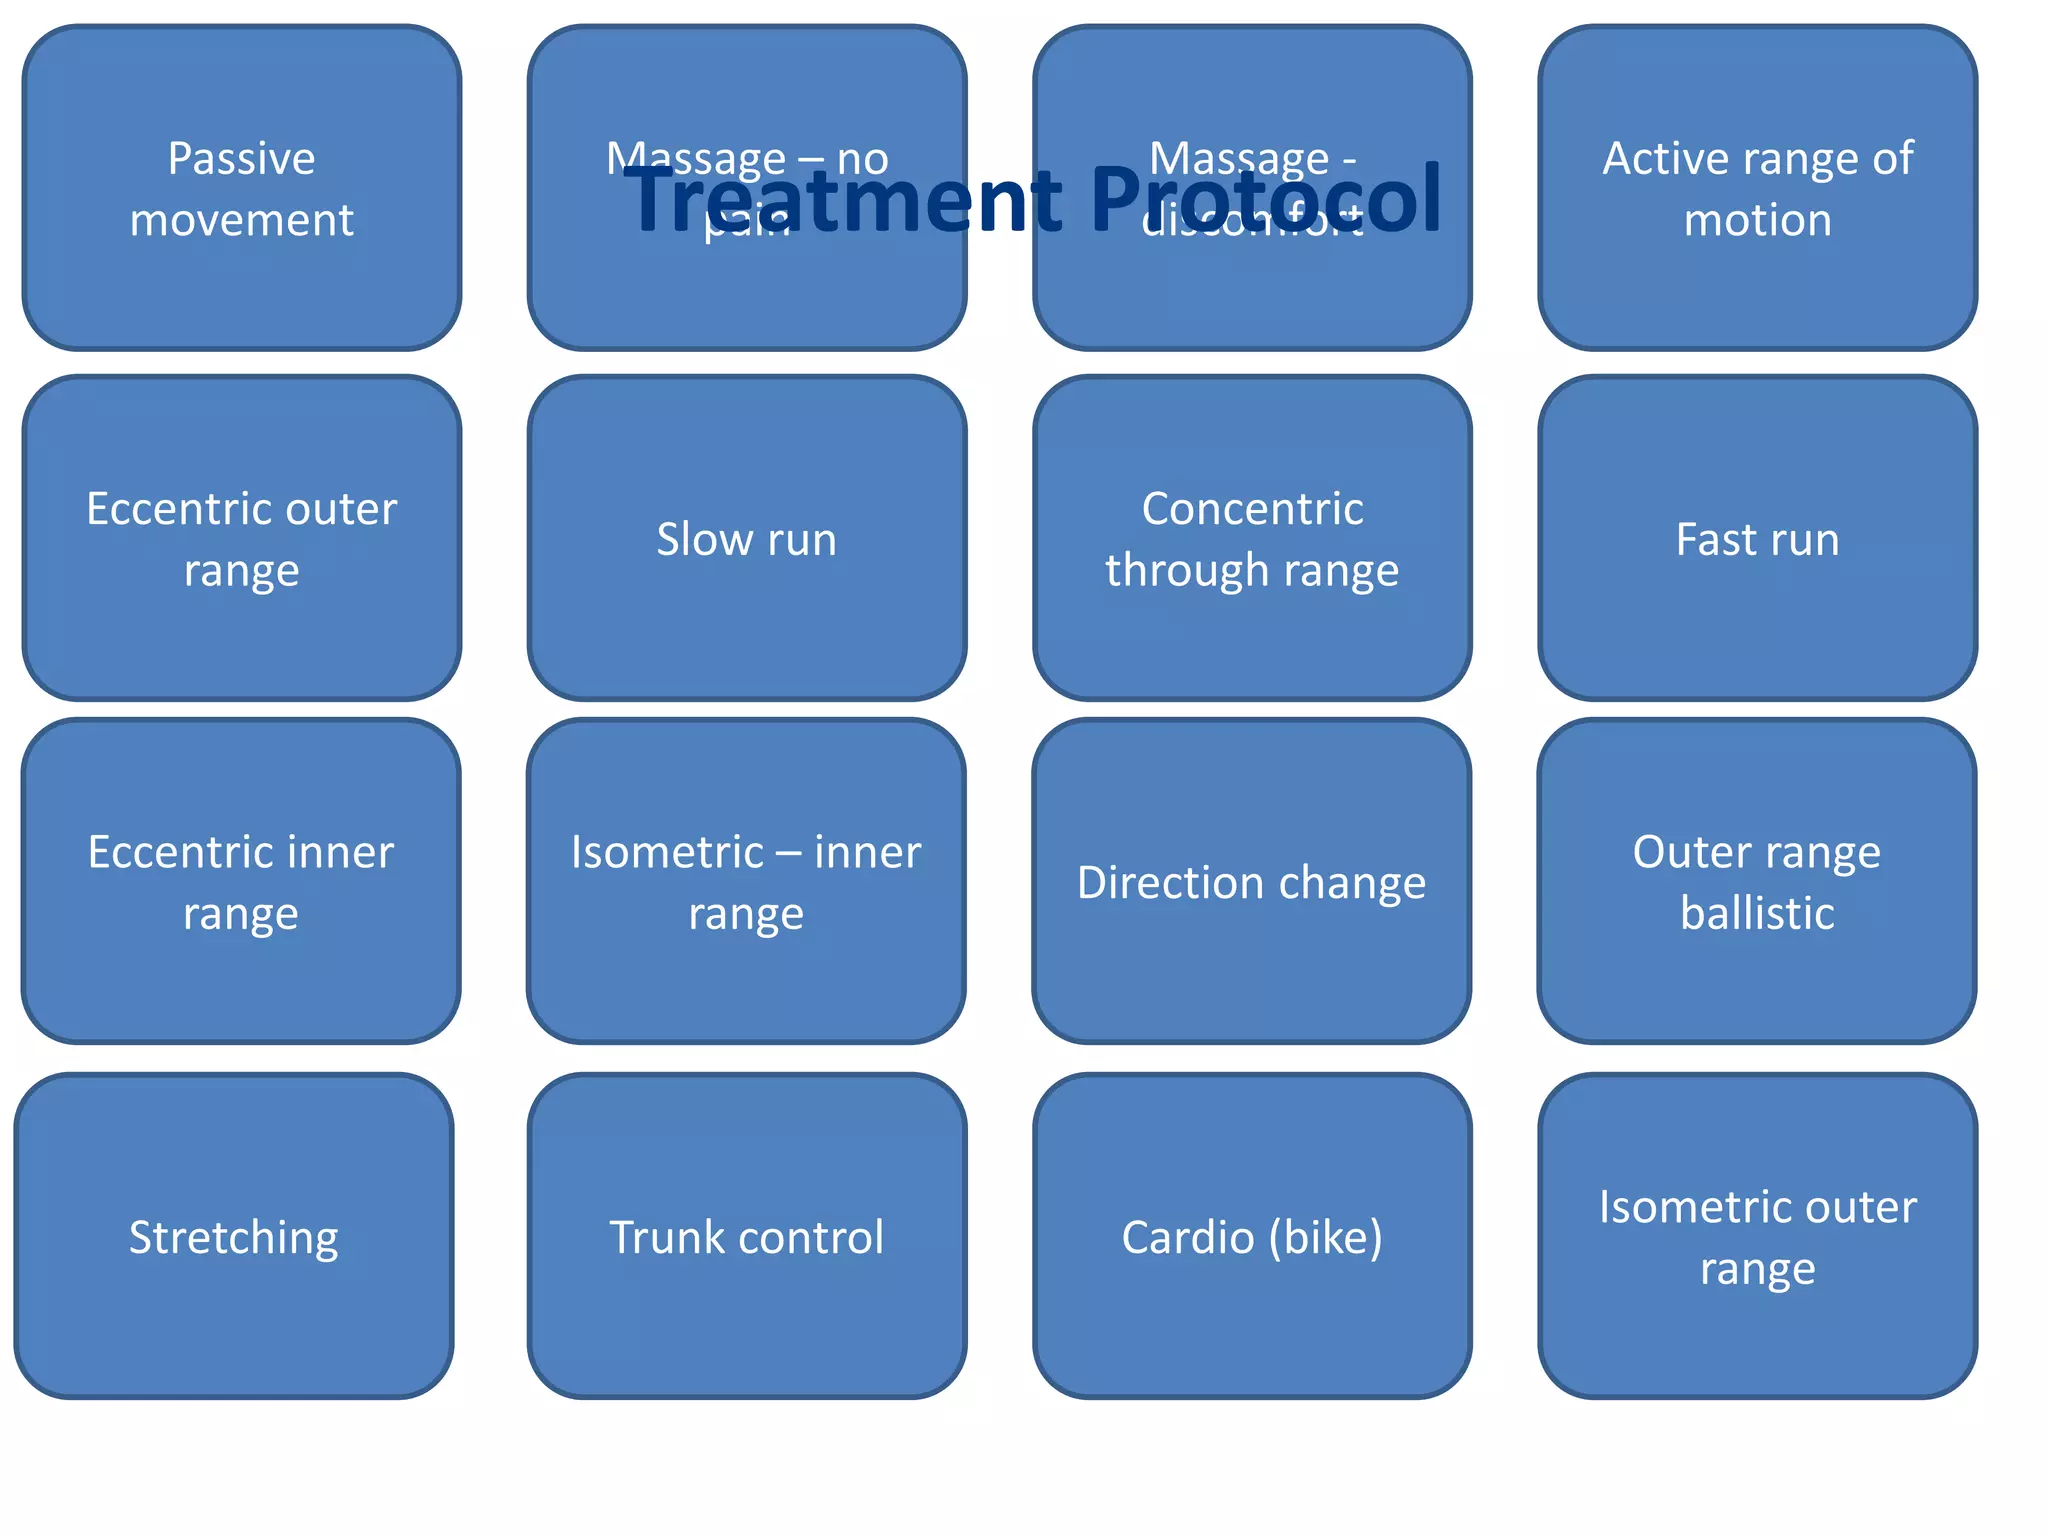

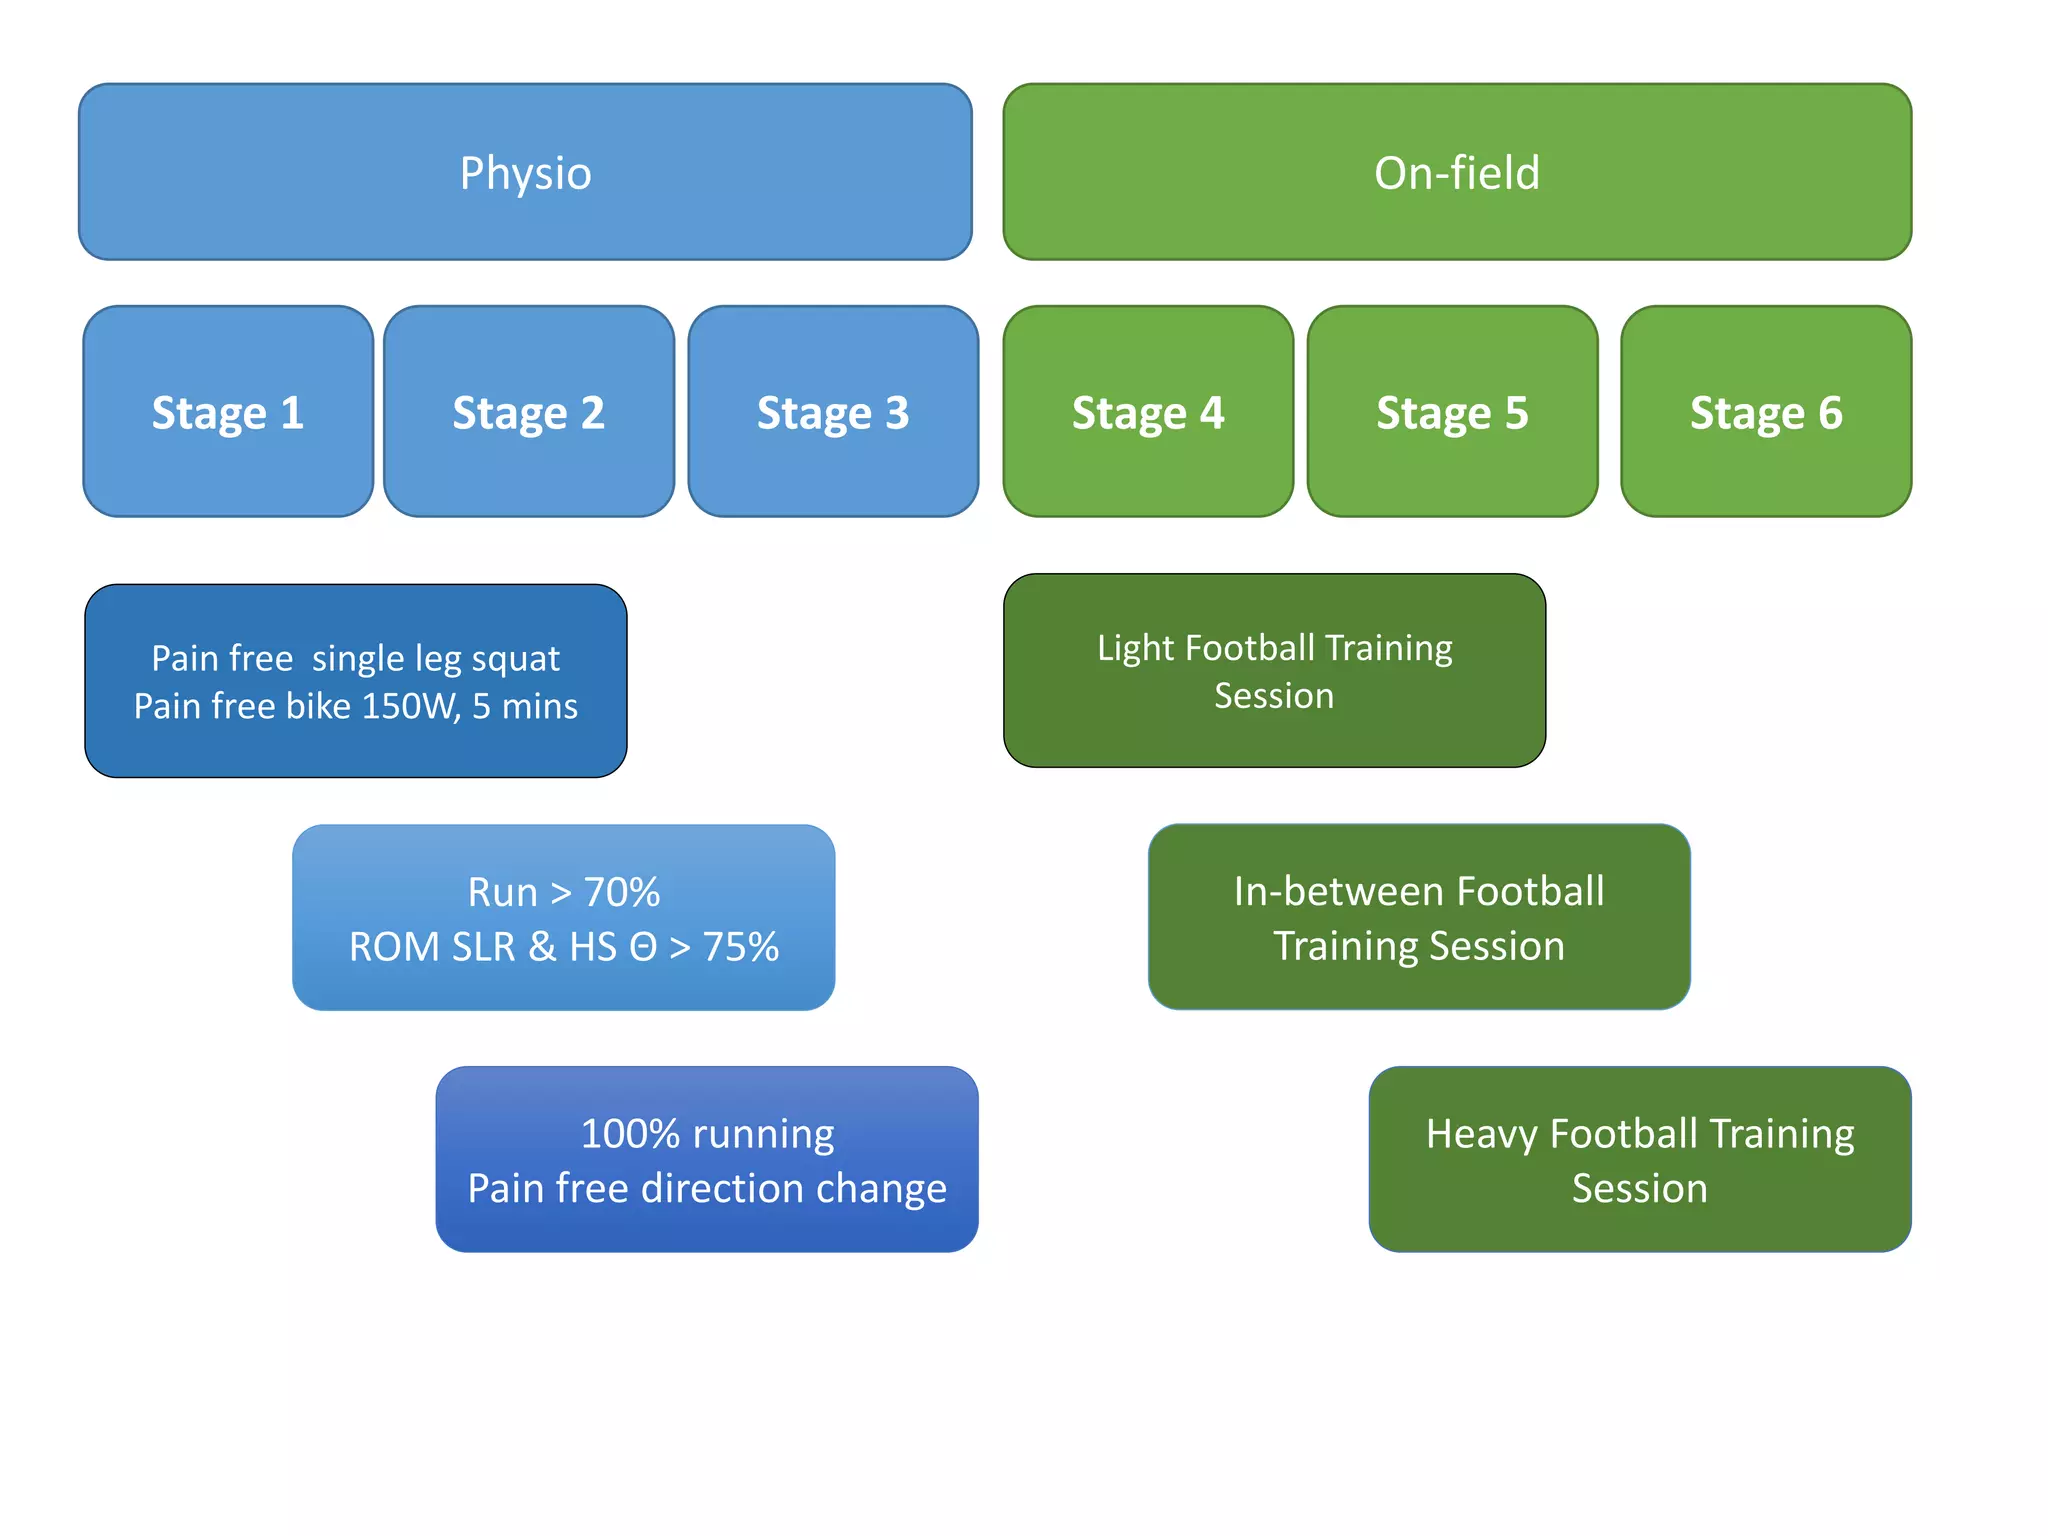


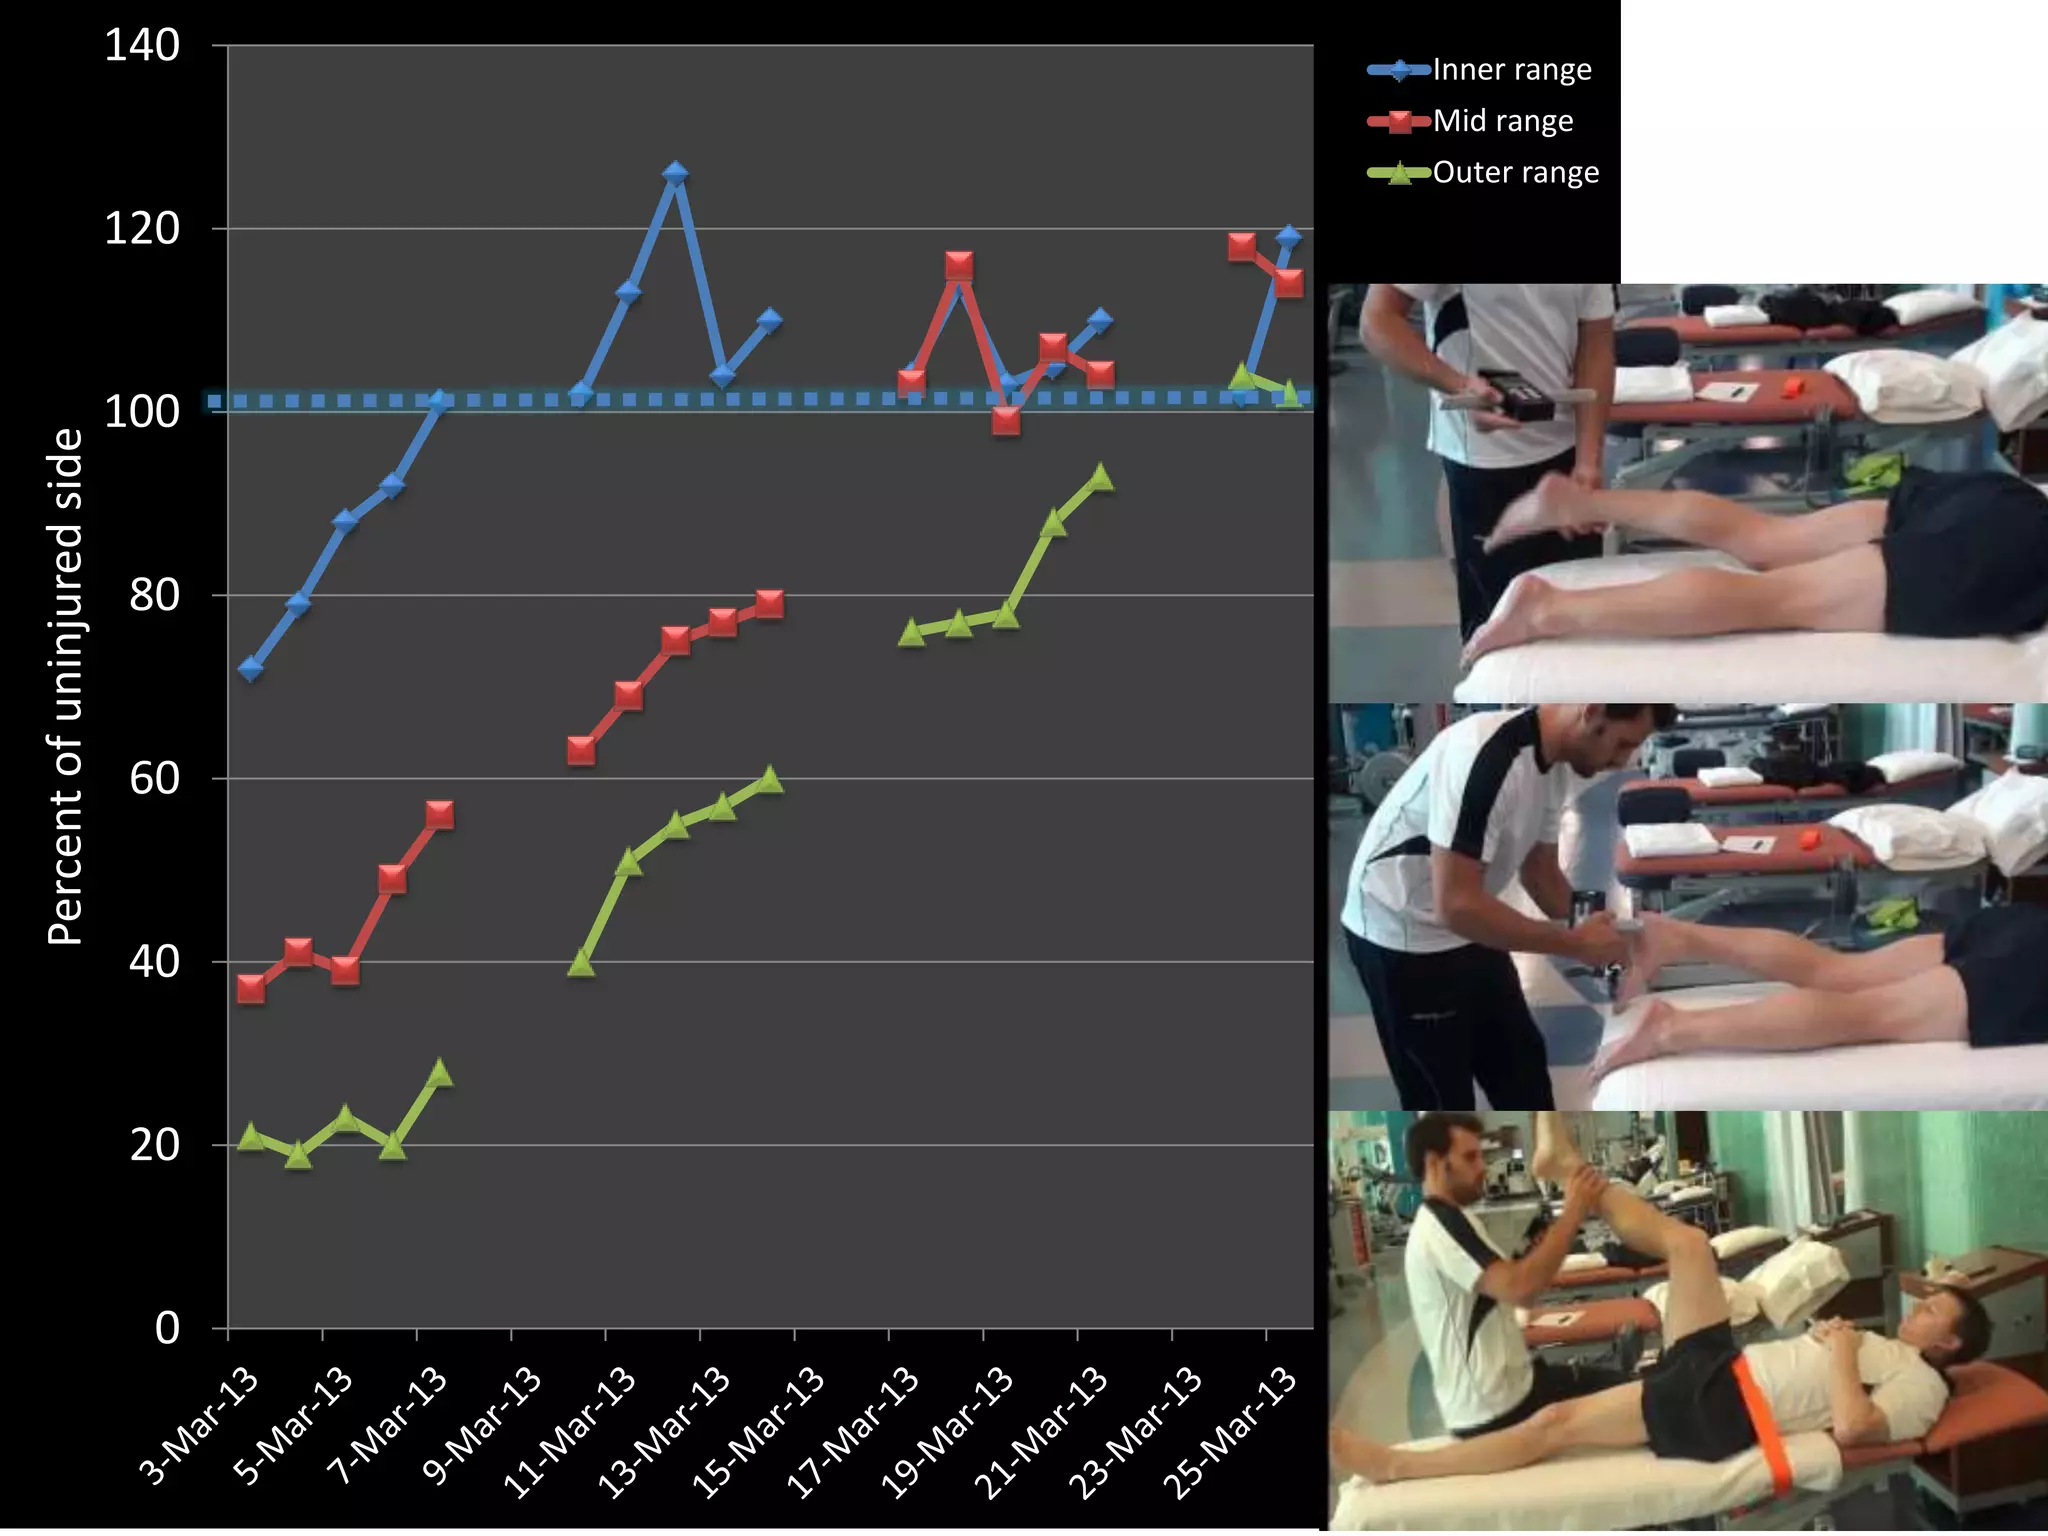


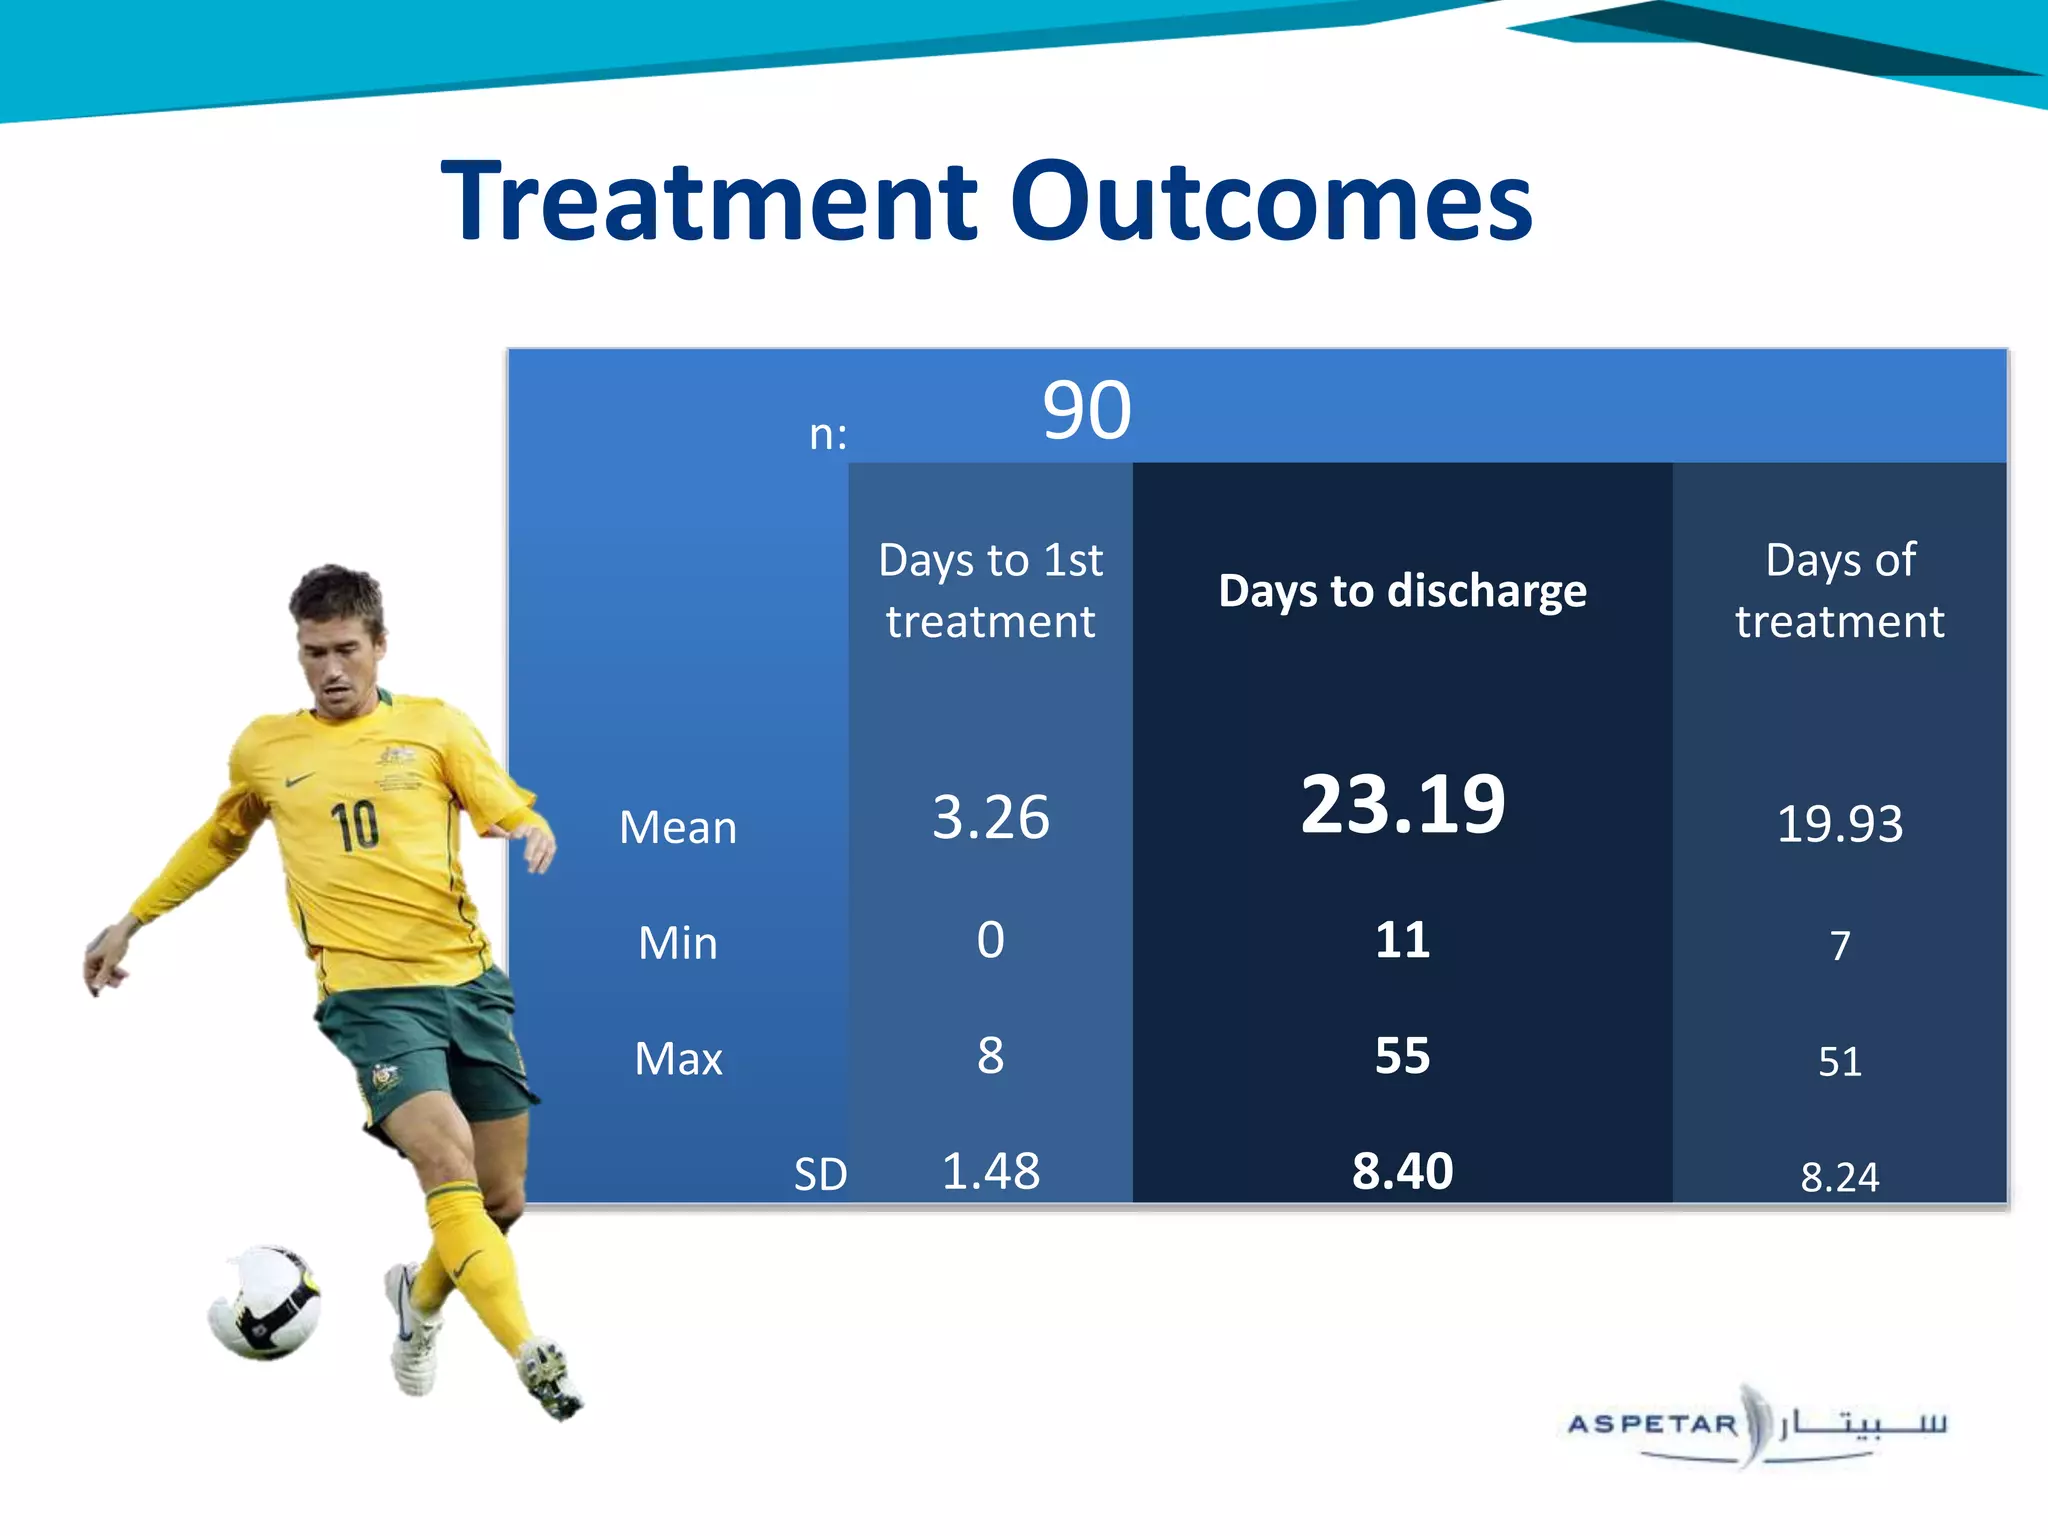


The document outlines a criteria-based rehabilitation protocol for hamstring strain injuries, highlighting the importance of clinical predictors for return to sport (RTS) and re-injury risk. It presents a detailed assessment and treatment protocol, emphasizing the progression through various stages of rehabilitation while measuring specific strength and mobility milestones. The results from the study indicate that early treatment and careful monitoring of pain and strength may reduce recurrence rates in athletes.


