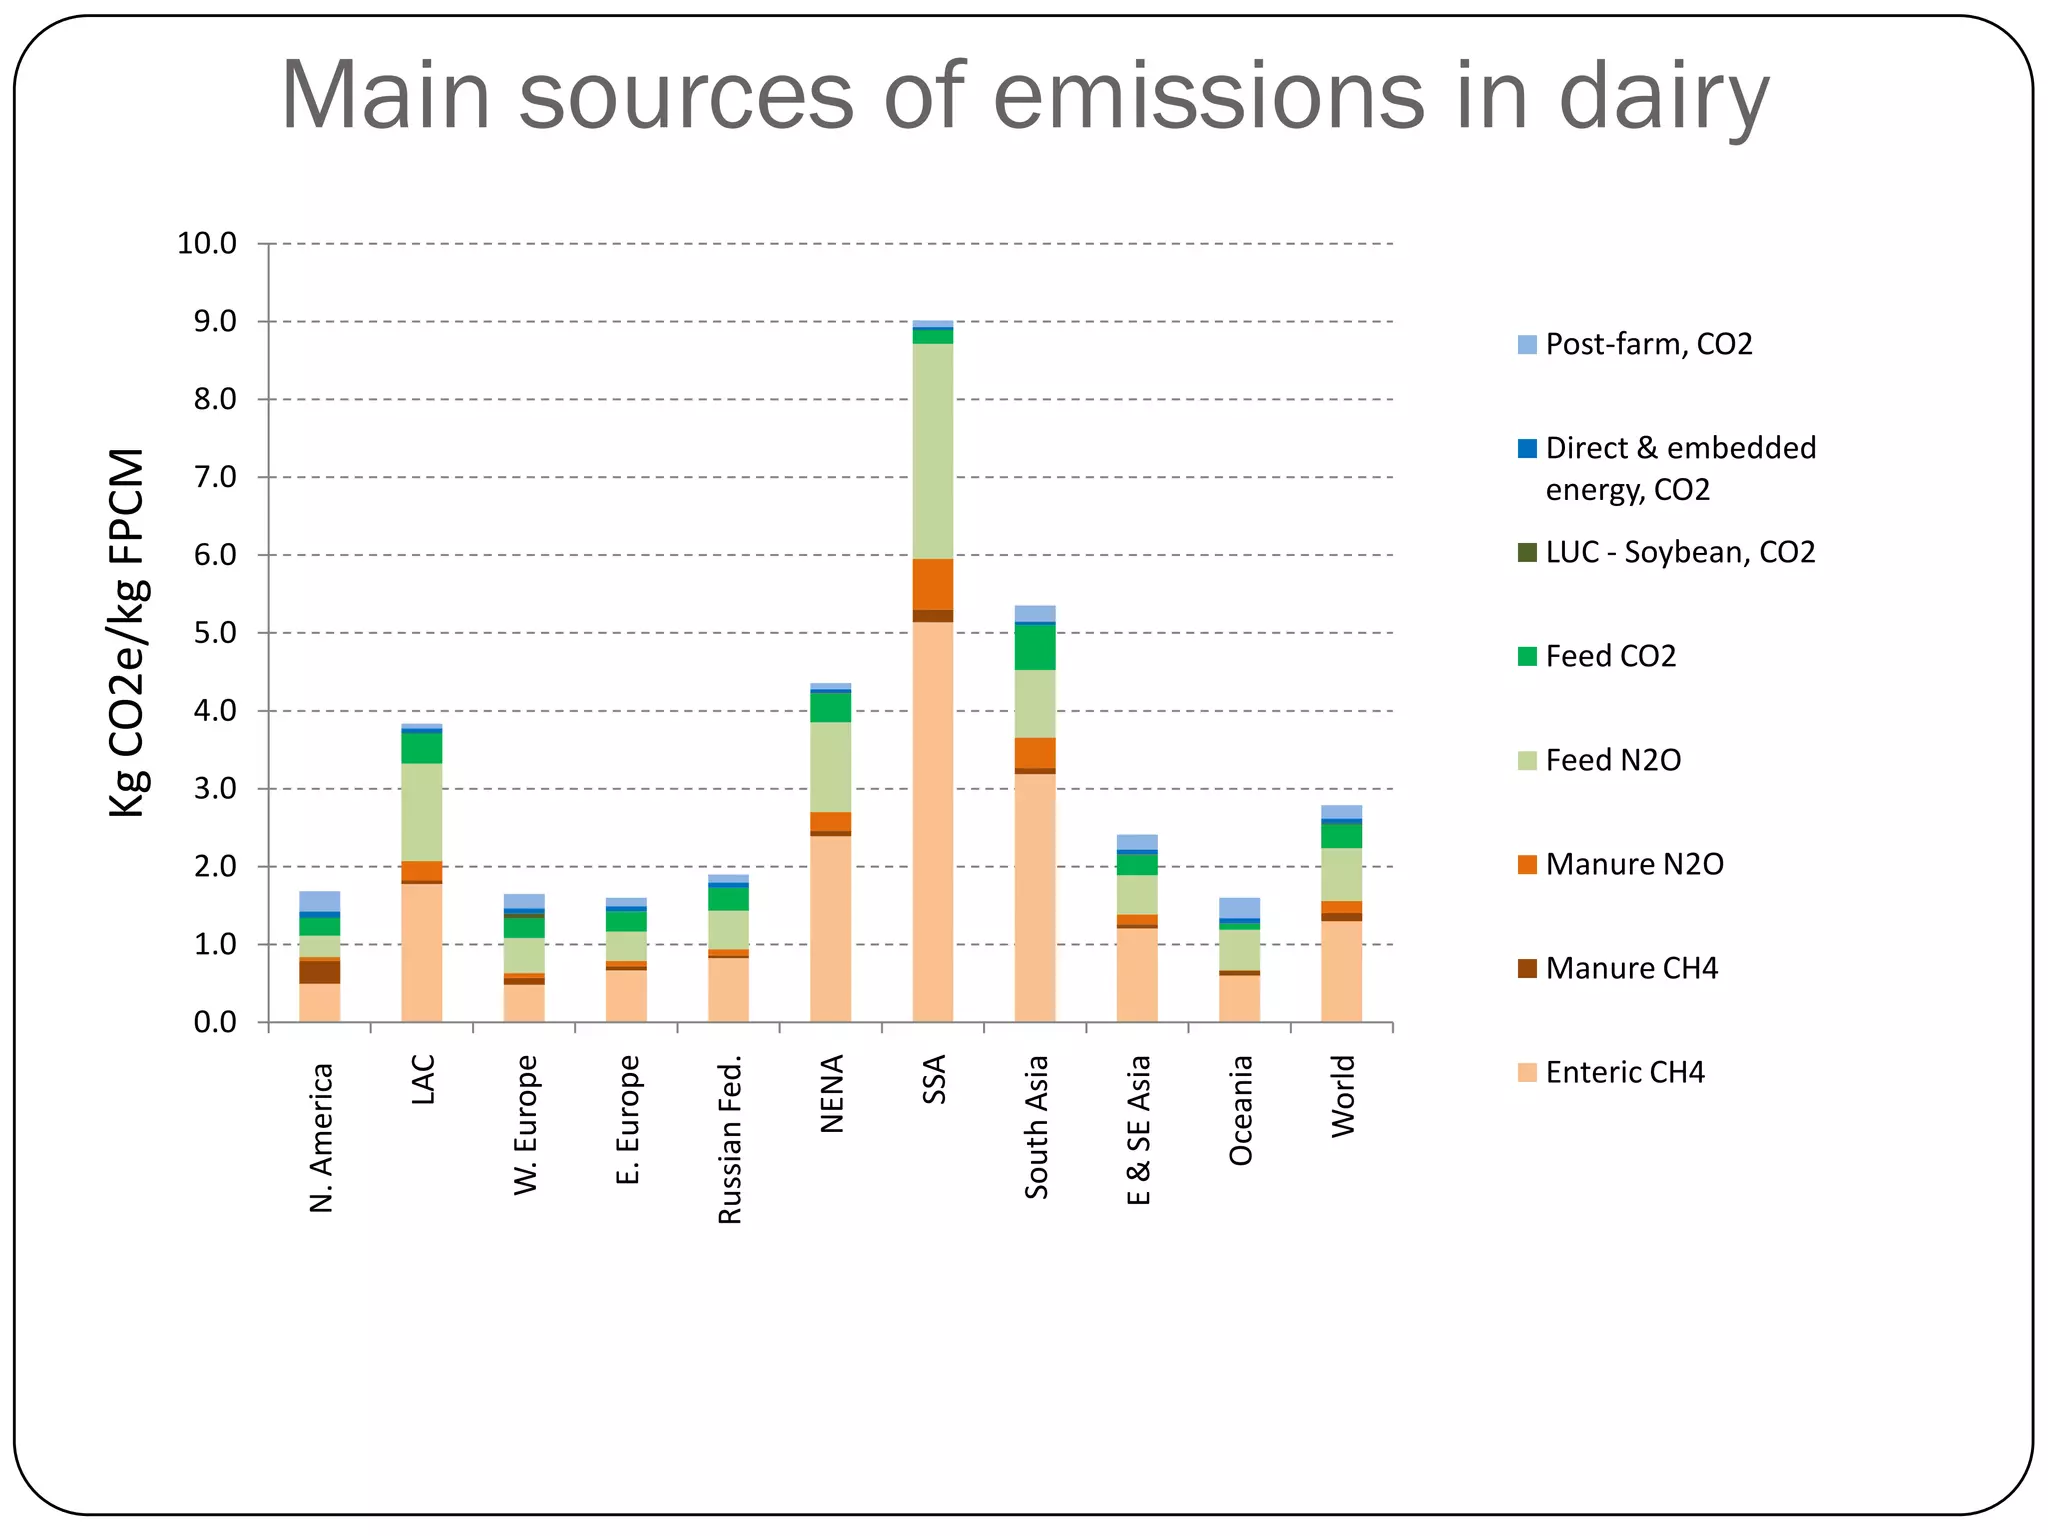
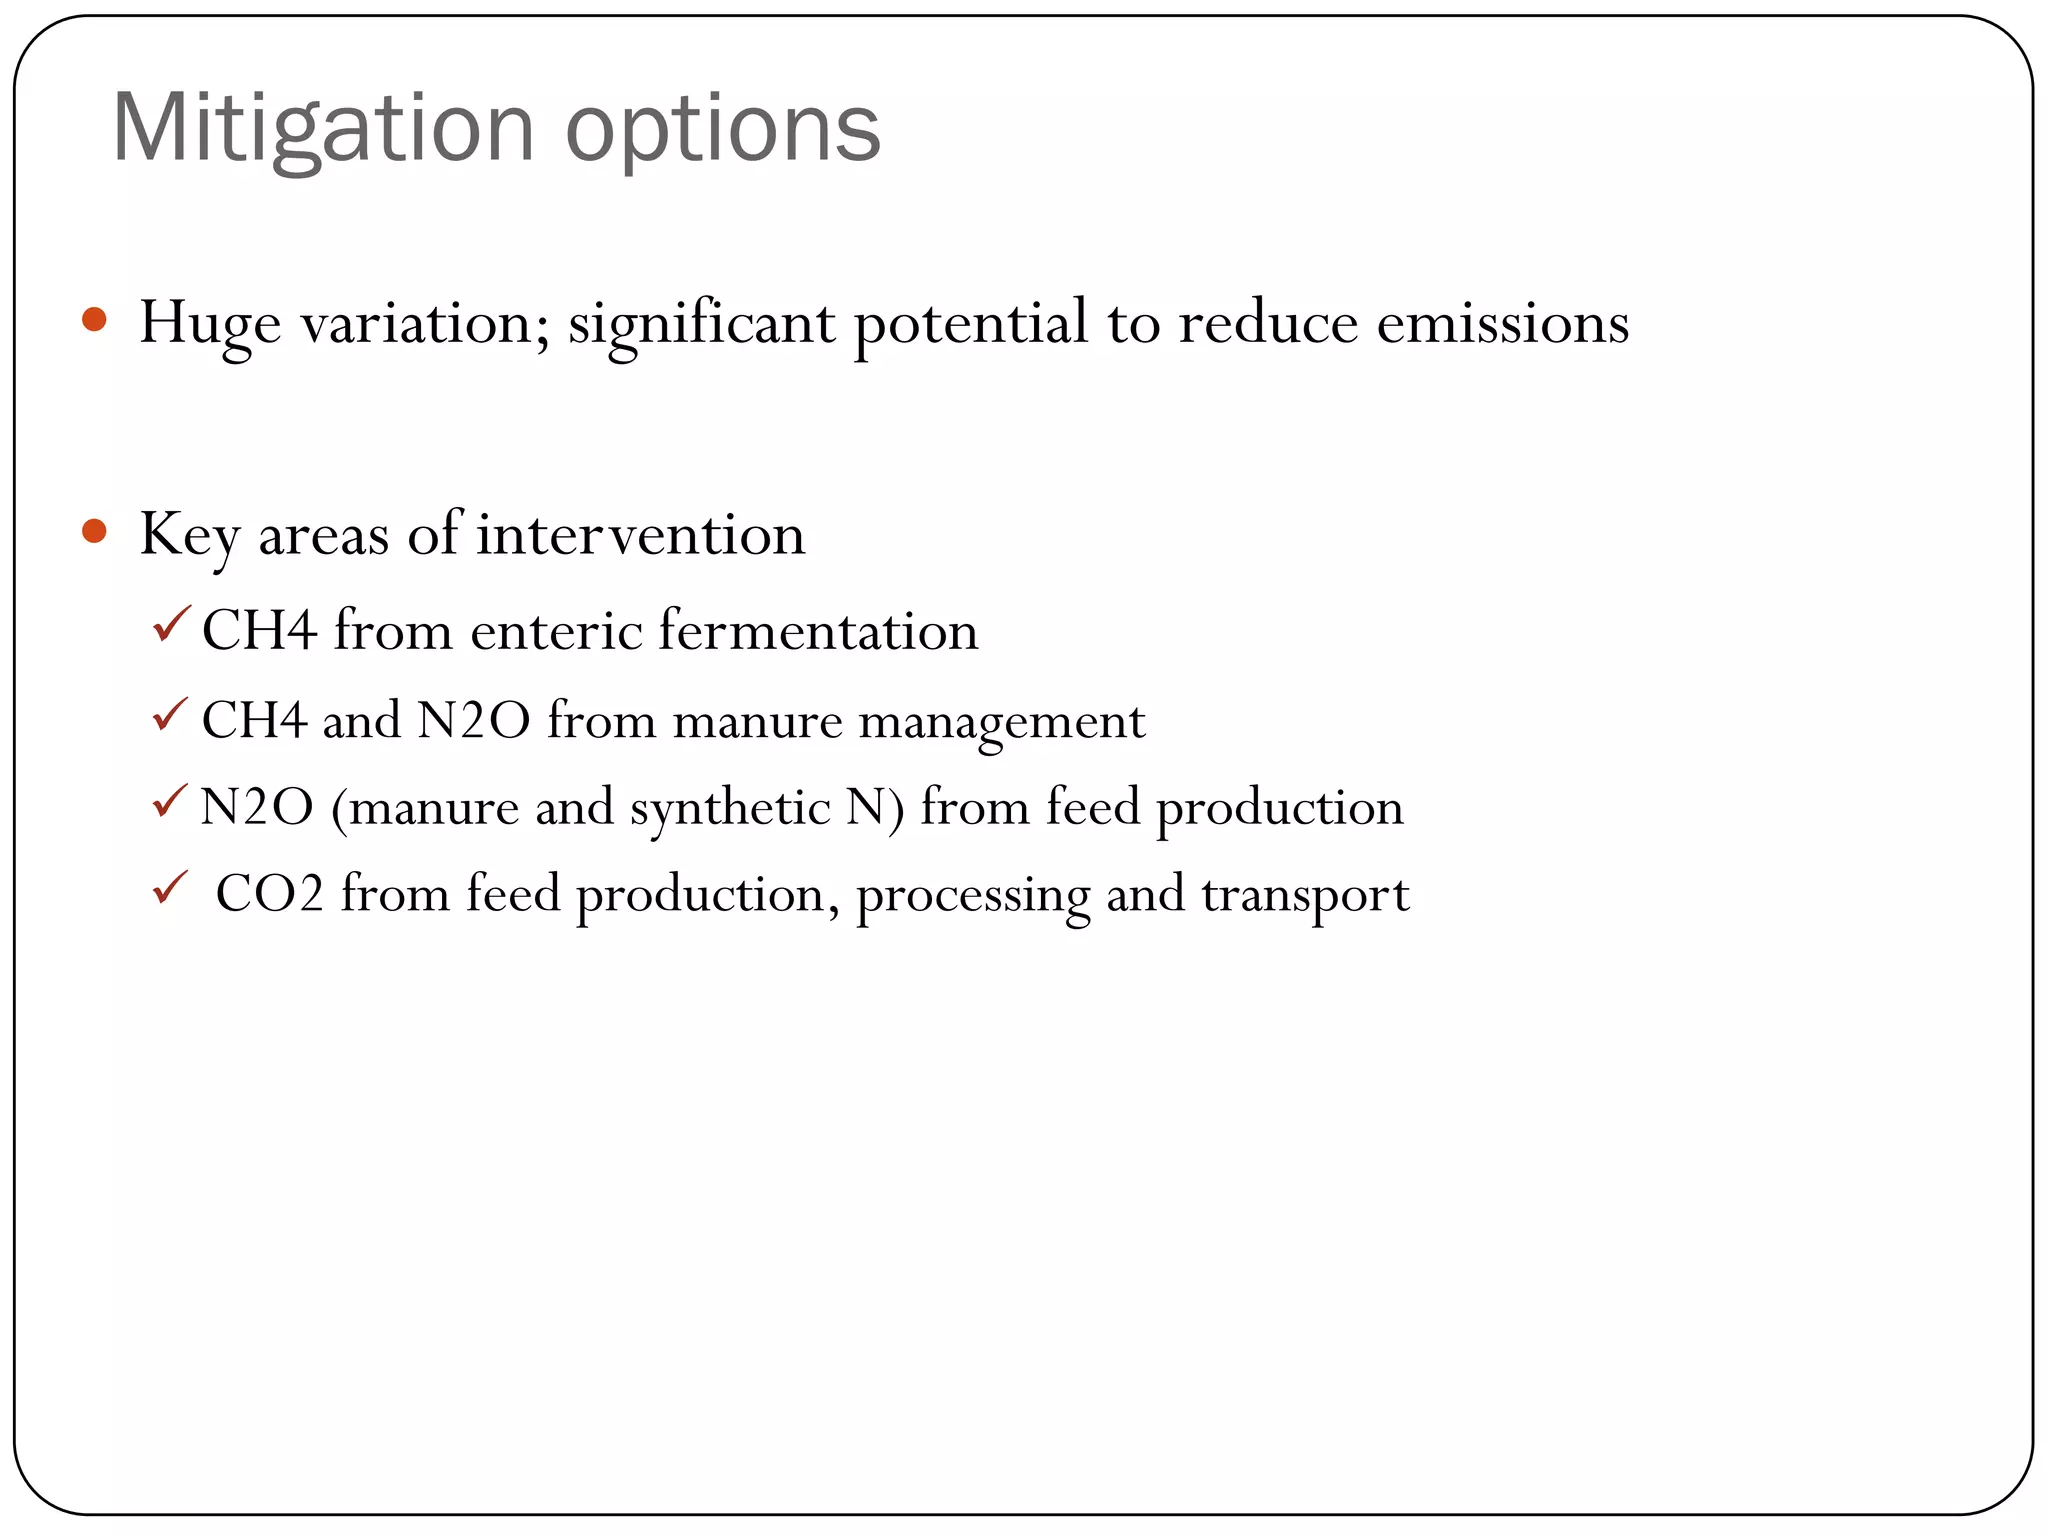
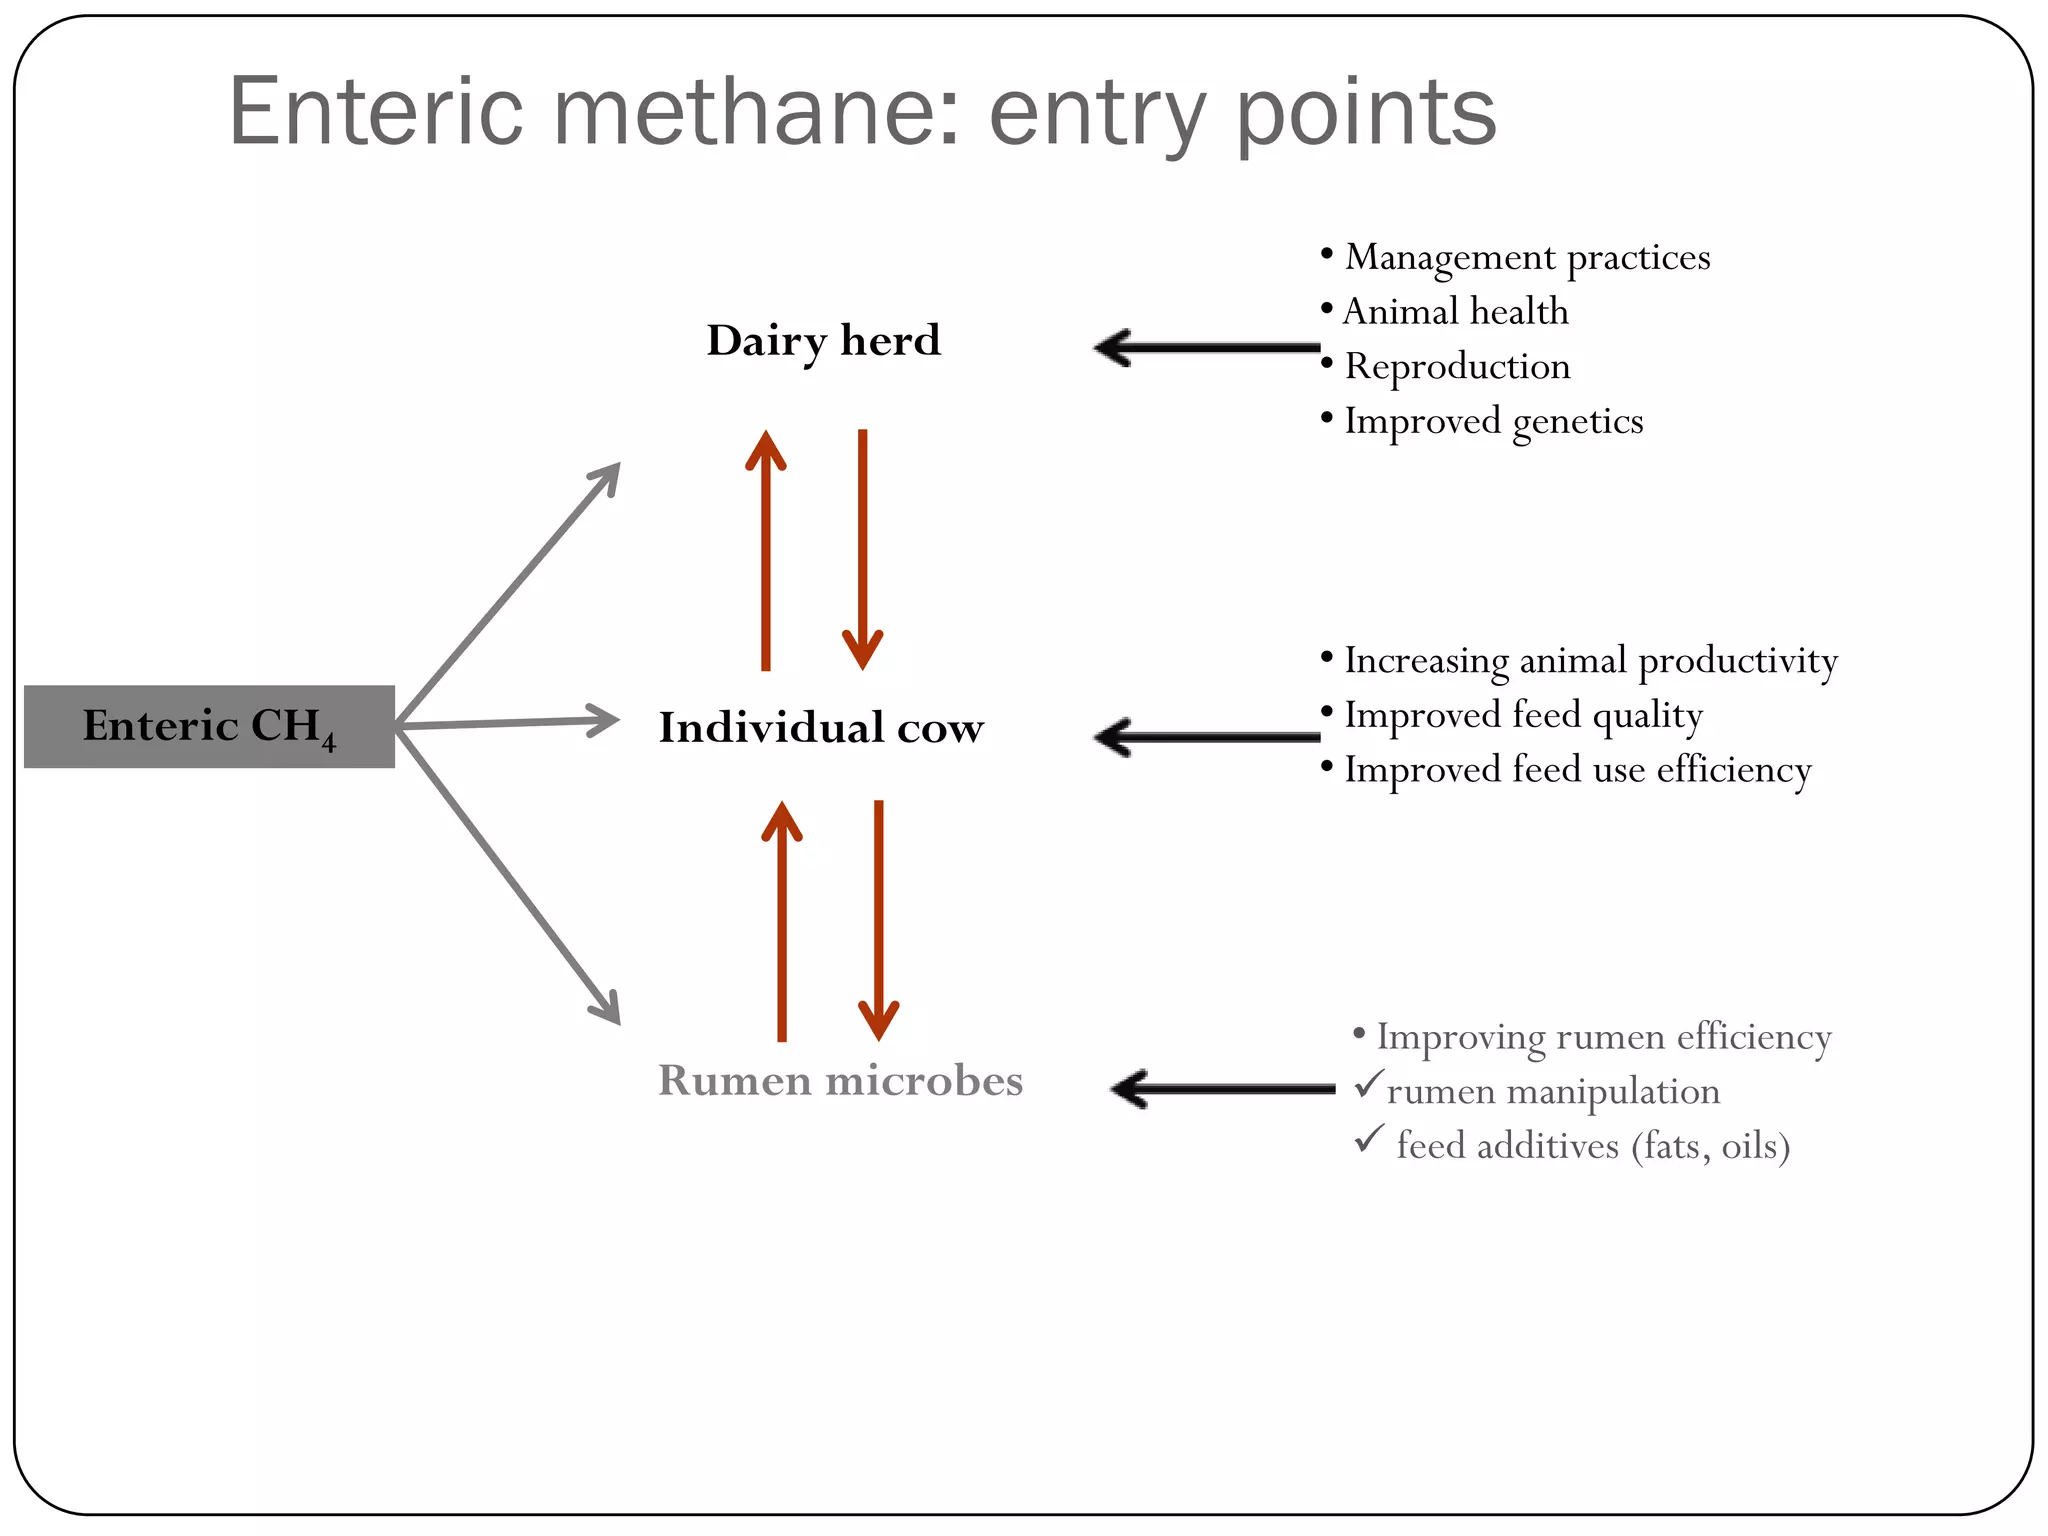
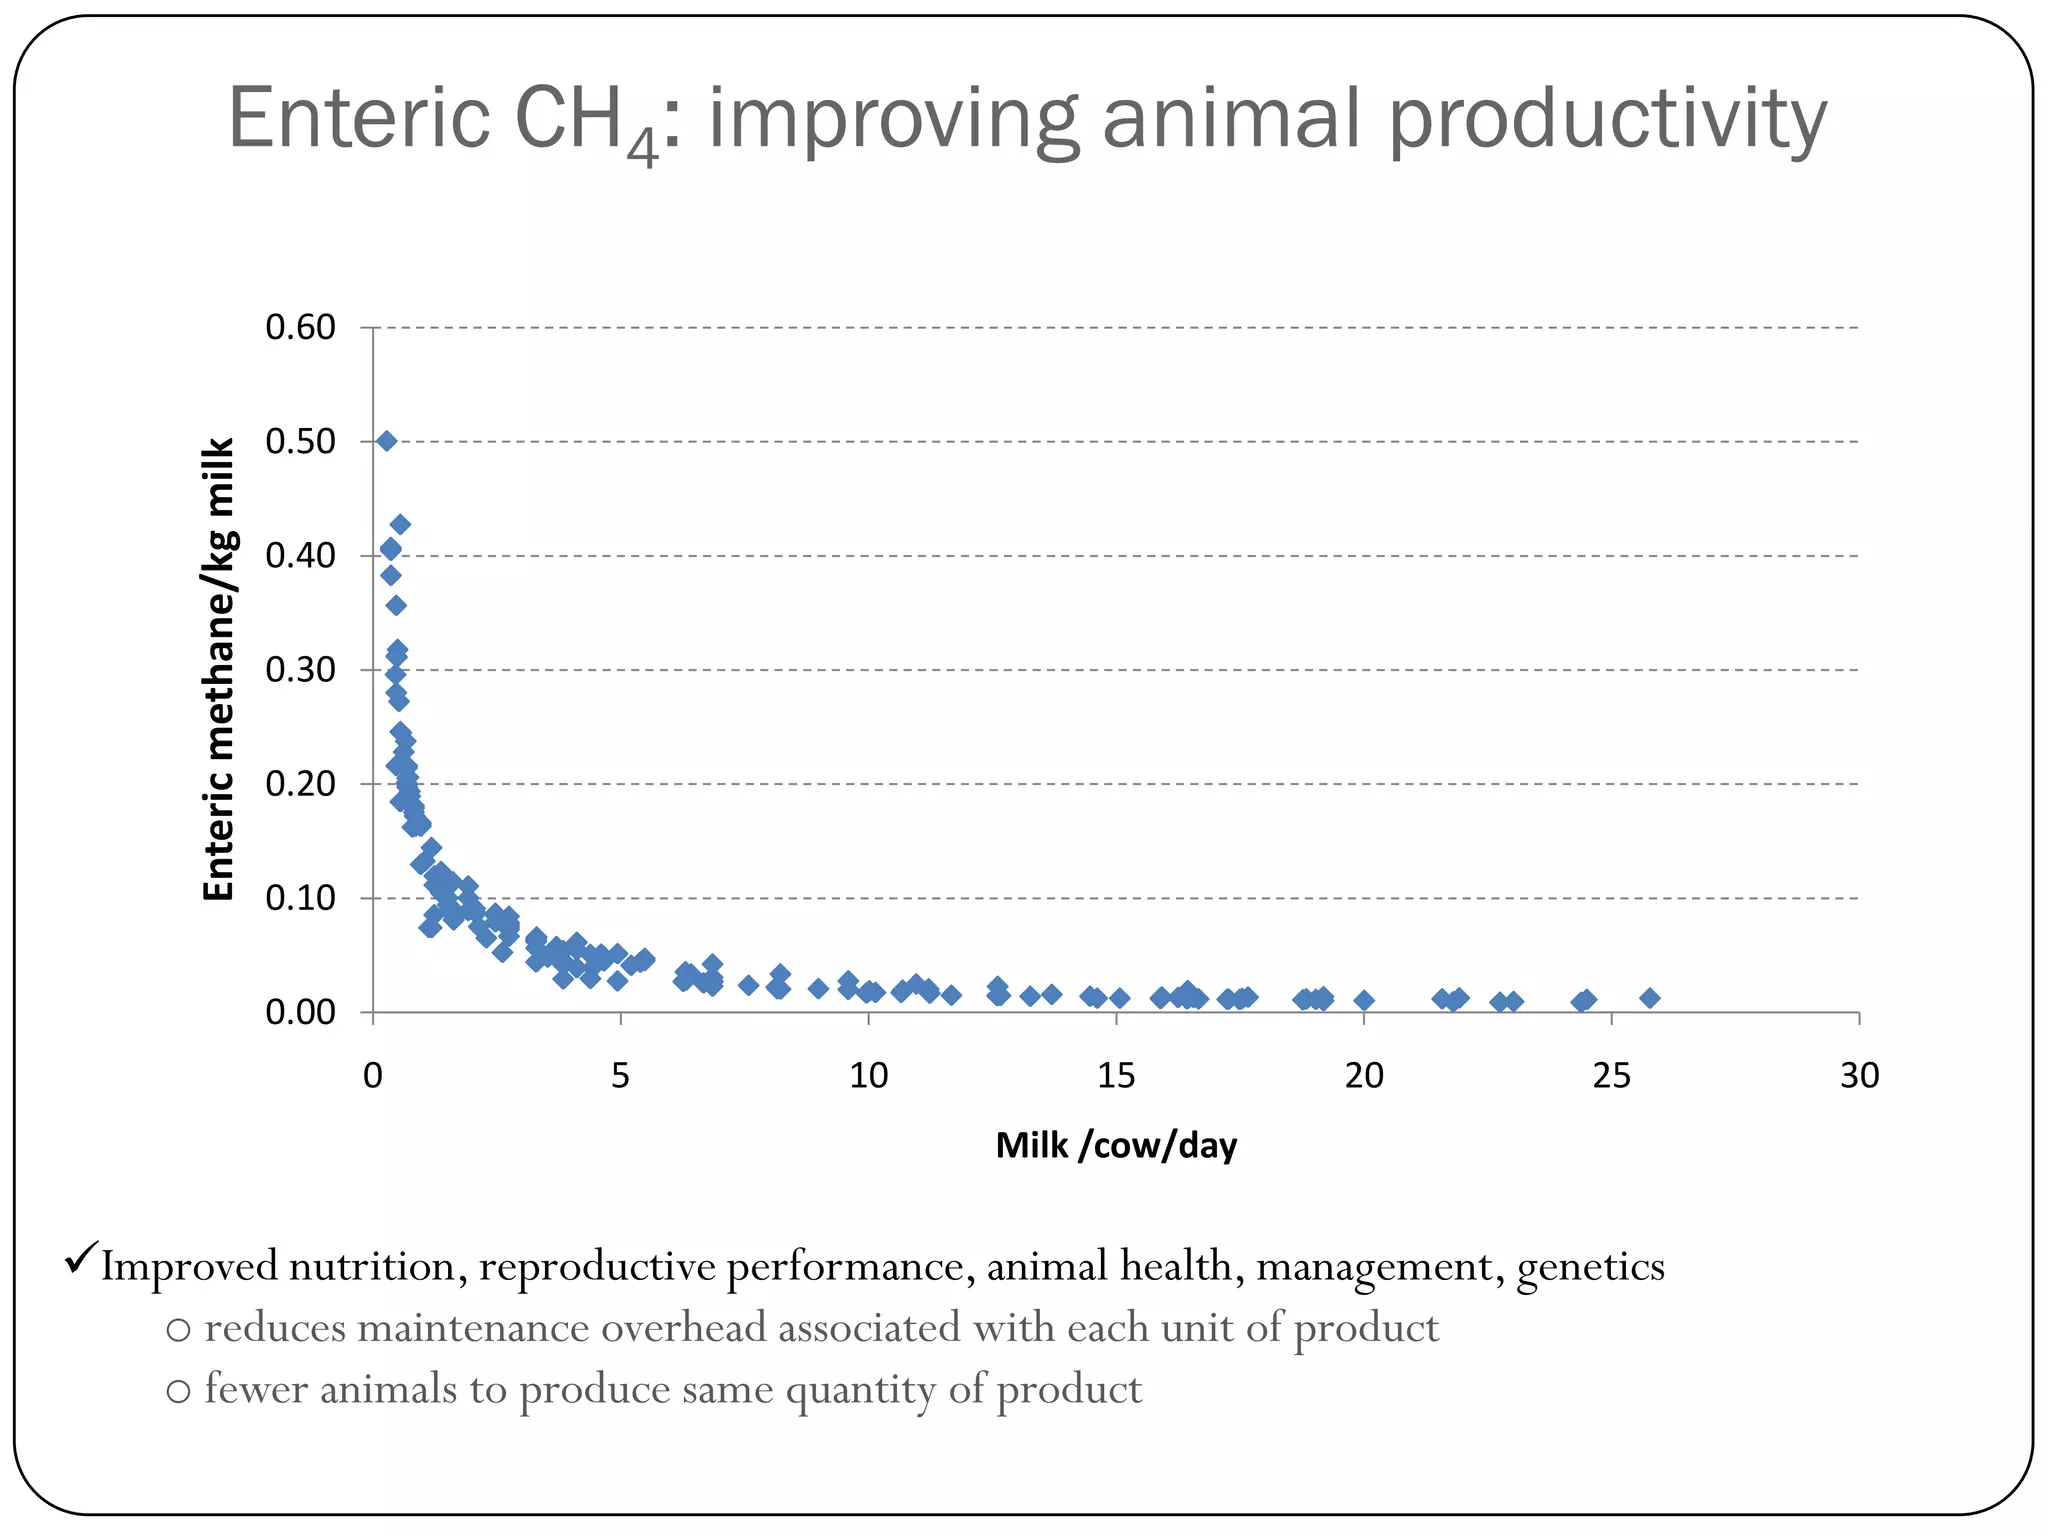
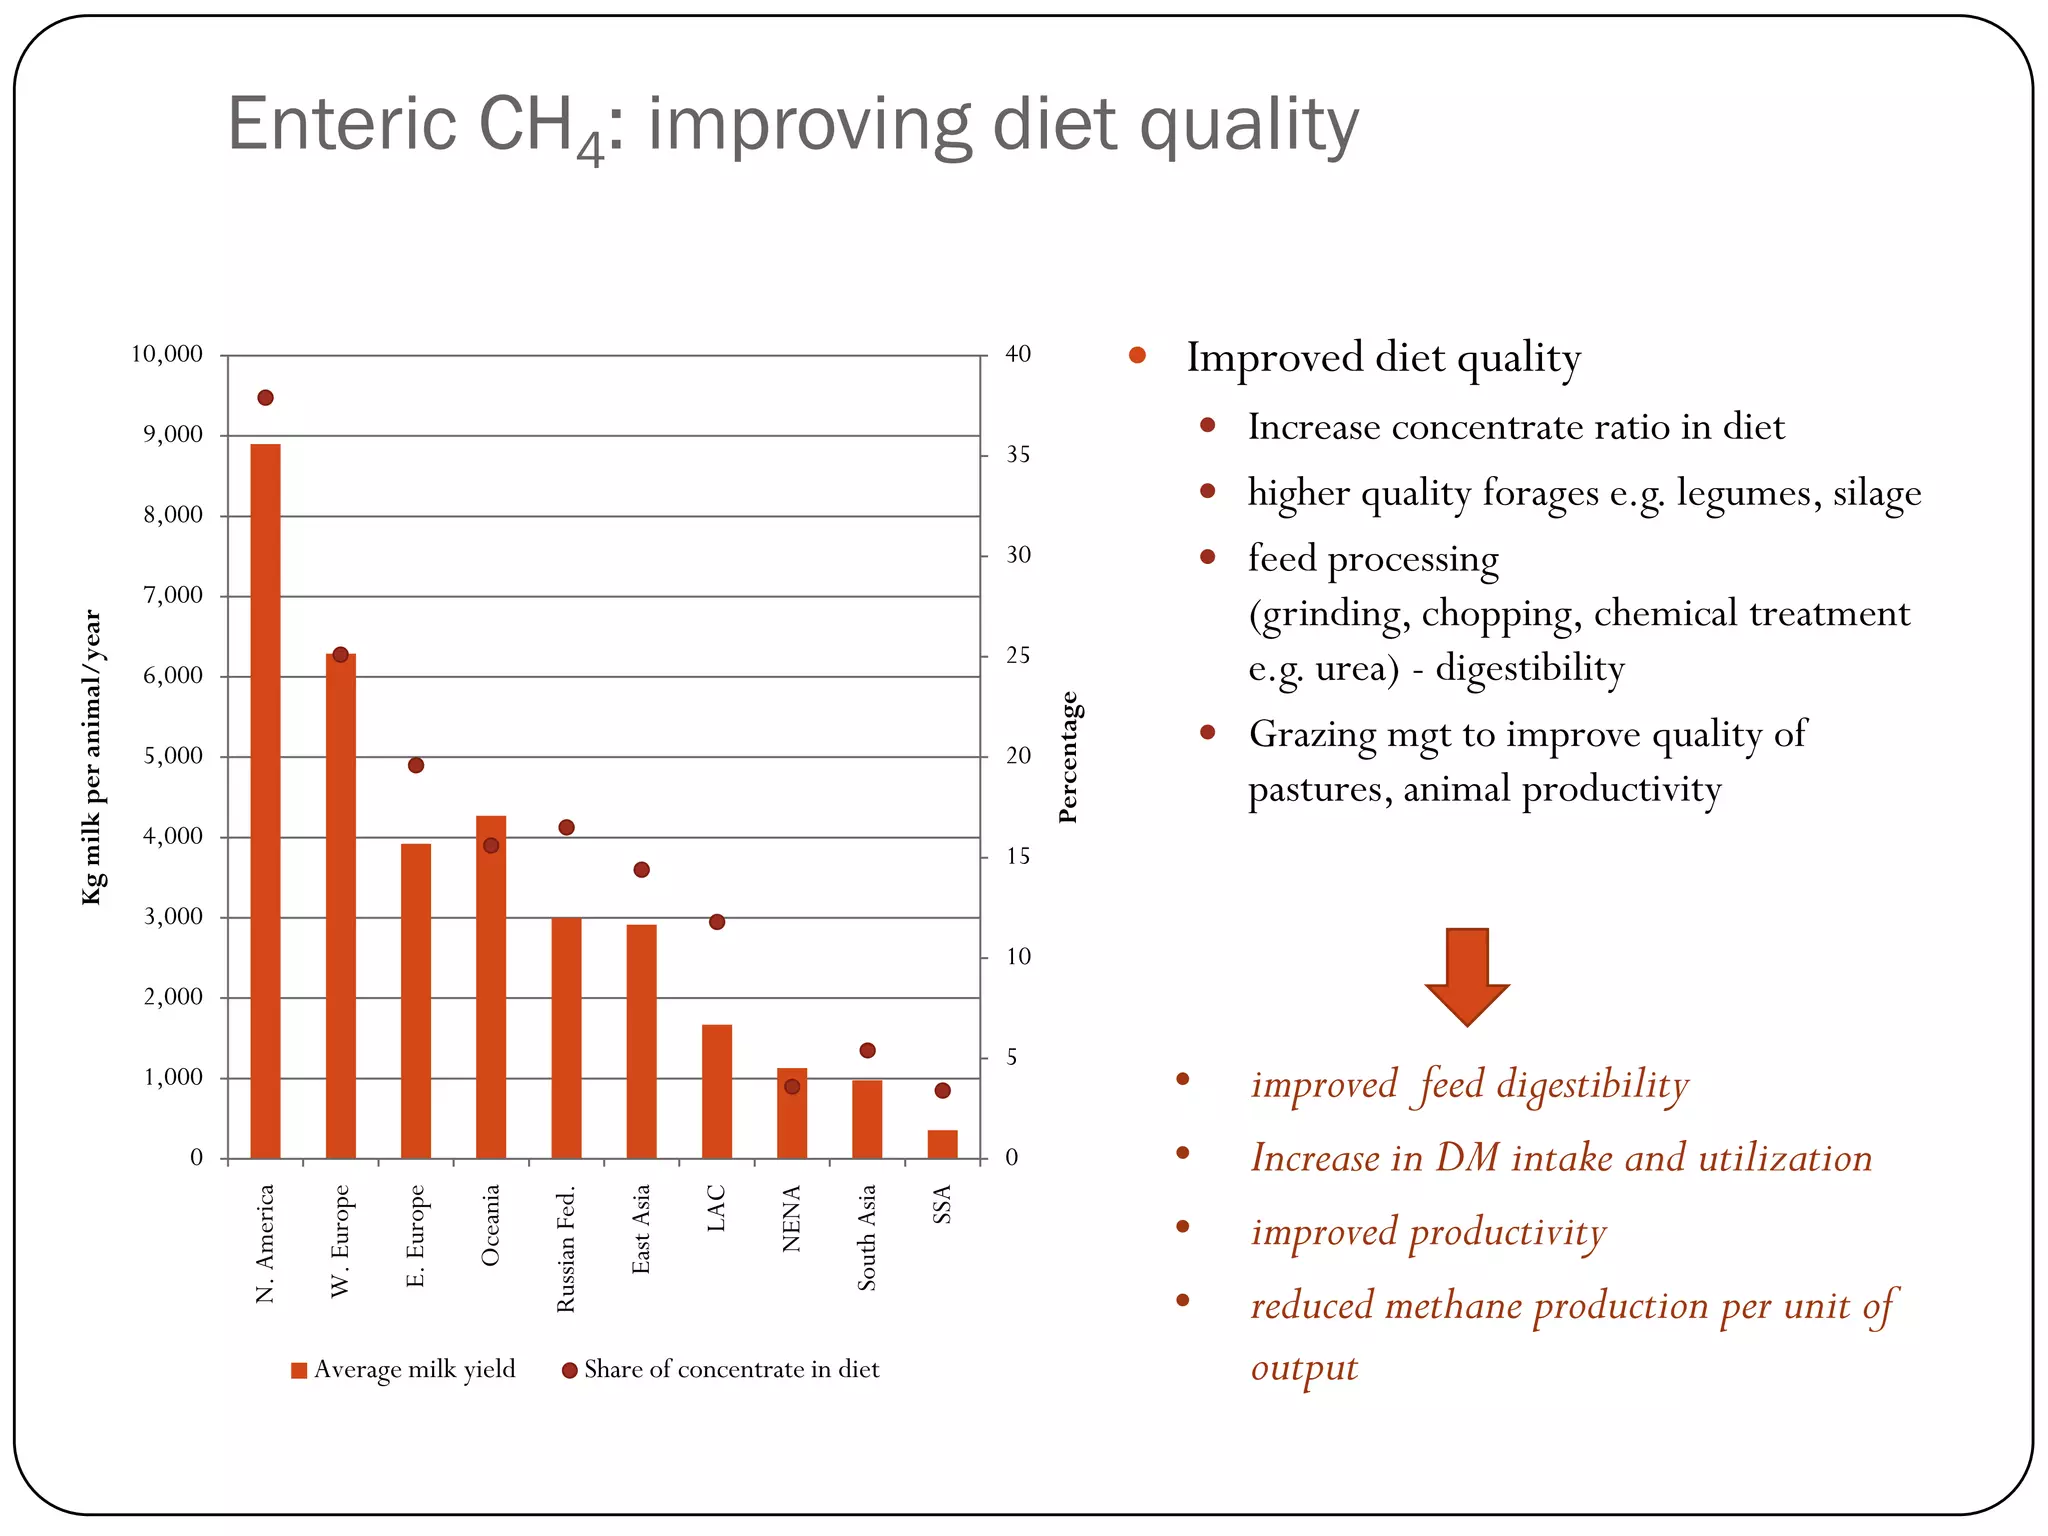
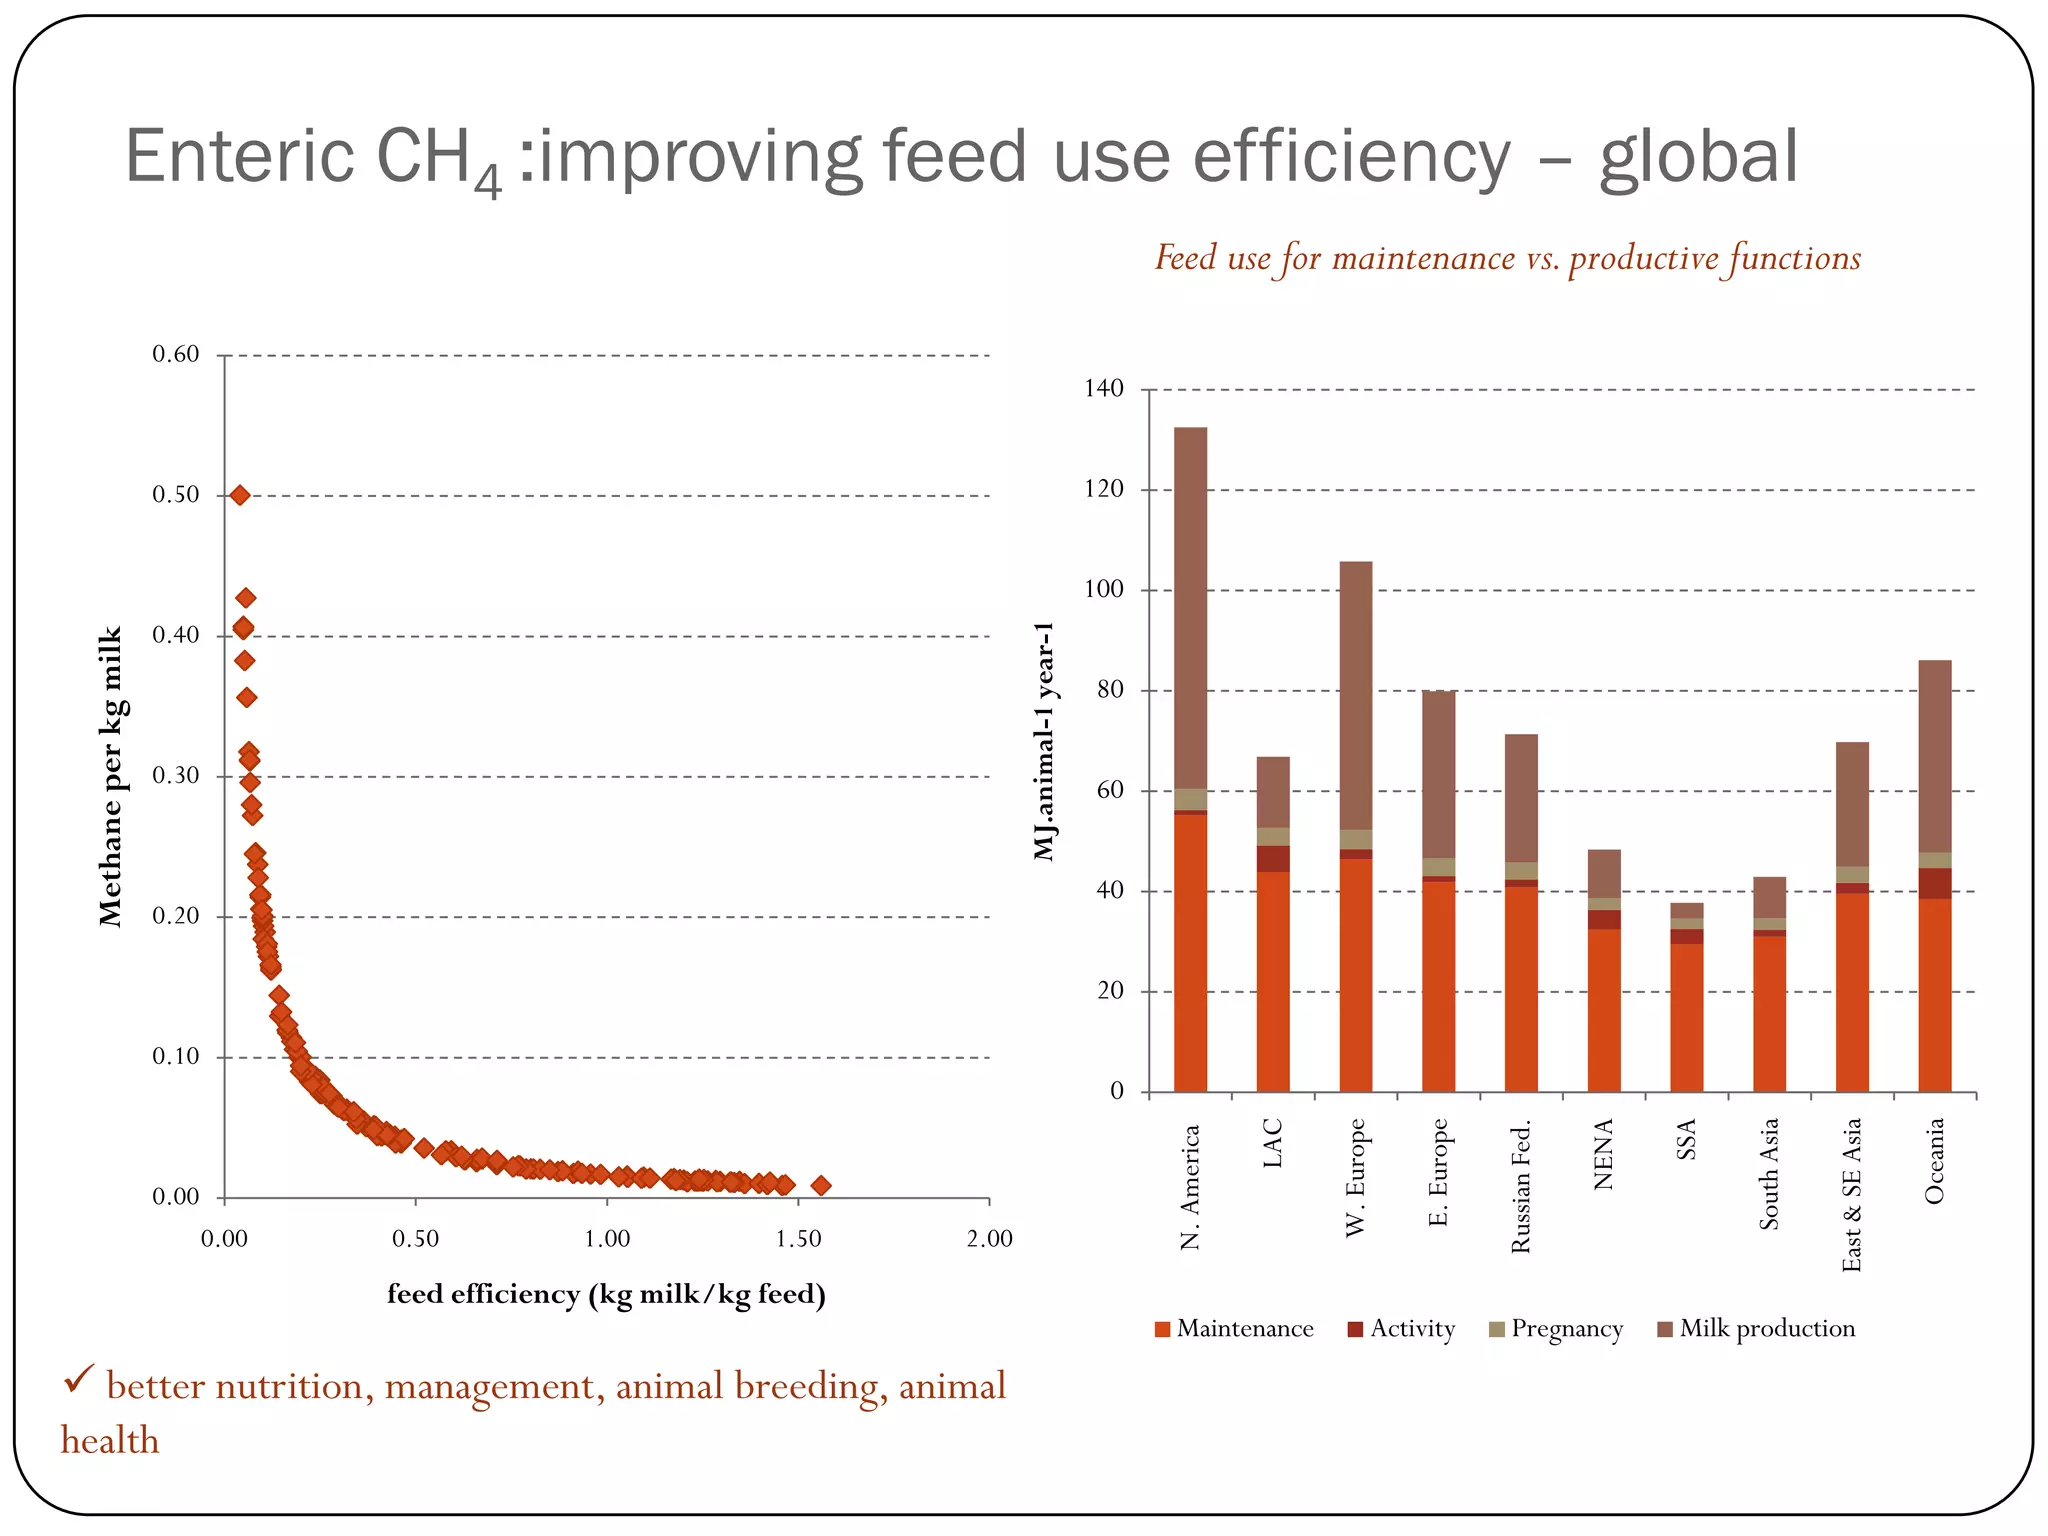
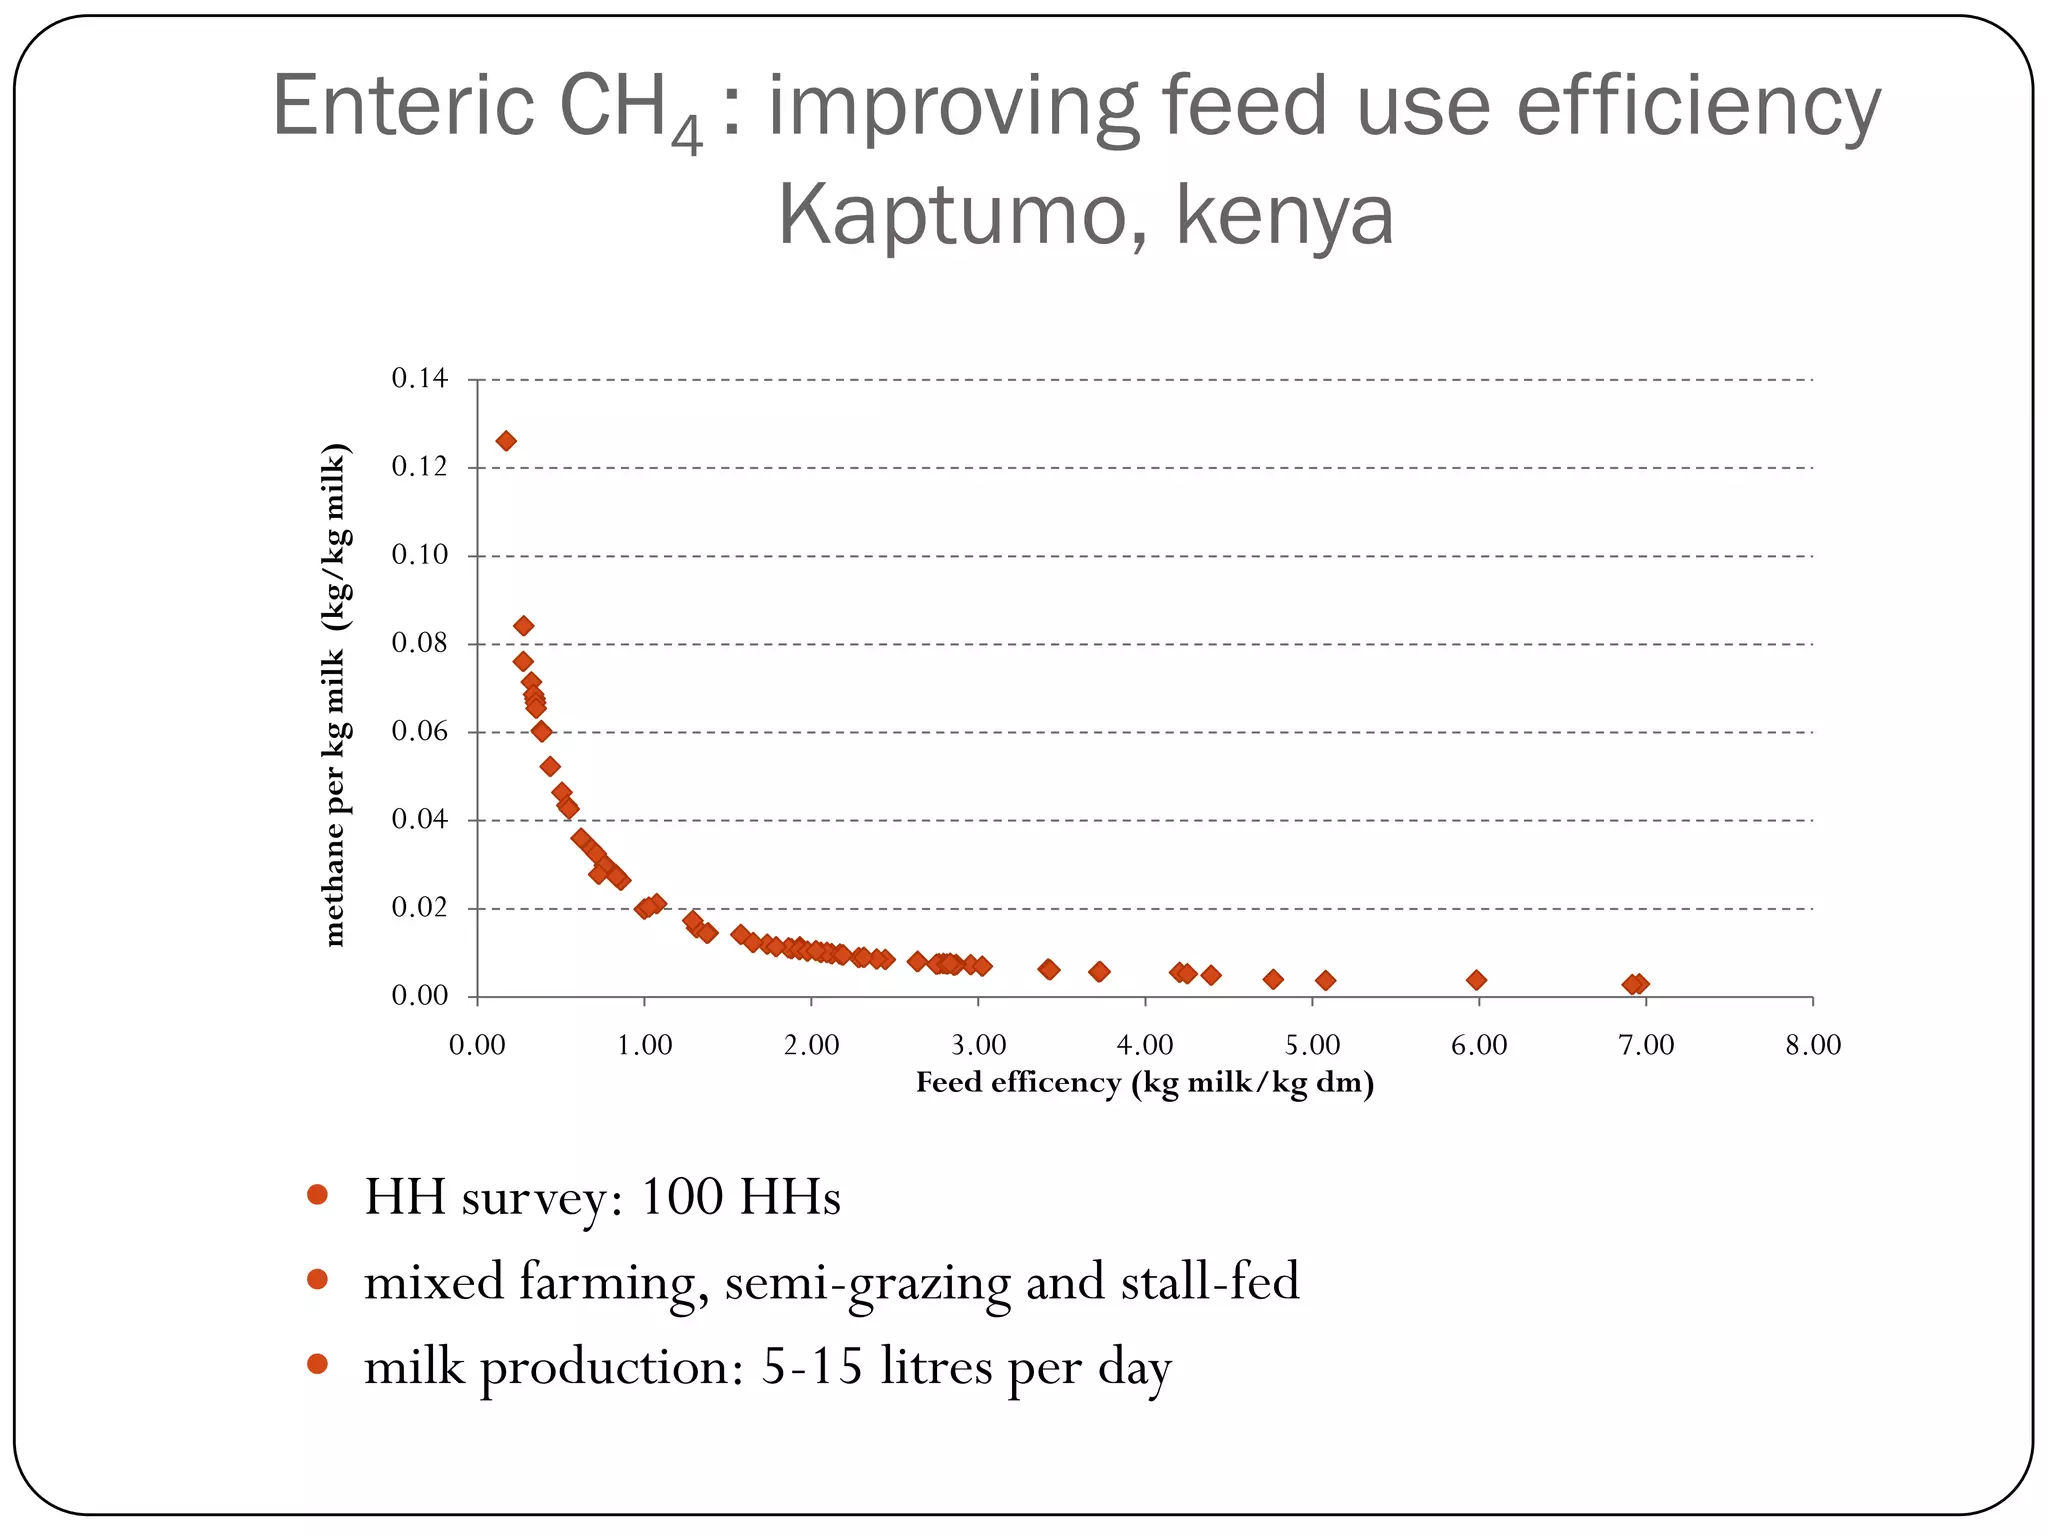
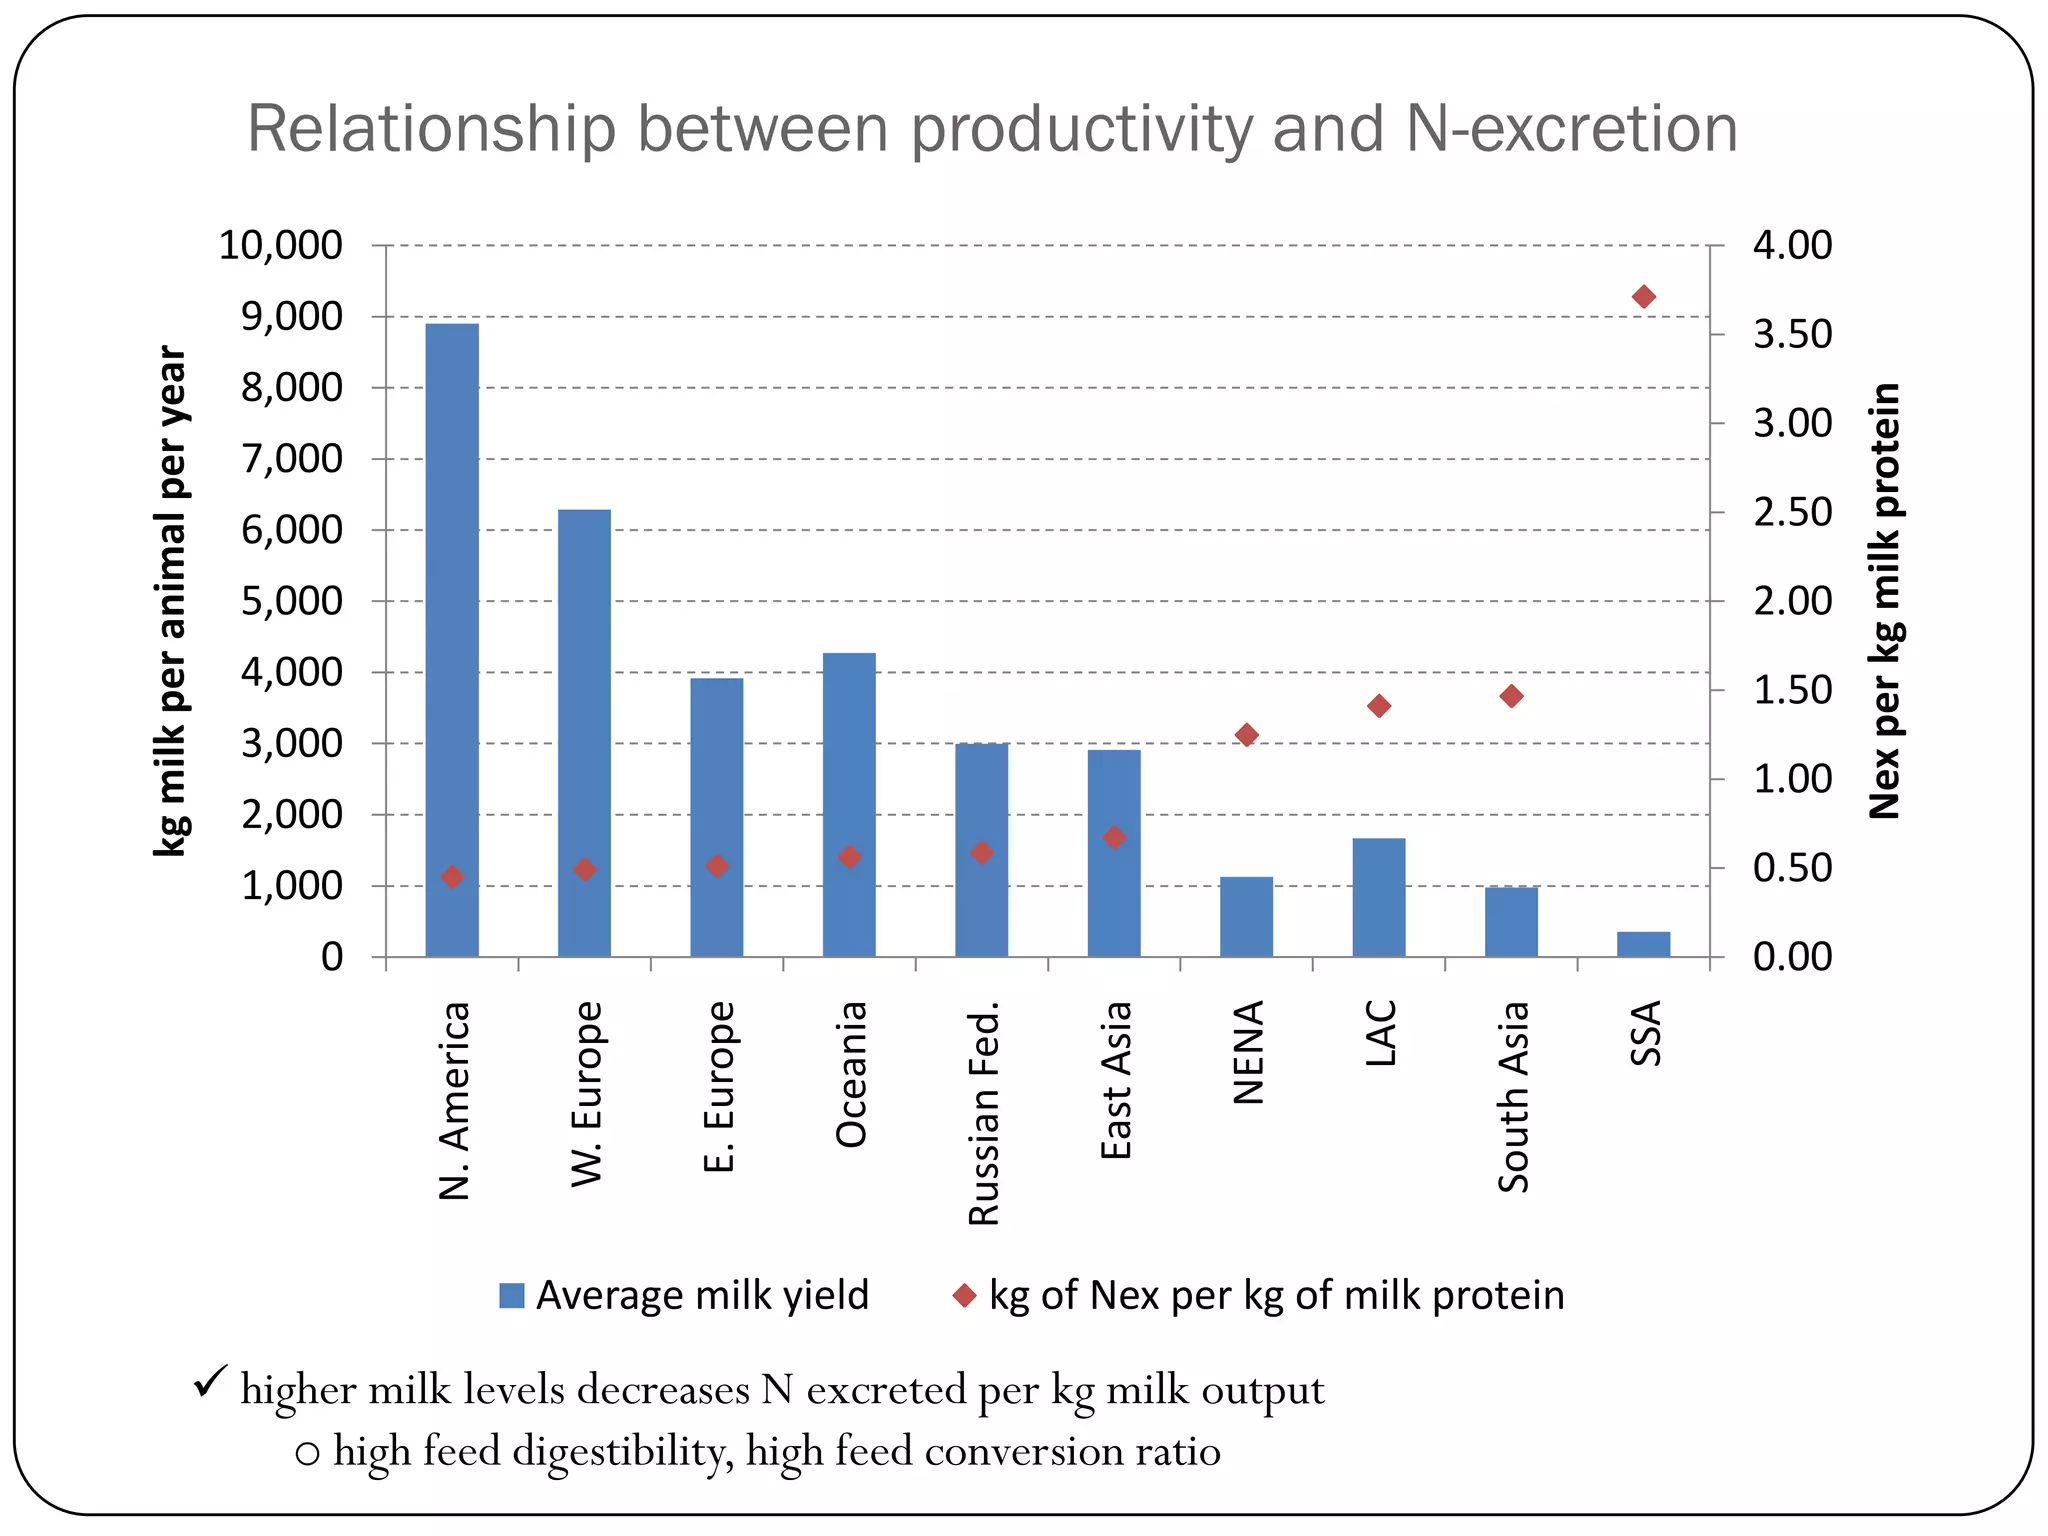
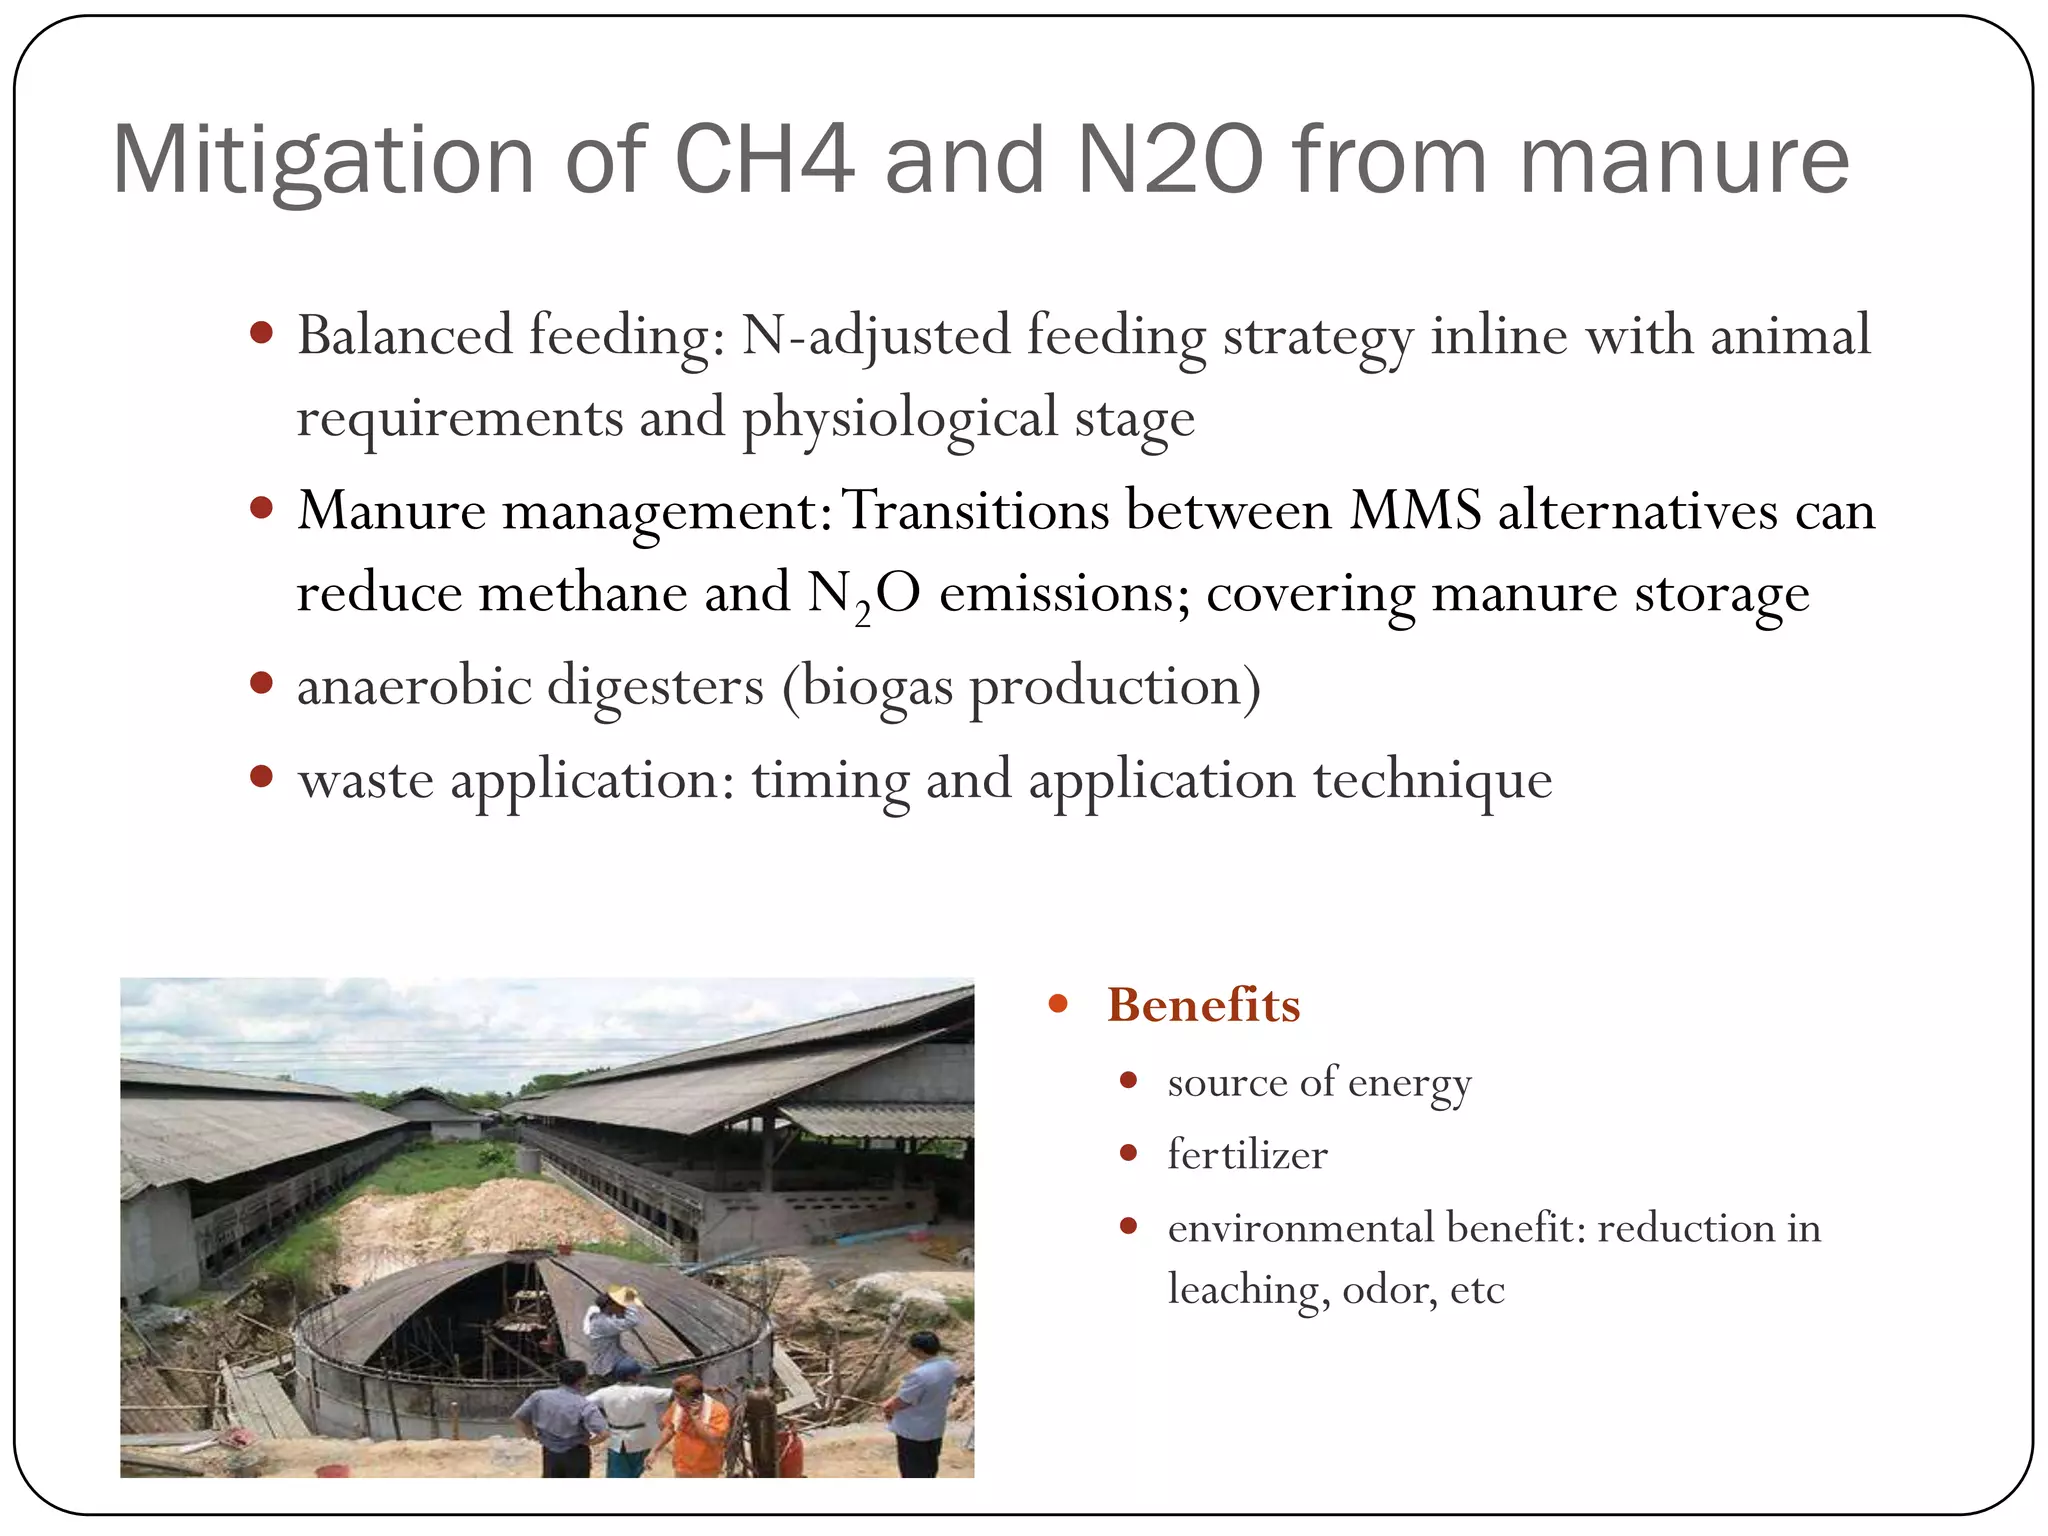
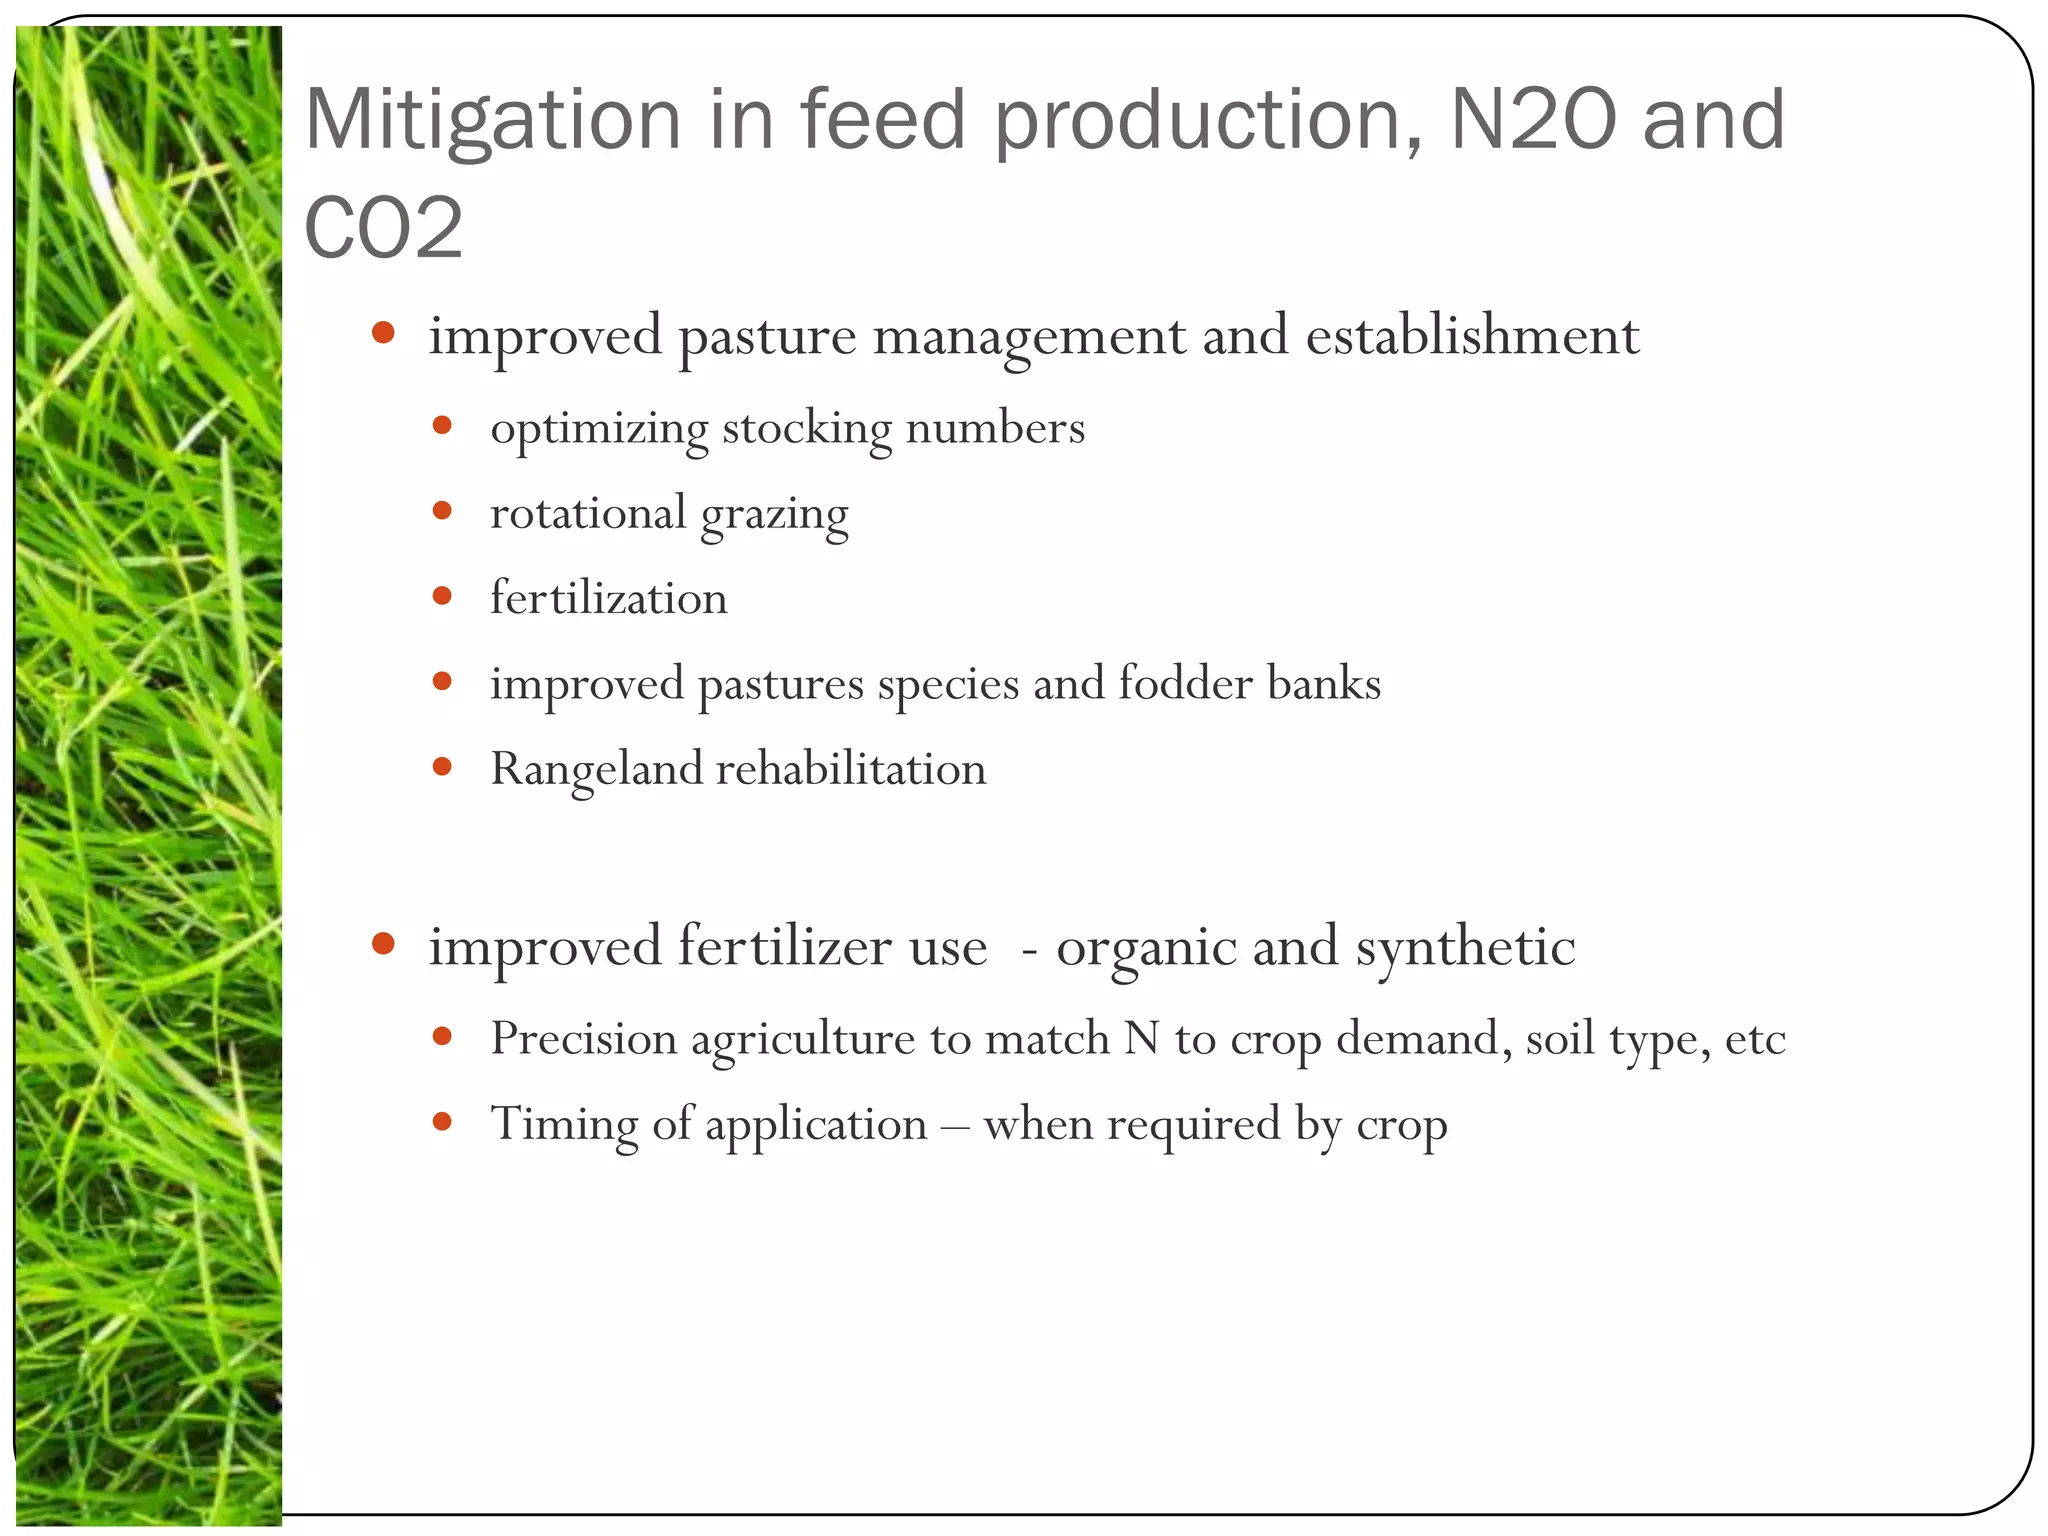
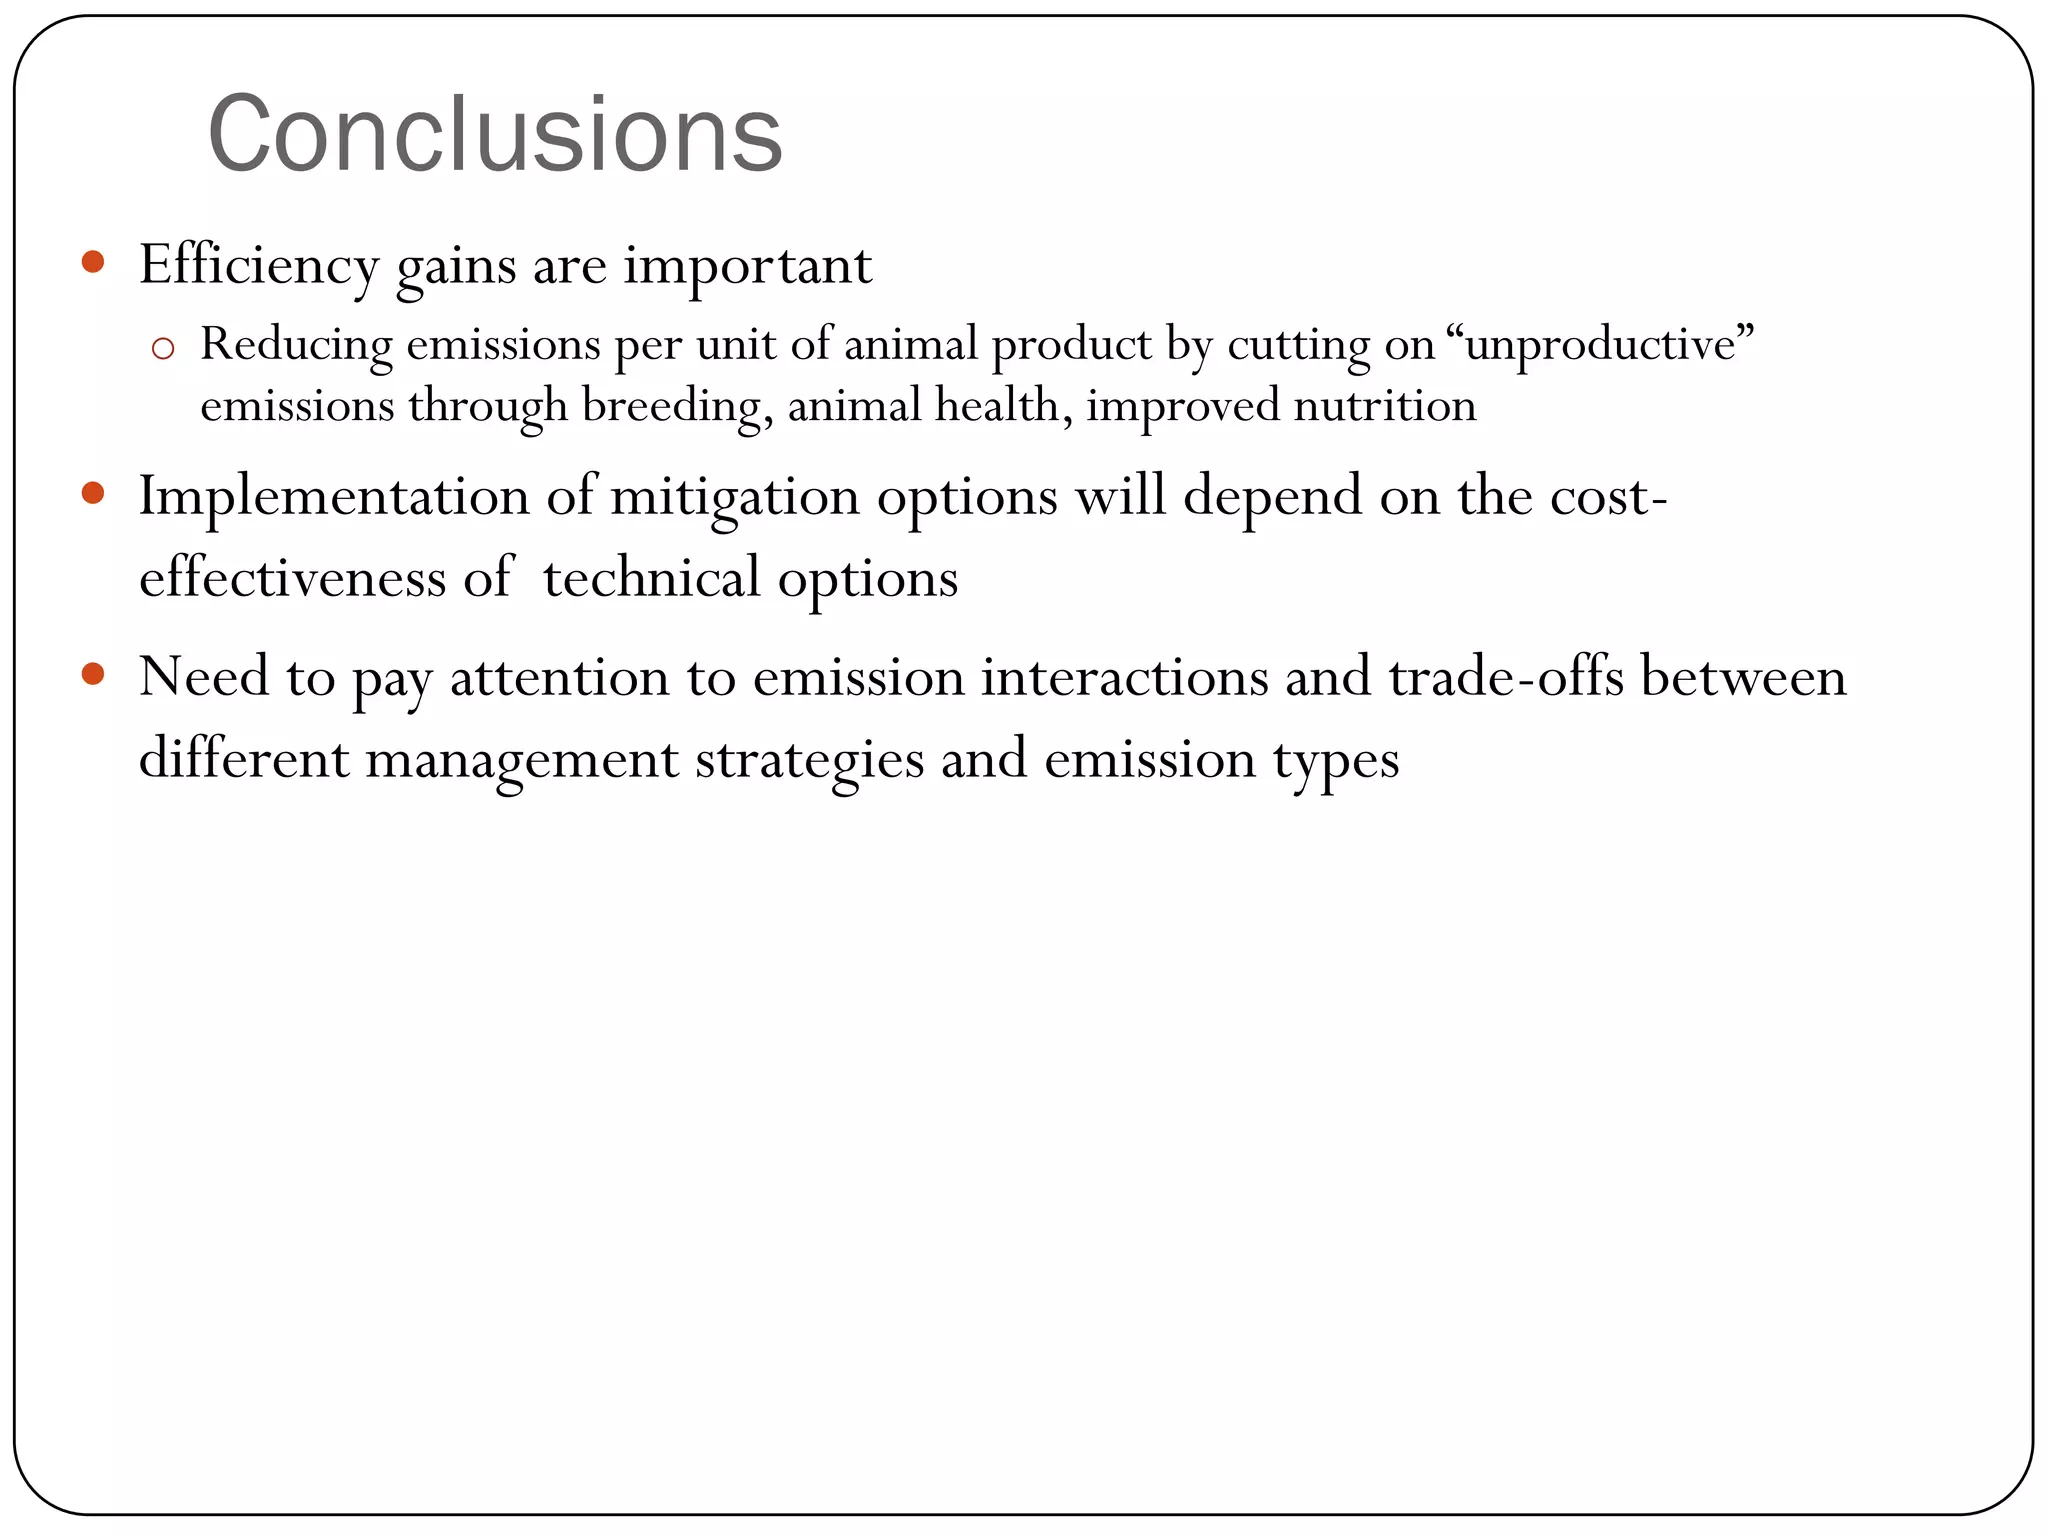
Technical mitigation options in dairy

     Pilot project on the feasibility of generating
    carbon credit through dairy productivity gains
      Second Project Stakeholder Consultation
     Workshop, Nairobi, Kenya, 29 January 2013
                                       Carolyn Opio
                                        FAO-Rome
Main sources of emissions in dairy
                  10.0

                   9.0
                                                                                                                                             Post-farm, CO2
                   8.0
                                                                                                                                             Direct & embedded
Kg CO2e/kg FPCM


                   7.0                                                                                                                       energy, CO2
                   6.0                                                                                                                       LUC - Soybean, CO2

                   5.0
                                                                                                                                             Feed CO2
                   4.0
                                                                                                                                             Feed N2O
                   3.0

                   2.0                                                                                                                       Manure N2O

                   1.0
                                                                                                                                             Manure CH4
                   0.0
                                                                                   NENA


                                                                                                                                     World
                                                                                          SSA
                                            W. Europe

                                                        E. Europe

                                                                    Russian Fed.
                                      LAC


                                                                                                             E & SE Asia

                                                                                                                           Oceania
                                                                                                South Asia
                                                                                                                                             Enteric CH4
                         N. America
Mitigation options
 Huge variation; significant potential to reduce emissions


 Key areas of intervention
   CH4 from enteric fermentation
   CH4 and N2O from manure management
   N2O (manure and synthetic N) from feed production
   CO2 from feed production, processing and transport
Enteric methane: entry points
                                • Management practices
                                • Animal health
                 Dairy herd     • Reproduction
                                • Improved genetics


                                • Increasing animal productivity
Enteric CH4    Individual cow   • Improved feed quality
                                • Improved feed use efficiency


                                 • Improving rumen efficiency
               Rumen microbes    rumen manipulation
                                  feed additives (fats, oils)
Enteric CH4: improving animal productivity

                                 0.60

                                 0.50
       Enteric methane/kg milk


                                 0.40

                                 0.30

                                 0.20

                                 0.10

                                 0.00
                                        0   5   10        15         20       25     30
                                                     Milk /cow/day


Improved nutrition, reproductive performance, animal health, management, genetics
    o reduces maintenance overhead associated with each unit of product
    o fewer animals to produce same quantity of product
Enteric CH4: improving diet quality

                          10,000                                                                                                                40                 Improved diet quality
                           9,000                                                                                                                                         Increase concentrate ratio in diet
                                                                                                                                                35

                           8,000
                                                                                                                                                                         higher quality forages e.g. legumes, silage
                                                                                                                                                30                       feed processing
                           7,000
                                                                                                                                                                          (grinding, chopping, chemical treatment
Kg milk per animal/year


                                                                                                                                                25
                           6,000                                                                                                                                          e.g. urea) - digestibility


                                                                                                                                                     Percentage
                           5,000                                                                                                                20
                                                                                                                                                                         Grazing mgt to improve quality of
                                                                                                                                                                          pastures, animal productivity
                           4,000
                                                                                                                                                15

                           3,000
                                                                                                                                                10
                           2,000

                                                                                                                                                5
                           1,000                                                                                                                                    •      improved feed digestibility
                              0                                                                                                                 0                   •      Increase in DM intake and utilization
                                                                                                                                          SSA
                                   N. America


                                                                                                    East Asia
                                                                        Oceania

                                                                                  Russian Fed.


                                                                                                                LAC

                                                                                                                      NENA
                                                W. Europe


                                                                                                                             South Asia
                                                            E. Europe


                                                                                                                                                                    •      improved productivity
                                                                                                                                                                    •      reduced methane production per unit of
                                                Average milk yield                               Share of concentrate in diet                                              output
Enteric CH4 :improving feed use efficiency – global
                                                                                                           Feed use for maintenance vs. productive functions

                       0.60
                                                                                                     140


                       0.50                                                                          120


                                                                                                     100
                       0.40


                                                                                MJ.animal-1 year-1
 Methane per kg milk


                                                                                                     80

                       0.30
                                                                                                     60


                                                                                                     40
                       0.20

                                                                                                     20

                       0.10
                                                                                                      0


                                                                                                                                                                      NENA

                                                                                                                                                                             SSA


                                                                                                                                                                                                                 Oceania
                                                                                                                         LAC


                                                                                                                                                                                                East & SE Asia
                                                                                                                                                                                   South Asia
                                                                                                                               W. Europe

                                                                                                                                           E. Europe

                                                                                                                                                       Russian Fed.
                       0.00                                                                                 N. America
                              0.00   0.50          1.00           1.50   2.00
                                     feed efficiency (kg milk/kg feed)
                                                                                                            Maintenance                Activity          Pregnancy           Milk production

 better nutrition, management, animal breeding, animal
health
Enteric CH4 : improving feed use efficiency
              Kaptumo, kenya
                                    0.14
 methane per kg milk (kg/kg milk)


                                    0.12

                                    0.10

                                    0.08

                                    0.06

                                    0.04

                                    0.02

                                    0.00
                                           0.00   1.00   2.00     3.00        4.00       5.00    6.00   7.00   8.00
                                                                Feed efficency (kg milk/kg dm)


 HH survey: 100 HHs
 mixed farming, semi-grazing and stall-fed
 milk production: 5-15 litres per day
Manure N20 and CH4 emissions
  N2O emissions
    N availability in manure
    Climatic conditions – soil type, temperature


  CH4 emissions
    Quantity of manure produced: animal numbers, feed intake and
     digestibility
    Methane producing potential of manure
    Manure management system
Methane conversion factor: share of volatile solids converted
to CH4
Proportion of feed nitrogen retained in dairy


75-95% of N ingested in feed is excreted
Manure N20 and CH4: entry points
1.       Changes to manure storage and handling techniques:
         solid, drylot, slurry, lagoons, etc

2.       Feeding practices that influence manure attributes (in turn
         determine amount of N excreted and volatile solids that can be
         converted to CH4)
          protein content of feed ration
          digestibility of feed
          feed conversion ratio – indicator of feed use efficiency
Relationship between productivity and N-excretion
                              10,000                                                                                                              4.00
                               9,000                                                                                                              3.50
kg milk per animal per year


                               8,000


                                                                                                                                                         Nex per kg milk protein
                                                                                                                                                  3.00
                               7,000
                               6,000                                                                                                              2.50
                               5,000                                                                                                              2.00
                               4,000                                                                                                              1.50
                               3,000
                                                                                                                                                  1.00
                               2,000
                               1,000                                                                                                              0.50
                                  0                                                                                                               0.00


                                                                                                                         LAC
                                                                             Oceania


                                                                                                                  NENA


                                                                                                                                            SSA
                                                                                                      East Asia
                                                     W. Europe

                                                                 E. Europe


                                                                                                                               South Asia
                                                                                       Russian Fed.
                                       N. America


                                                    Average milk yield                       kg of Nex per kg of milk protein

                        higher milk levels decreases N excreted per kg milk output
                            o high feed digestibility, high feed conversion ratio
Mitigation of CH4 and N2O from manure
   Balanced feeding: N-adjusted feeding strategy inline with animal
    requirements and physiological stage
   Manure management: Transitions between MMS alternatives can
    reduce methane and N2O emissions; covering manure storage
   anaerobic digesters (biogas production)
   waste application: timing and application technique


                                   Benefits
                                      source of energy
                                      fertilizer
                                      environmental benefit: reduction in
                                       leaching, odor, etc
Mitigation in feed production, N2O and
CO2
  improved pasture management and establishment
    optimizing stocking numbers
    rotational grazing
    fertilization
    improved pastures species and fodder banks
    Rangeland rehabilitation


  improved fertilizer use - organic and synthetic
    Precision agriculture to match N to crop demand, soil type, etc
    Timing of application – when required by crop
Conclusions
 Efficiency gains are important
  o Reducing emissions per unit of animal product by cutting on “unproductive”
     emissions through breeding, animal health, improved nutrition
 Implementation of mitigation options will depend on the cost-
  effectiveness of technical options
 Need to pay attention to emission interactions and trade-offs between
  different management strategies and emission types

Technical mitigation options in dairy

  • 1.
    Technical mitigation optionsin dairy Pilot project on the feasibility of generating carbon credit through dairy productivity gains Second Project Stakeholder Consultation Workshop, Nairobi, Kenya, 29 January 2013 Carolyn Opio FAO-Rome
  • 2.
    Main sources ofemissions in dairy 10.0 9.0 Post-farm, CO2 8.0 Direct & embedded Kg CO2e/kg FPCM 7.0 energy, CO2 6.0 LUC - Soybean, CO2 5.0 Feed CO2 4.0 Feed N2O 3.0 2.0 Manure N2O 1.0 Manure CH4 0.0 NENA World SSA W. Europe E. Europe Russian Fed. LAC E & SE Asia Oceania South Asia Enteric CH4 N. America
  • 3.
    Mitigation options  Hugevariation; significant potential to reduce emissions  Key areas of intervention  CH4 from enteric fermentation  CH4 and N2O from manure management  N2O (manure and synthetic N) from feed production  CO2 from feed production, processing and transport
  • 4.
    Enteric methane: entrypoints • Management practices • Animal health Dairy herd • Reproduction • Improved genetics • Increasing animal productivity Enteric CH4 Individual cow • Improved feed quality • Improved feed use efficiency • Improving rumen efficiency Rumen microbes rumen manipulation  feed additives (fats, oils)
  • 5.
    Enteric CH4: improvinganimal productivity 0.60 0.50 Enteric methane/kg milk 0.40 0.30 0.20 0.10 0.00 0 5 10 15 20 25 30 Milk /cow/day Improved nutrition, reproductive performance, animal health, management, genetics o reduces maintenance overhead associated with each unit of product o fewer animals to produce same quantity of product
  • 6.
    Enteric CH4: improvingdiet quality 10,000 40  Improved diet quality 9,000  Increase concentrate ratio in diet 35 8,000  higher quality forages e.g. legumes, silage 30  feed processing 7,000 (grinding, chopping, chemical treatment Kg milk per animal/year 25 6,000 e.g. urea) - digestibility Percentage 5,000 20  Grazing mgt to improve quality of pastures, animal productivity 4,000 15 3,000 10 2,000 5 1,000 • improved feed digestibility 0 0 • Increase in DM intake and utilization SSA N. America East Asia Oceania Russian Fed. LAC NENA W. Europe South Asia E. Europe • improved productivity • reduced methane production per unit of Average milk yield Share of concentrate in diet output
  • 7.
    Enteric CH4 :improvingfeed use efficiency – global Feed use for maintenance vs. productive functions 0.60 140 0.50 120 100 0.40 MJ.animal-1 year-1 Methane per kg milk 80 0.30 60 40 0.20 20 0.10 0 NENA SSA Oceania LAC East & SE Asia South Asia W. Europe E. Europe Russian Fed. 0.00 N. America 0.00 0.50 1.00 1.50 2.00 feed efficiency (kg milk/kg feed) Maintenance Activity Pregnancy Milk production  better nutrition, management, animal breeding, animal health
  • 8.
    Enteric CH4 :improving feed use efficiency Kaptumo, kenya 0.14 methane per kg milk (kg/kg milk) 0.12 0.10 0.08 0.06 0.04 0.02 0.00 0.00 1.00 2.00 3.00 4.00 5.00 6.00 7.00 8.00 Feed efficency (kg milk/kg dm)  HH survey: 100 HHs  mixed farming, semi-grazing and stall-fed  milk production: 5-15 litres per day
  • 9.
    Manure N20 andCH4 emissions  N2O emissions  N availability in manure  Climatic conditions – soil type, temperature  CH4 emissions  Quantity of manure produced: animal numbers, feed intake and digestibility  Methane producing potential of manure  Manure management system
  • 10.
    Methane conversion factor:share of volatile solids converted to CH4
  • 11.
    Proportion of feednitrogen retained in dairy 75-95% of N ingested in feed is excreted
  • 12.
    Manure N20 andCH4: entry points 1. Changes to manure storage and handling techniques: solid, drylot, slurry, lagoons, etc 2. Feeding practices that influence manure attributes (in turn determine amount of N excreted and volatile solids that can be converted to CH4)  protein content of feed ration  digestibility of feed  feed conversion ratio – indicator of feed use efficiency
  • 13.
    Relationship between productivityand N-excretion 10,000 4.00 9,000 3.50 kg milk per animal per year 8,000 Nex per kg milk protein 3.00 7,000 6,000 2.50 5,000 2.00 4,000 1.50 3,000 1.00 2,000 1,000 0.50 0 0.00 LAC Oceania NENA SSA East Asia W. Europe E. Europe South Asia Russian Fed. N. America Average milk yield kg of Nex per kg of milk protein  higher milk levels decreases N excreted per kg milk output o high feed digestibility, high feed conversion ratio
  • 14.
    Mitigation of CH4and N2O from manure  Balanced feeding: N-adjusted feeding strategy inline with animal requirements and physiological stage  Manure management: Transitions between MMS alternatives can reduce methane and N2O emissions; covering manure storage  anaerobic digesters (biogas production)  waste application: timing and application technique  Benefits  source of energy  fertilizer  environmental benefit: reduction in leaching, odor, etc
  • 15.
    Mitigation in feedproduction, N2O and CO2  improved pasture management and establishment  optimizing stocking numbers  rotational grazing  fertilization  improved pastures species and fodder banks  Rangeland rehabilitation  improved fertilizer use - organic and synthetic  Precision agriculture to match N to crop demand, soil type, etc  Timing of application – when required by crop
  • 16.
    Conclusions  Efficiency gainsare important o Reducing emissions per unit of animal product by cutting on “unproductive” emissions through breeding, animal health, improved nutrition  Implementation of mitigation options will depend on the cost- effectiveness of technical options  Need to pay attention to emission interactions and trade-offs between different management strategies and emission types