- A hydrograph shows the rate of water flow over time at a specific point along a river or channel. It is used in sewer system design.
- The main components of a hydrograph are the rising limb, peak discharge, recession limb, lag time, time to peak, and discharge rate.
- A unit hydrograph represents the runoff from 1 unit of effective rainfall over a given watershed's duration. It allows prediction of runoff from different rainfall amounts. Synthetic unit hydrographs use watershed characteristics to model ungauged areas.
HYDROGRAPH
• is agraph showing the rate of flow
(discharge) versus time past a
specific point in a river, or other
channel or conduit carrying flow.
• It can also refer to a graph showing
the volume of water reaching a
particular outfall.
3.
• graphs arecommonly used in the design
of sewerage, more specifically, the design
of surface water sewerage systems
and combined sewers.
4.
COMPONENTS OF AHYDROGRAPH
• Rising limb: The rising limb of hydro graph, also known
as concentration curve, reflects a prolonged increase in
discharge from a catchment area, typically in response
to a rainfall event
• Recession (or falling) limb: The recession limb extends
from the peak flow rate onward. The end of stormflow
(aka quickflow or direct runoff) and the return to
groundwater-derived flow (base flow) is often taken as
the point of inflection of the recession limb. The
recession limb represents the withdrawal of water
from the storage built up in the basin during the earlier
phases of the hydrograph.
5.
• Peak discharge:the highest point on the
hydro graph when the rate of discharge is
greatest
• Lag time: the time interval from the center of
mass of rainfall excess to the peak of the
resulting hydrograph
• Time to peak: time interval from the start of
the resulting hydro graph
• Discharge: the rate of flow (volume per unit
time) passing a specific location in a river or
other channel
8.
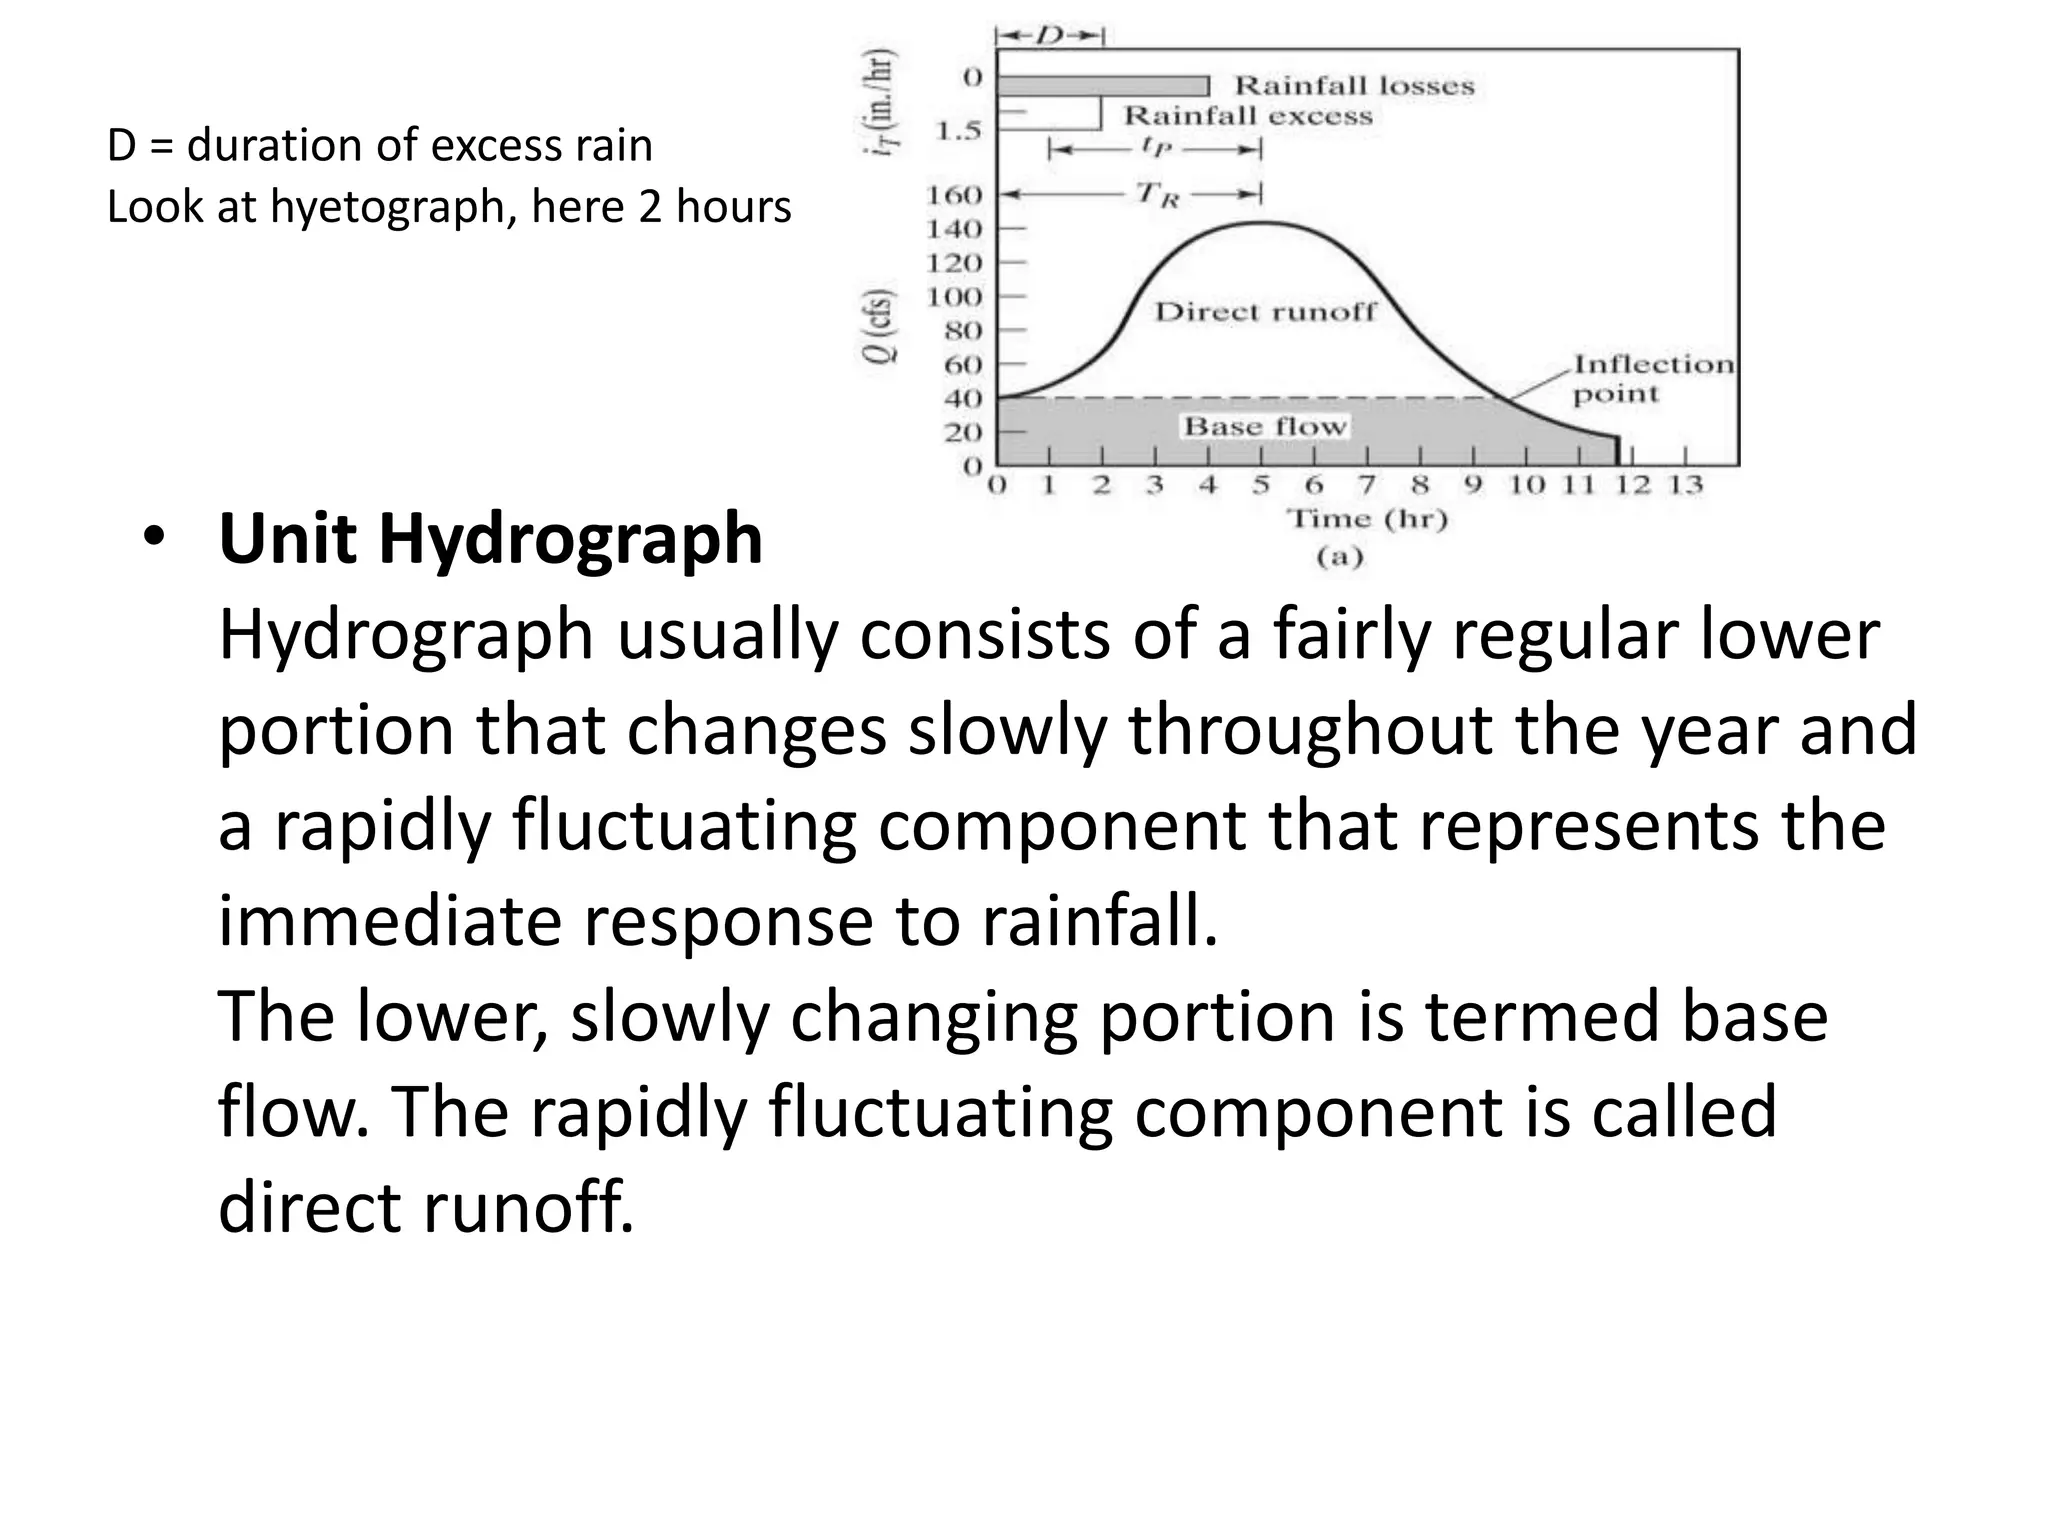
• Unit Hydrograph
Hydrographusually consists of a fairly regular lower
portion that changes slowly throughout the year and
a rapidly fluctuating component that represents the
immediate response to rainfall.
The lower, slowly changing portion is termed base
flow. The rapidly fluctuating component is called
direct runoff.
D = duration of excess rain
Look at hyetograph, here 2 hours
9.
UNIT HYDROGRAPH
• Theamount of run-off resulting from 1 unit
(1cm, 1mm, 1ft, etc.) of rainfall excess.
• is essentially a tool for determining the direct
runoff response to rainfall.
• Once you know the watershed’s response to
one storm, you can predict what its response
for another will look like.
10.
UH
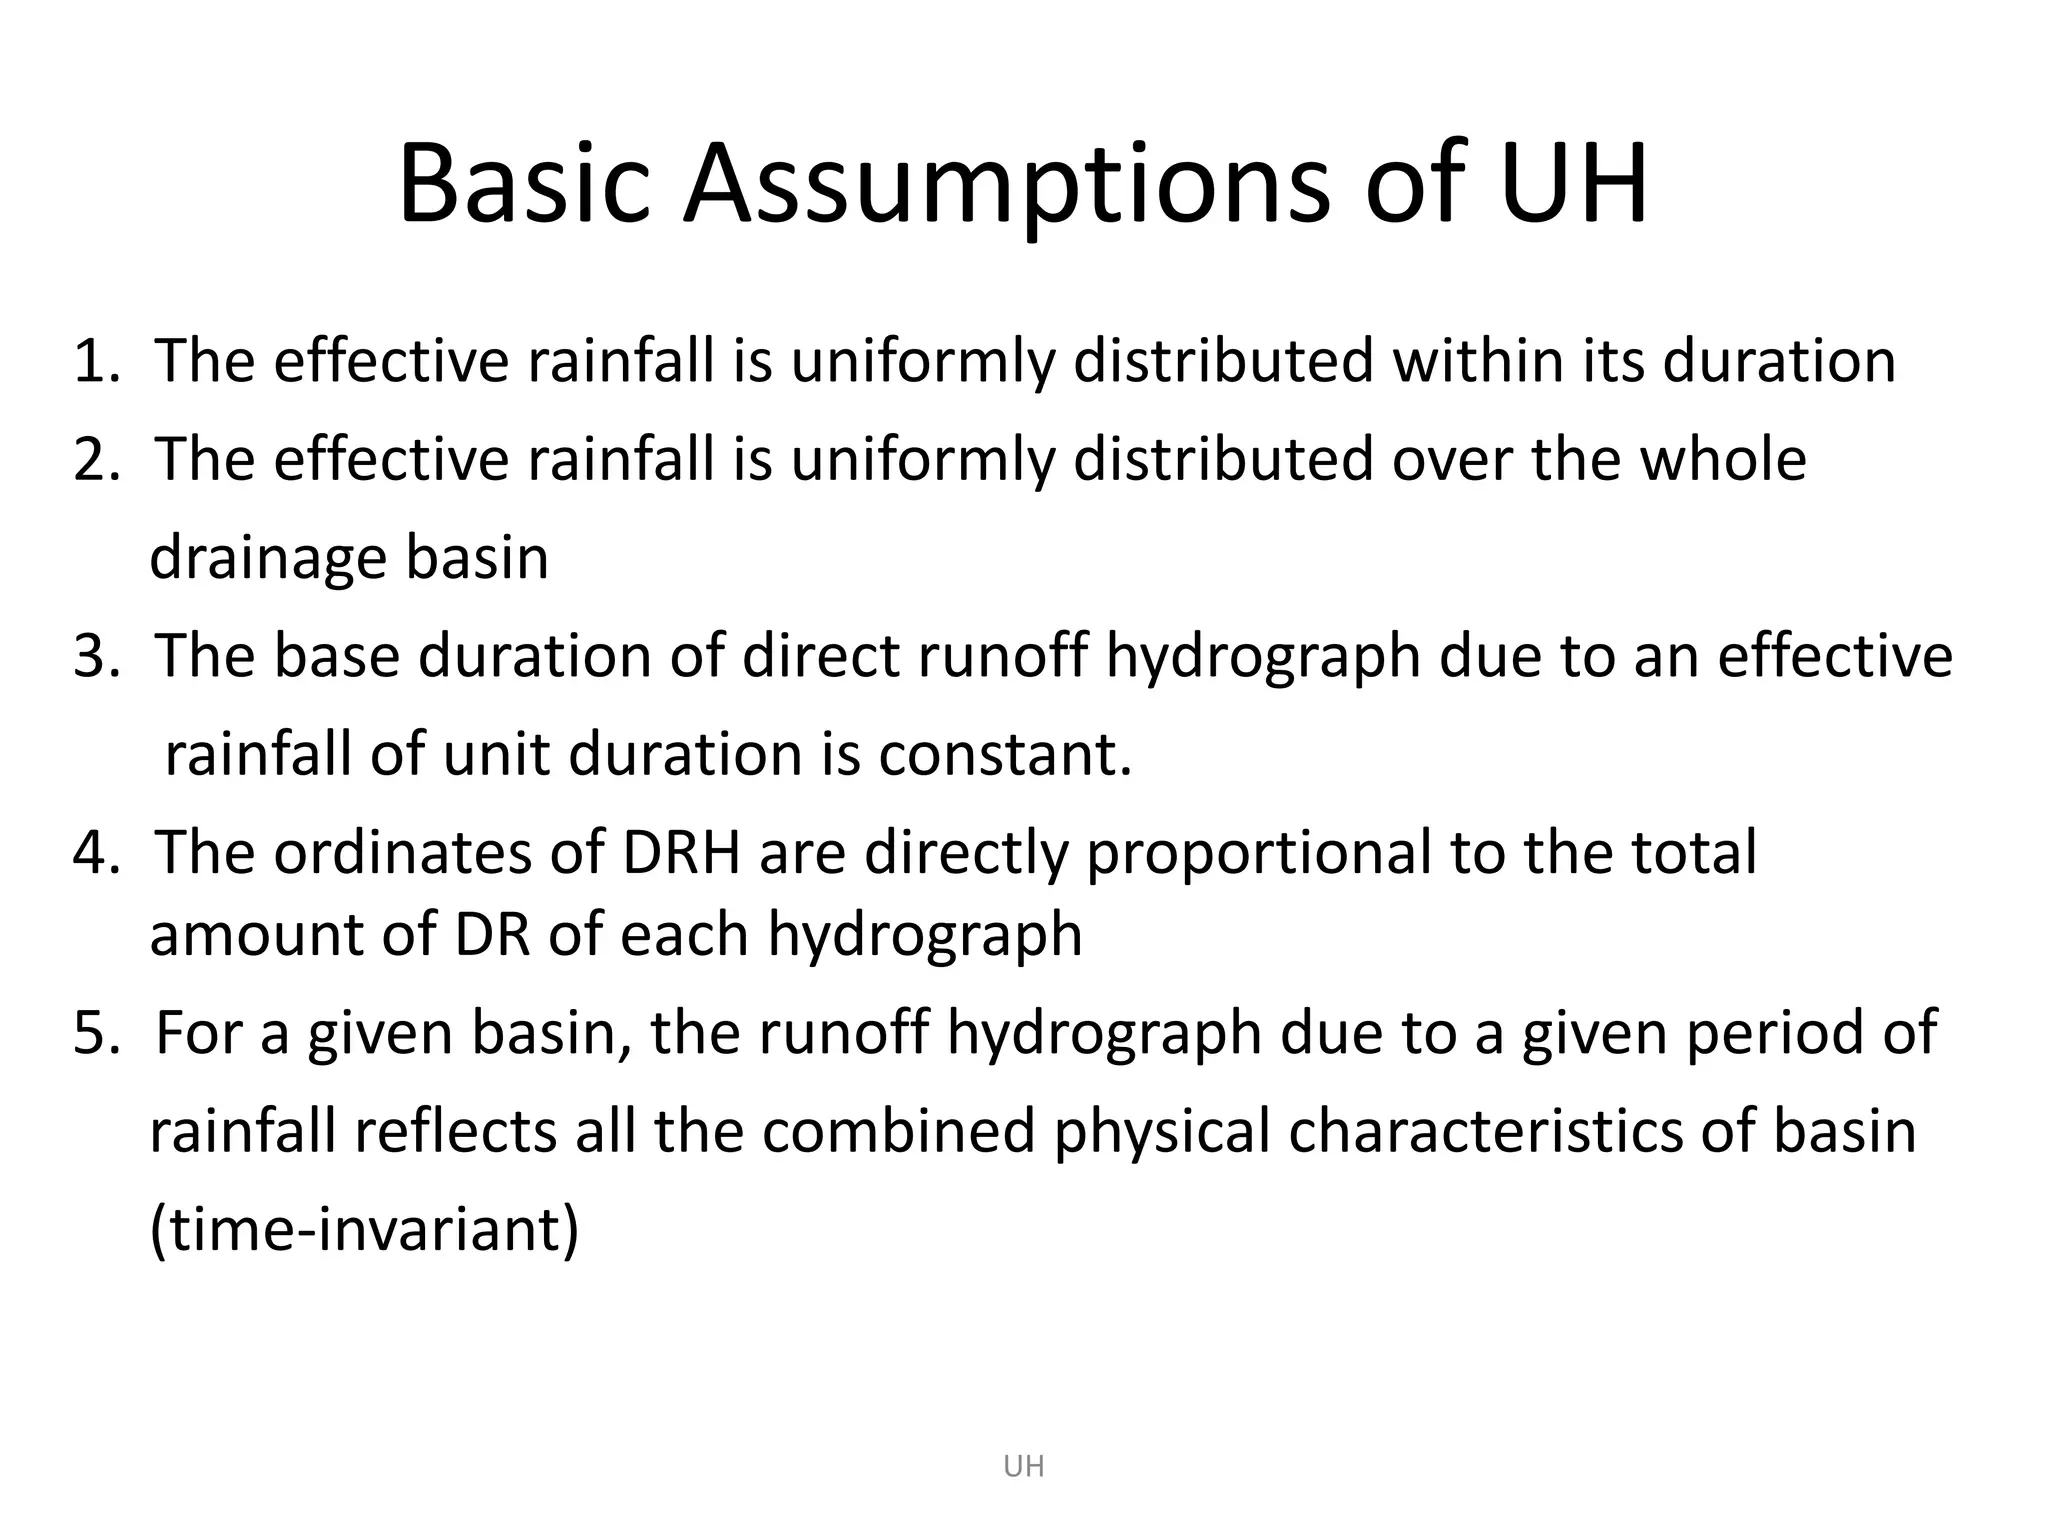
Basic Assumptions ofUH
1. The effective rainfall is uniformly distributed within its duration
2. The effective rainfall is uniformly distributed over the whole
drainage basin
3. The base duration of direct runoff hydrograph due to an effective
rainfall of unit duration is constant.
4. The ordinates of DRH are directly proportional to the total
amount of DR of each hydrograph
5. For a given basin, the runoff hydrograph due to a given period of
rainfall reflects all the combined physical characteristics of basin
(time-invariant)
11.
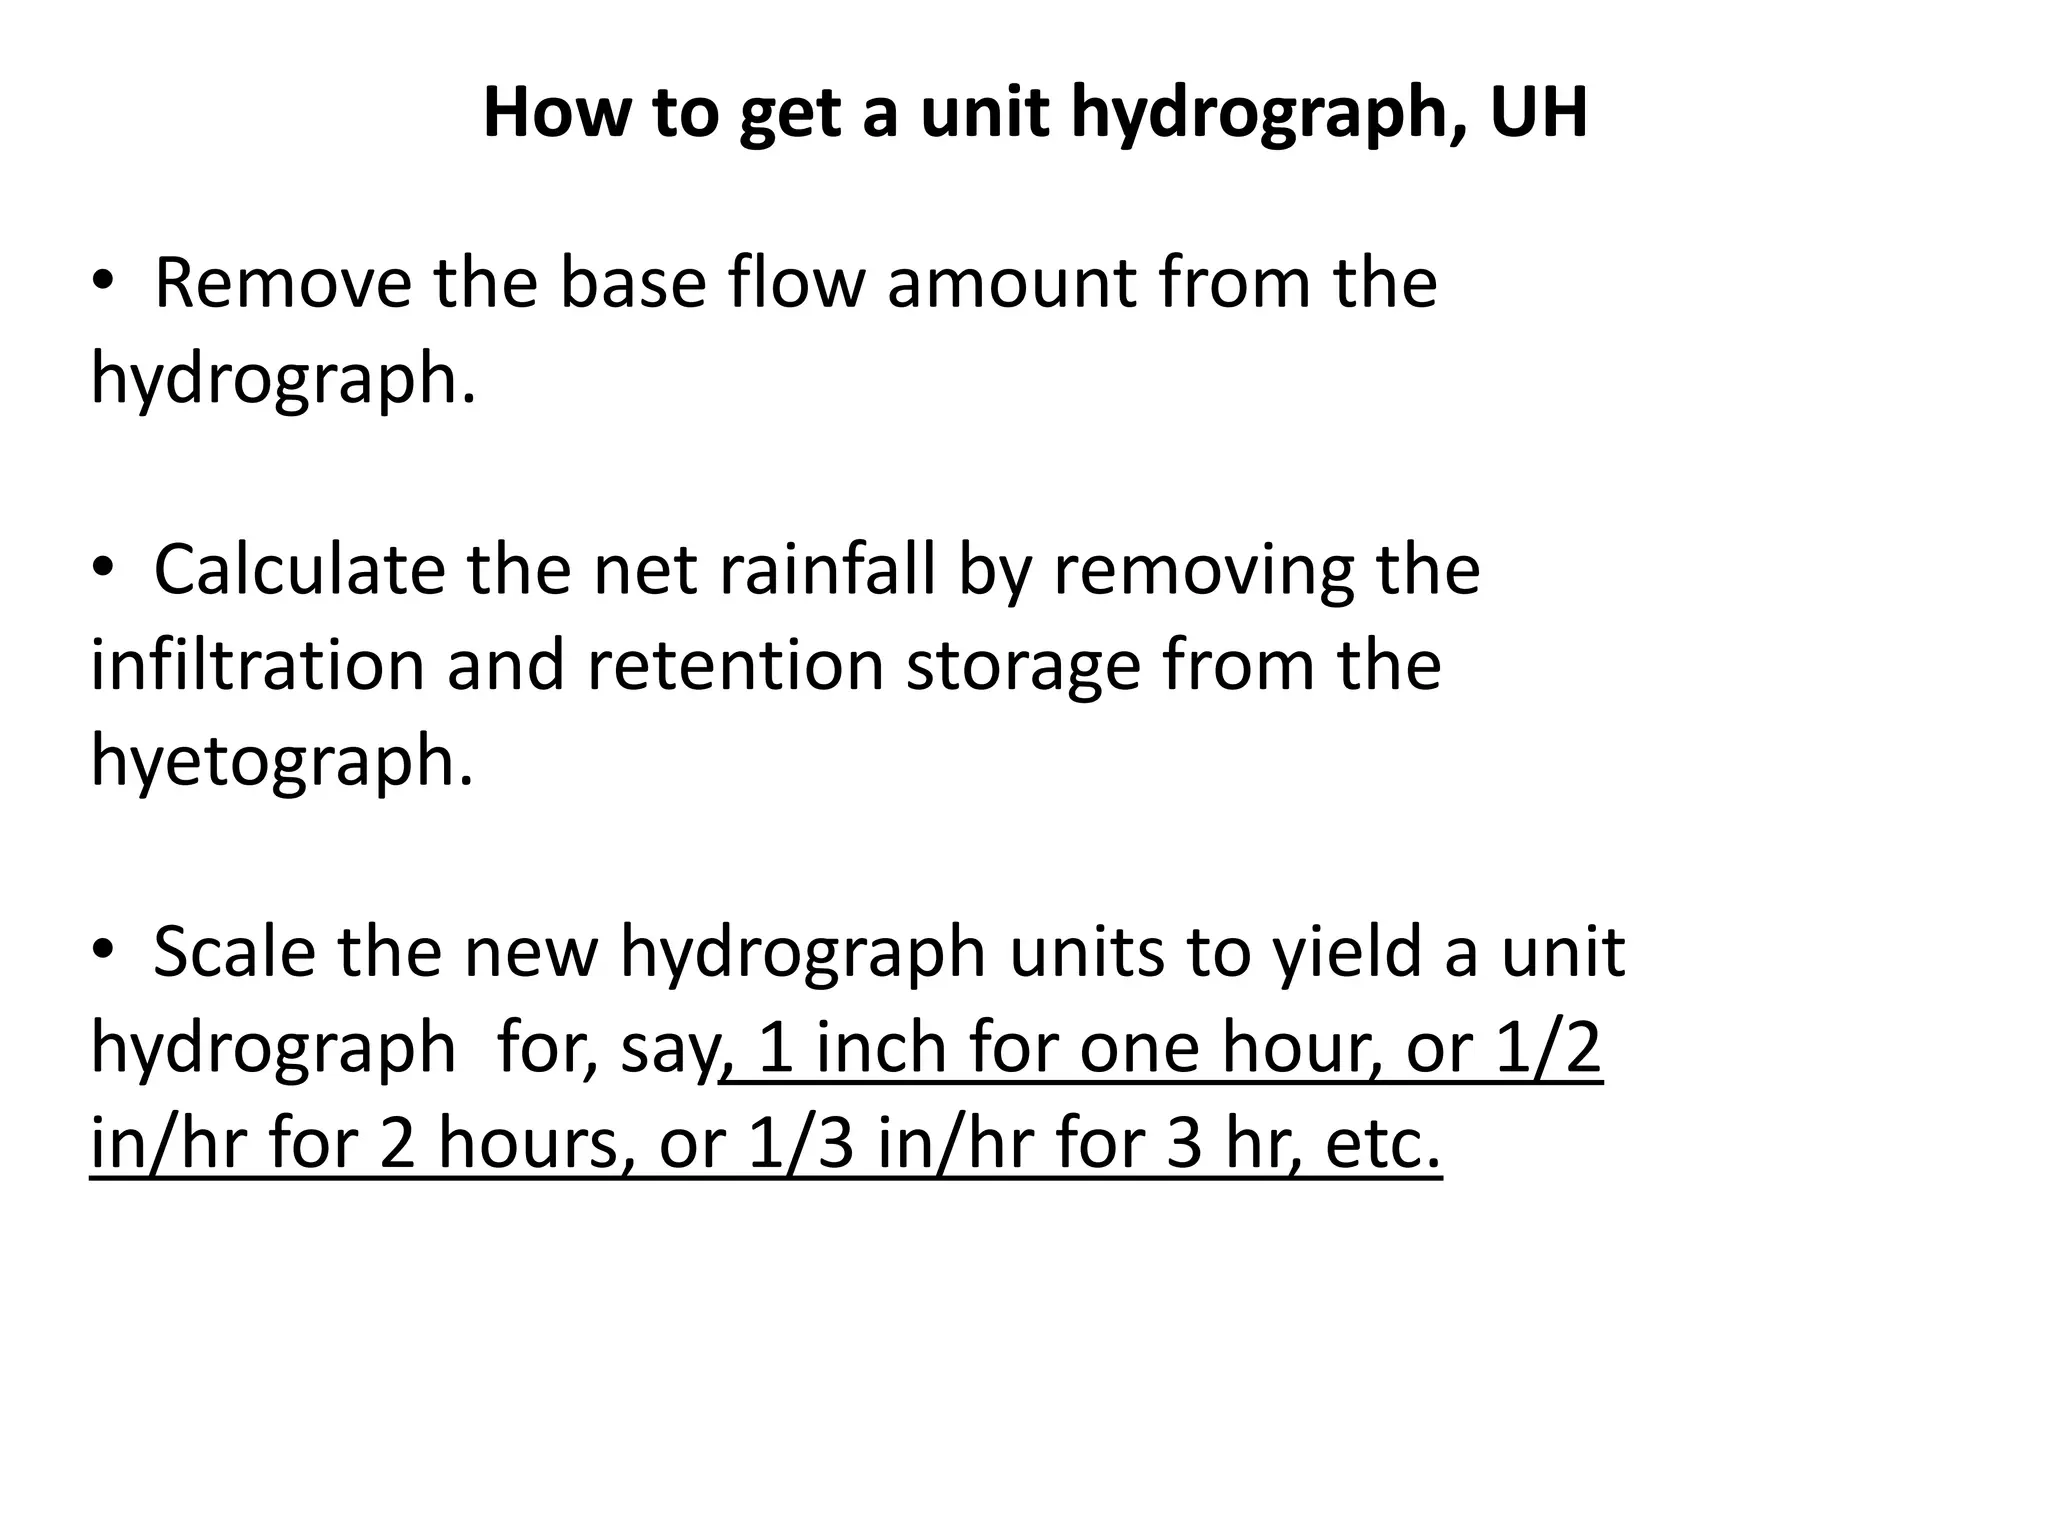
• Remove thebase flow amount from the
hydrograph.
• Calculate the net rainfall by removing the
infiltration and retention storage from the
hyetograph.
• Scale the new hydrograph units to yield a unit
hydrograph for, say, 1 inch for one hour, or 1/2
in/hr for 2 hours, or 1/3 in/hr for 3 hr, etc.
How to get a unit hydrograph, UH
12.
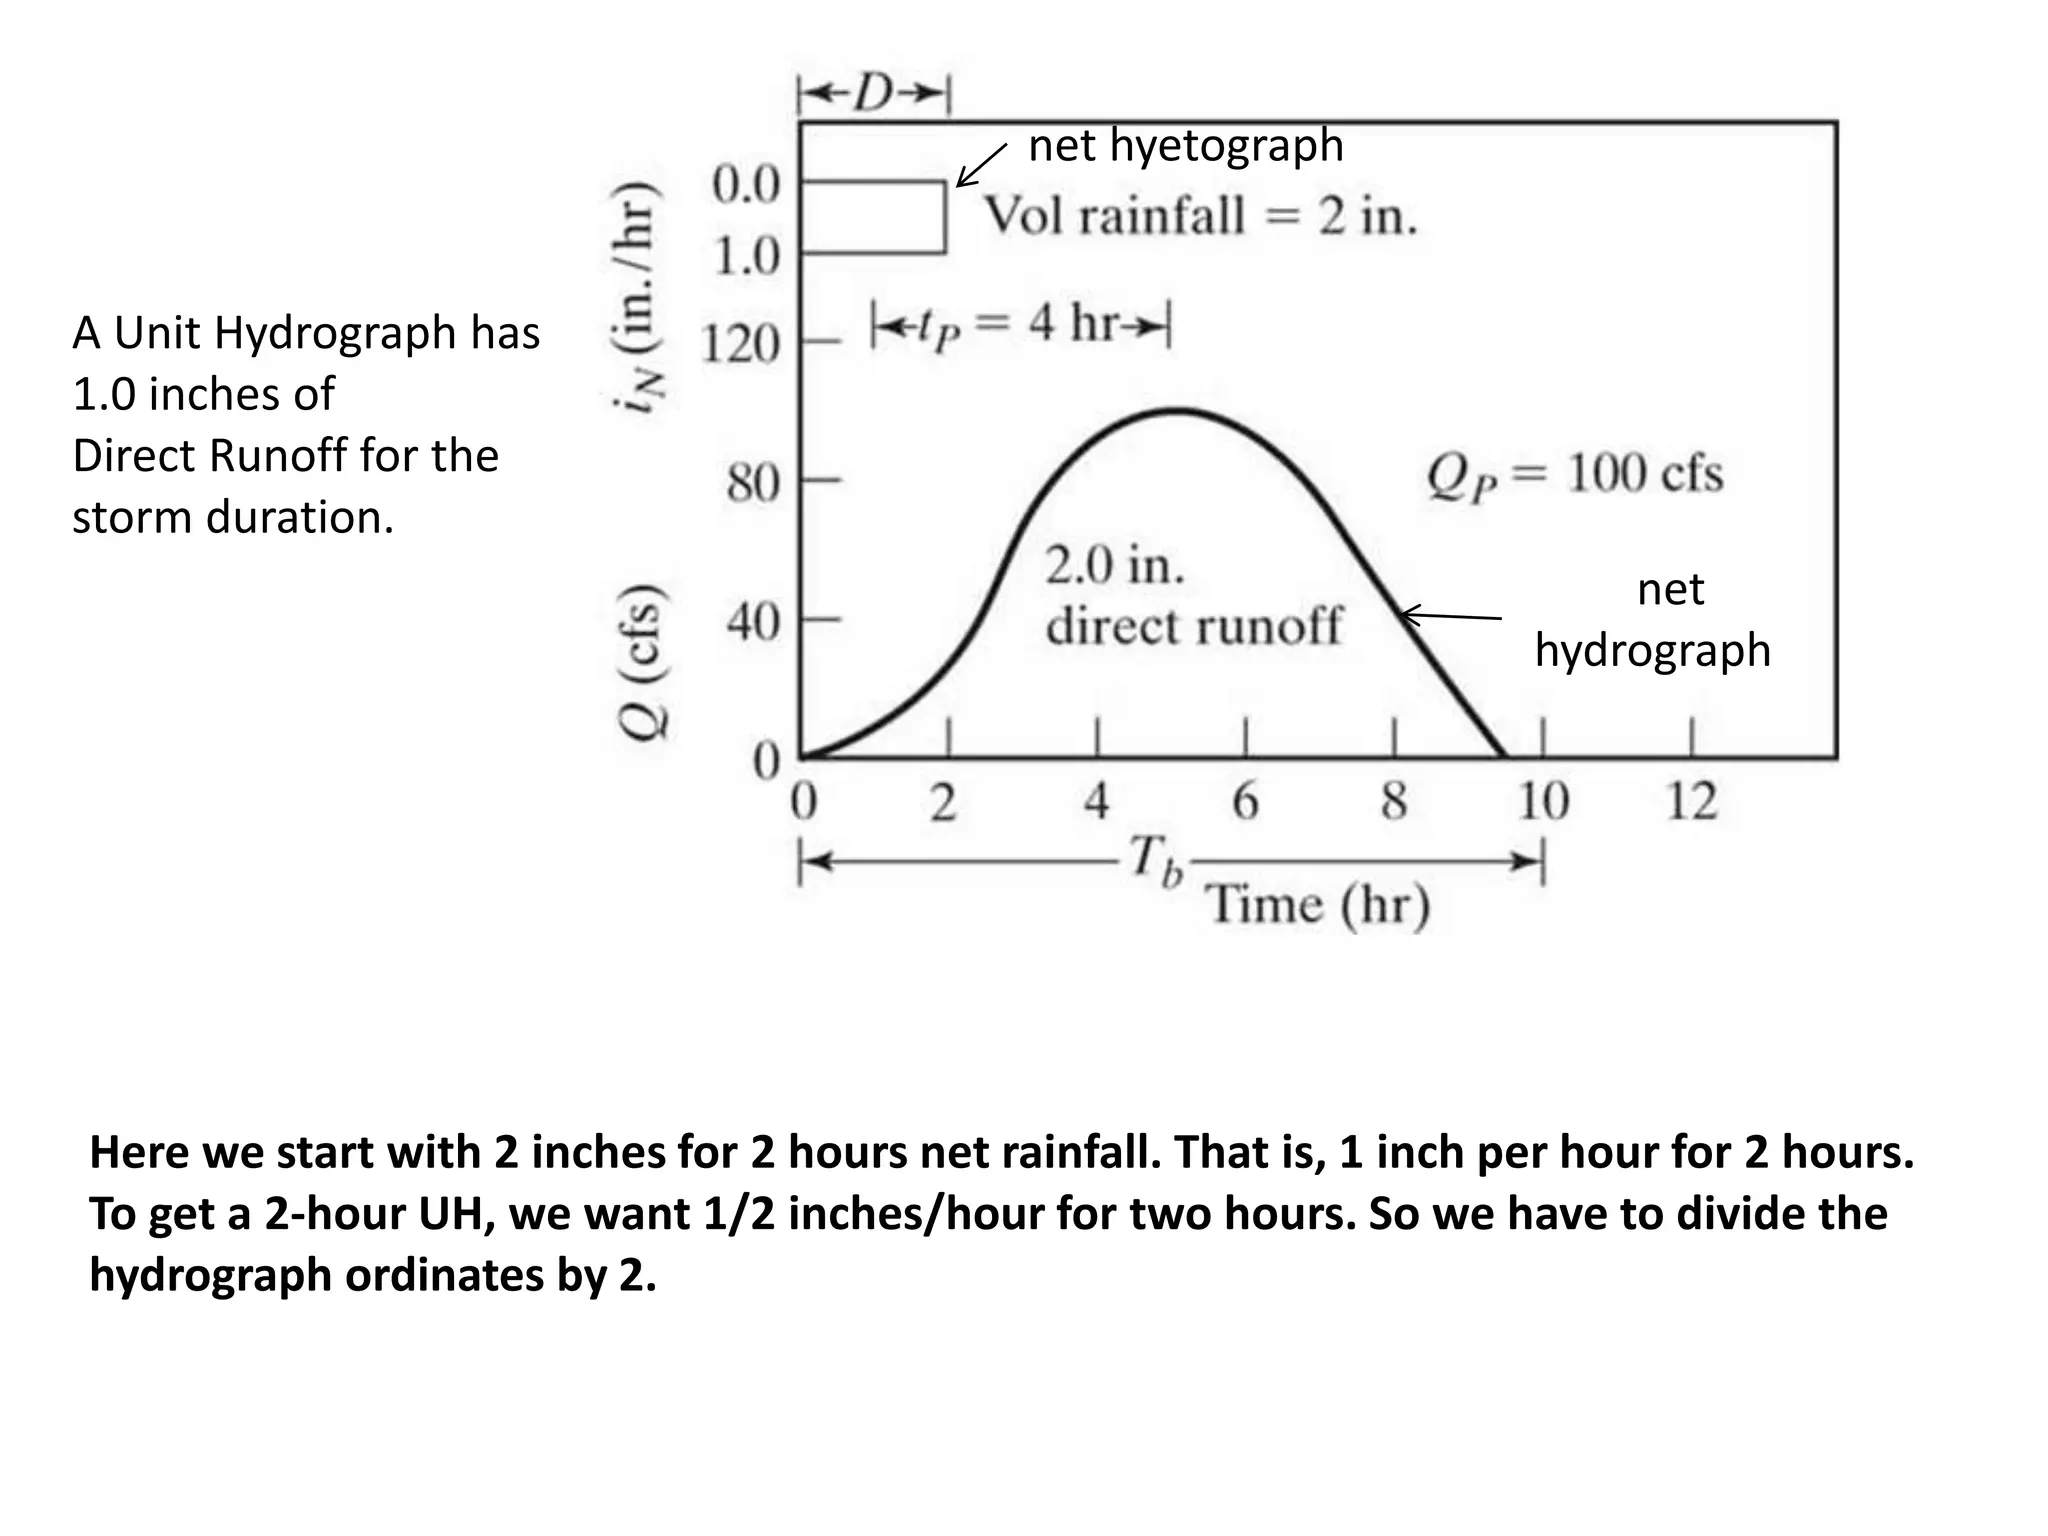
net
hydrograph
net hyetograph
A UnitHydrograph has
1.0 inches of
Direct Runoff for the
storm duration.
Here we start with 2 inches for 2 hours net rainfall. That is, 1 inch per hour for 2 hours.
To get a 2-hour UH, we want 1/2 inches/hour for two hours. So we have to divide the
hydrograph ordinates by 2.
13.
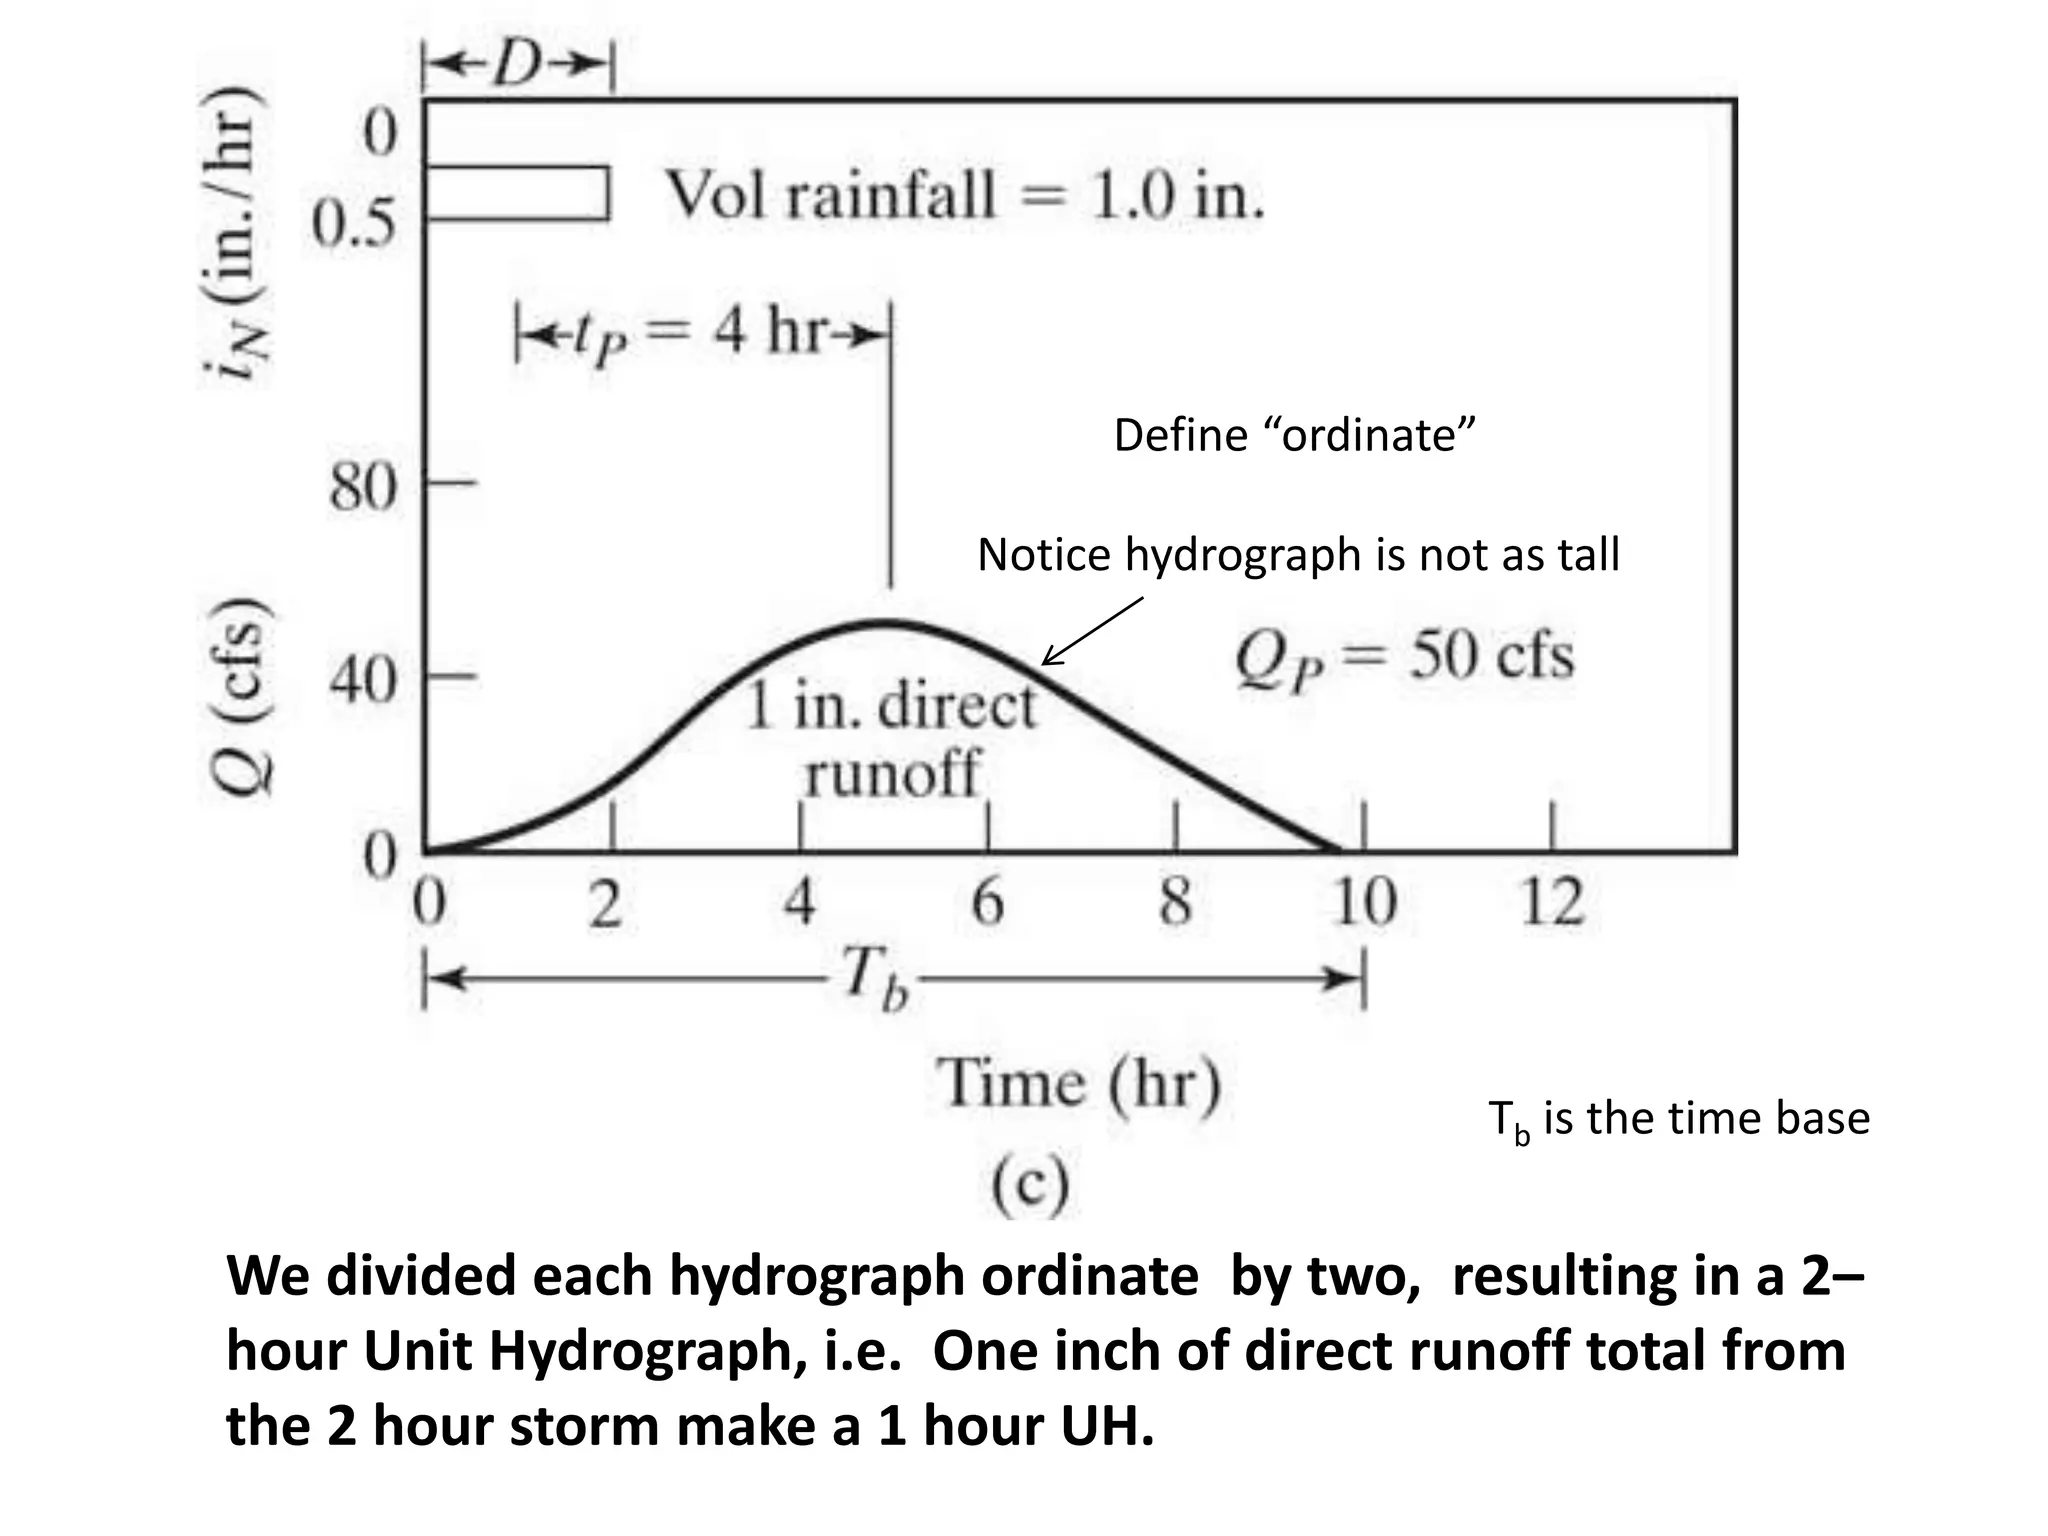
We divided eachhydrograph ordinate by two, resulting in a 2–
hour Unit Hydrograph, i.e. One inch of direct runoff total from
the 2 hour storm make a 1 hour UH.
Tb is the time base
Define “ordinate”
Notice hydrograph is not as tall
14.
Convert the directrunoff
hydrograph below to a 2-HR UH.
In the hyetograph F = 0.5 in/hr
In the hydrograph, base flow = 100 cfs
EXAMPLE
15.
1 in/hr x2 hours = 2 inches, so 2 inches for a 2 hour
storm. This is twice too big. We want 1 inch total for the
storm, so we must divide each NET hydrograph ordinate
by 2
Draw the Net Hyetograph, and calculate the total direct runoff, in inches, over
the watershed.
Net HyetographOriginal Hyetograph
16.
We removed thebase flow from the gross hydrograph, then divided
each ordinate by two, to get a unit hydrograph for a 2-hour storm.
We have characterized our watershed; now we know how it will
behave in a storm.
18.
Synthetic Unit Hydrograph
•Synthetic hydrographs are derived by
– Relating hydrograph characteristics such as peak
flow, base time etc. with watershed characteristics
such as area and time of concentration.
– Using dimensionless unit hydrograph
– Based on watershed storage
19.
Need for syntheticUH
• UH is applicable only for gauged watershed
and for the point on the stream where data
are measured
• For other locations on the stream in the same
watershed or for nearby (ungauged)
watersheds, synthetic procedures are used.
20.
Snyder’s Method
Snyder’s methodallows the computations of
(a) lag time (tL);
(b) UH duration (tr);
(c) UH peak discharge (qp);
(d) Hydrograph time width at 50% and 75% (W50,
W75) of peak flow
UH
21.
Snyder’s Method
1. Lagtime (tL): time from the center of rainfall –
excess to the UH peak
tL = C1Ct (LLc)0.3
where tL = Time [hrs]; C1 = 0.75 for SI unit; 1.0 for
English unit; Ct = Coefficient which is a function of
watershed slope and shape, 1.8~2.2 (for steeper
slope, Ct is smaller); L = length of the main channel
[mi, km]; Lc = length along the main channel to the
point nearest to the watershed centroid
UH
22.
Snyder’s Method
2. UHDuration (tr):
tr = tL / 5.5
where tr and tL are in [hrs]. If the duration of UH is other than tr, then the
lag time needs to be adjusted as
tpL = tL + 0.25 (tR - tr)
where tLR = adjusted lag time; tR = desired UH duration.
3. UH Peak Discharge (qp):
or
where C2 = 2.75 for SI unit; 640 for English unit; Cp = coefficient
accounting for flood wave and storage condition, 0.4 ~ 0.8;
qp = specific discharge, [m3/s/km2] or [ft3/s/mi2]
To compute actual discharge, Qp = Aqp
UH
p
t
p
C
2
C
p
q
pR
t
p
C
2
C
p
q
23.
Snyder’s Method
4. TimeBase (tb):
Assuming triangular UH,
tb = C3 / qp
where tb – [hrs]; C3 = 5.56 for SI unit, 1290 for English unit.
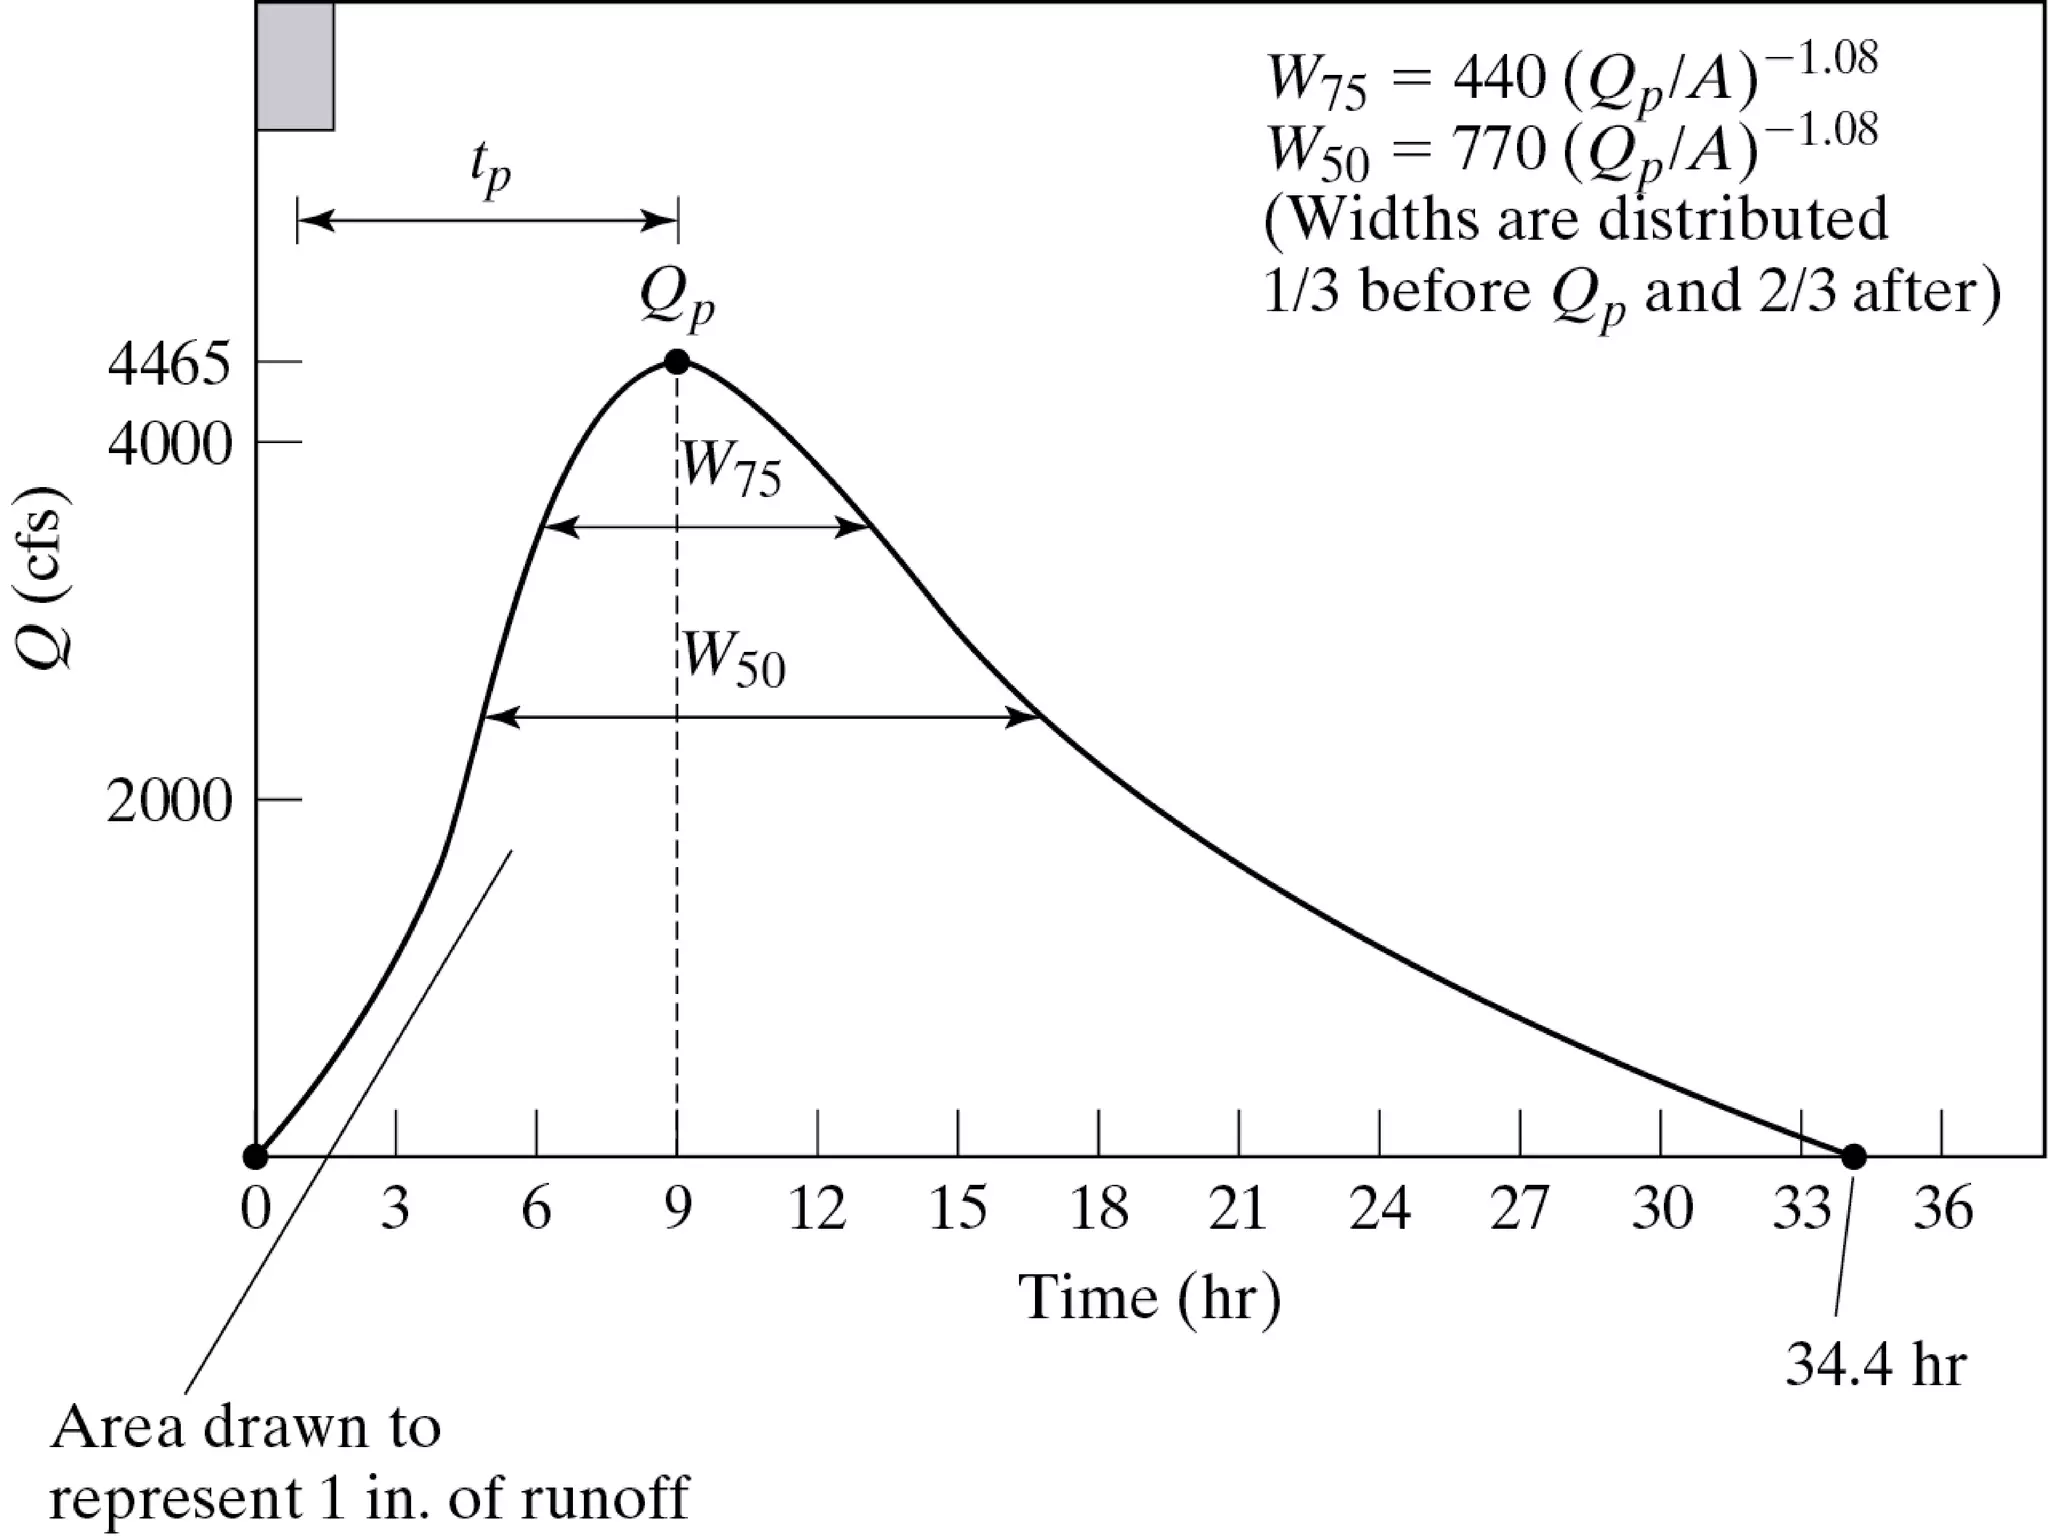
5. UH Widths: or
where
CW, 75 = 1.22 for SI unit; 440 for English unit;
CW, 50 = 2.14 for SI unit; 770 for English unit;.
W50, W75 are in hours; Usually, 1/3 of the width is distributed before UH
peak and 2/3 after the peak
Remember to check that the volume of UH is close to 1 cm or 1 inch
UH
1.08
p
q
w,75
C
75
W
1.08
p
q
w,50
C
50
W
24.
Use Snyder’s methodto develop a UH for the area
of 100mi2 described below. Sketch the appropriate
shape. What duration rainfall does this correspond
to?
Ct = 1.8, L= 18mi, Cp = 0.6, Lc= 10mi
EXAMPLE:
25.
Calculate tp
tp =tl= Ct(LLC)^0.3
= 1.8(18·10) 0.3 hr,
= 8.6
Calculate Qp
Qp= 640(cp)(A)/tp
= 640(0.6)(100)/8.6
= 4465 cfs
since this is a small watershed,
Tb ≈4tp = 4(8.6)
= 34.4 hr
Duration of rainfall
D= tp/5.5 hr
= 8.6/5.5 hr
= 1.6 hr
SOLUTION


![Snyder’s Method
1. Lag time (tL): time from the center of rainfall –
excess to the UH peak
tL = C1Ct (LLc)0.3
where tL = Time [hrs]; C1 = 0.75 for SI unit; 1.0 for
English unit; Ct = Coefficient which is a function of
watershed slope and shape, 1.8~2.2 (for steeper
slope, Ct is smaller); L = length of the main channel
[mi, km]; Lc = length along the main channel to the
point nearest to the watershed centroid
UH](https://image.slidesharecdn.com/hydrograph-150701042332-lva1-app6891/75/Hydrograph-21-2048.jpg)
![Snyder’s Method
2. UH Duration (tr):
tr = tL / 5.5
where tr and tL are in [hrs]. If the duration of UH is other than tr, then the
lag time needs to be adjusted as
tpL = tL + 0.25 (tR - tr)
where tLR = adjusted lag time; tR = desired UH duration.
3. UH Peak Discharge (qp):
or
where C2 = 2.75 for SI unit; 640 for English unit; Cp = coefficient
accounting for flood wave and storage condition, 0.4 ~ 0.8;
qp = specific discharge, [m3/s/km2] or [ft3/s/mi2]
To compute actual discharge, Qp = Aqp
UH
p
t
p
C
2
C
p
q
pR
t
p
C
2
C
p
q ](https://image.slidesharecdn.com/hydrograph-150701042332-lva1-app6891/75/Hydrograph-22-2048.jpg)
![Snyder’s Method
4. Time Base (tb):
Assuming triangular UH,
tb = C3 / qp
where tb – [hrs]; C3 = 5.56 for SI unit, 1290 for English unit.
5. UH Widths: or
where
CW, 75 = 1.22 for SI unit; 440 for English unit;
CW, 50 = 2.14 for SI unit; 770 for English unit;.
W50, W75 are in hours; Usually, 1/3 of the width is distributed before UH
peak and 2/3 after the peak
Remember to check that the volume of UH is close to 1 cm or 1 inch
UH
1.08
p
q
w,75
C
75
W
1.08
p
q
w,50
C
50
W ](https://image.slidesharecdn.com/hydrograph-150701042332-lva1-app6891/75/Hydrograph-23-2048.jpg)