


![Getting Rid of the NA’s
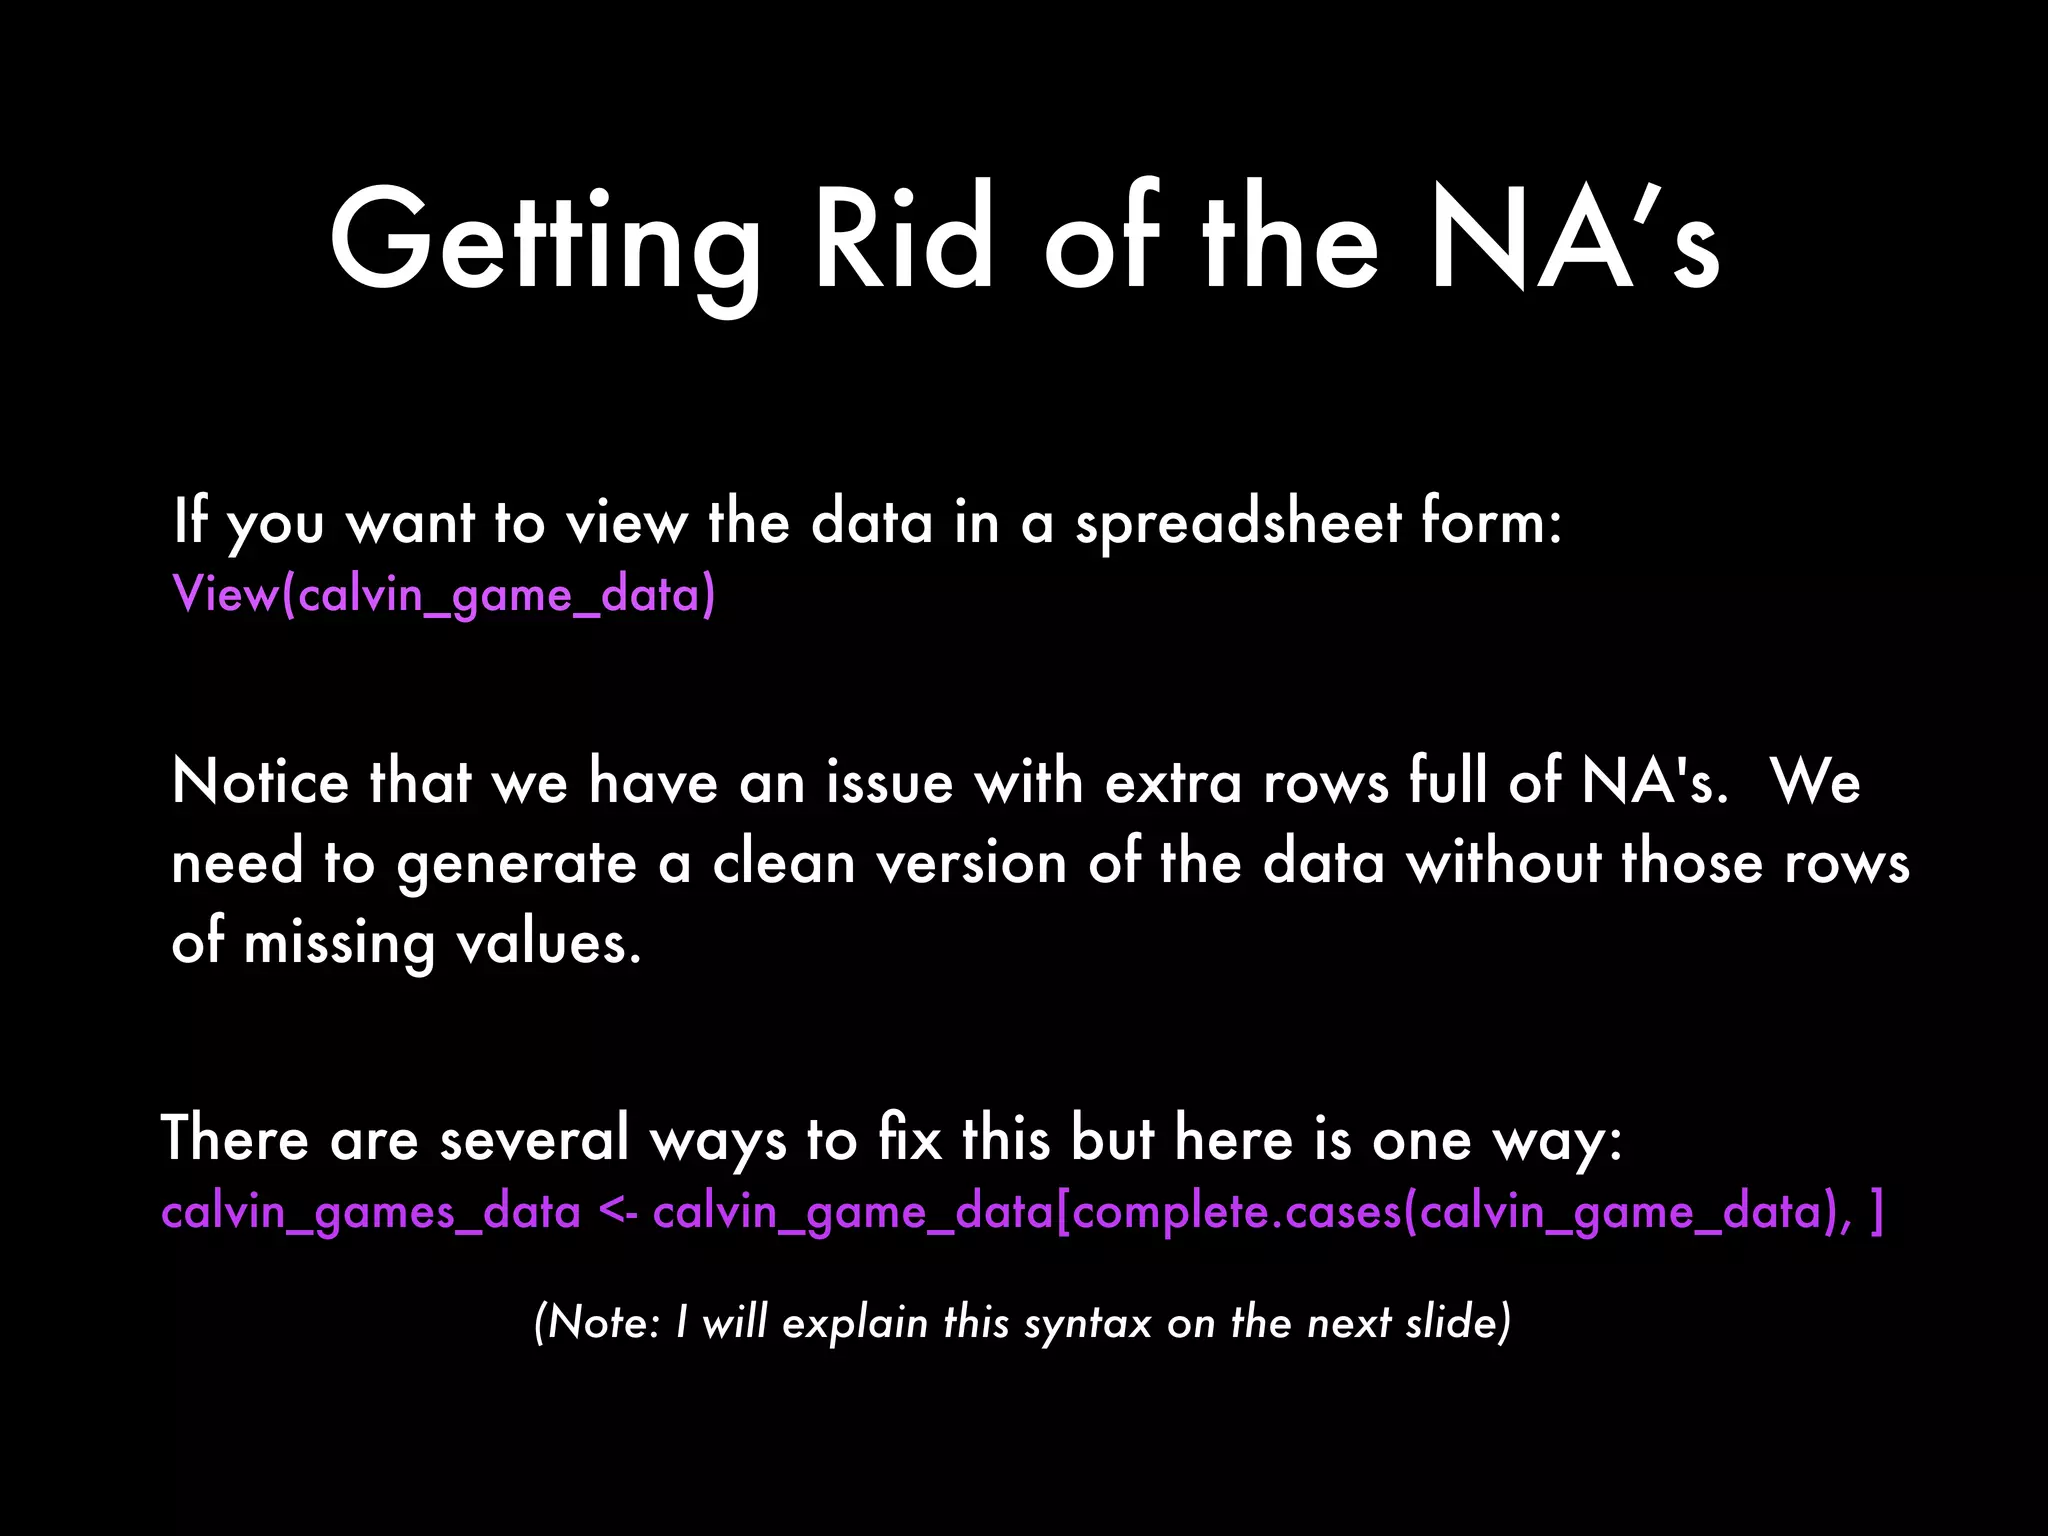
If you want to view the data in a spreadsheet form:
View(calvin_game_data)
Notice that we have an issue with extra rows full of NA's. We
need to generate a clean version of the data without those rows
of missing values.
There are several ways to fix this but here is one way:
calvin_games_data <- calvin_game_data[complete.cases(calvin_game_data), ]
(Note: I will explain this syntax on the next slide)](https://image.slidesharecdn.com/qmethodsrbootcamp-2013fallfinal-131027230440-phpapp01/75/Quantitative-Methods-for-Lawyers-Class-14-R-Boot-Camp-Part-1-Professor-Daniel-Martin-Katz-38-2048.jpg)
![Getting Rid of the NA’s
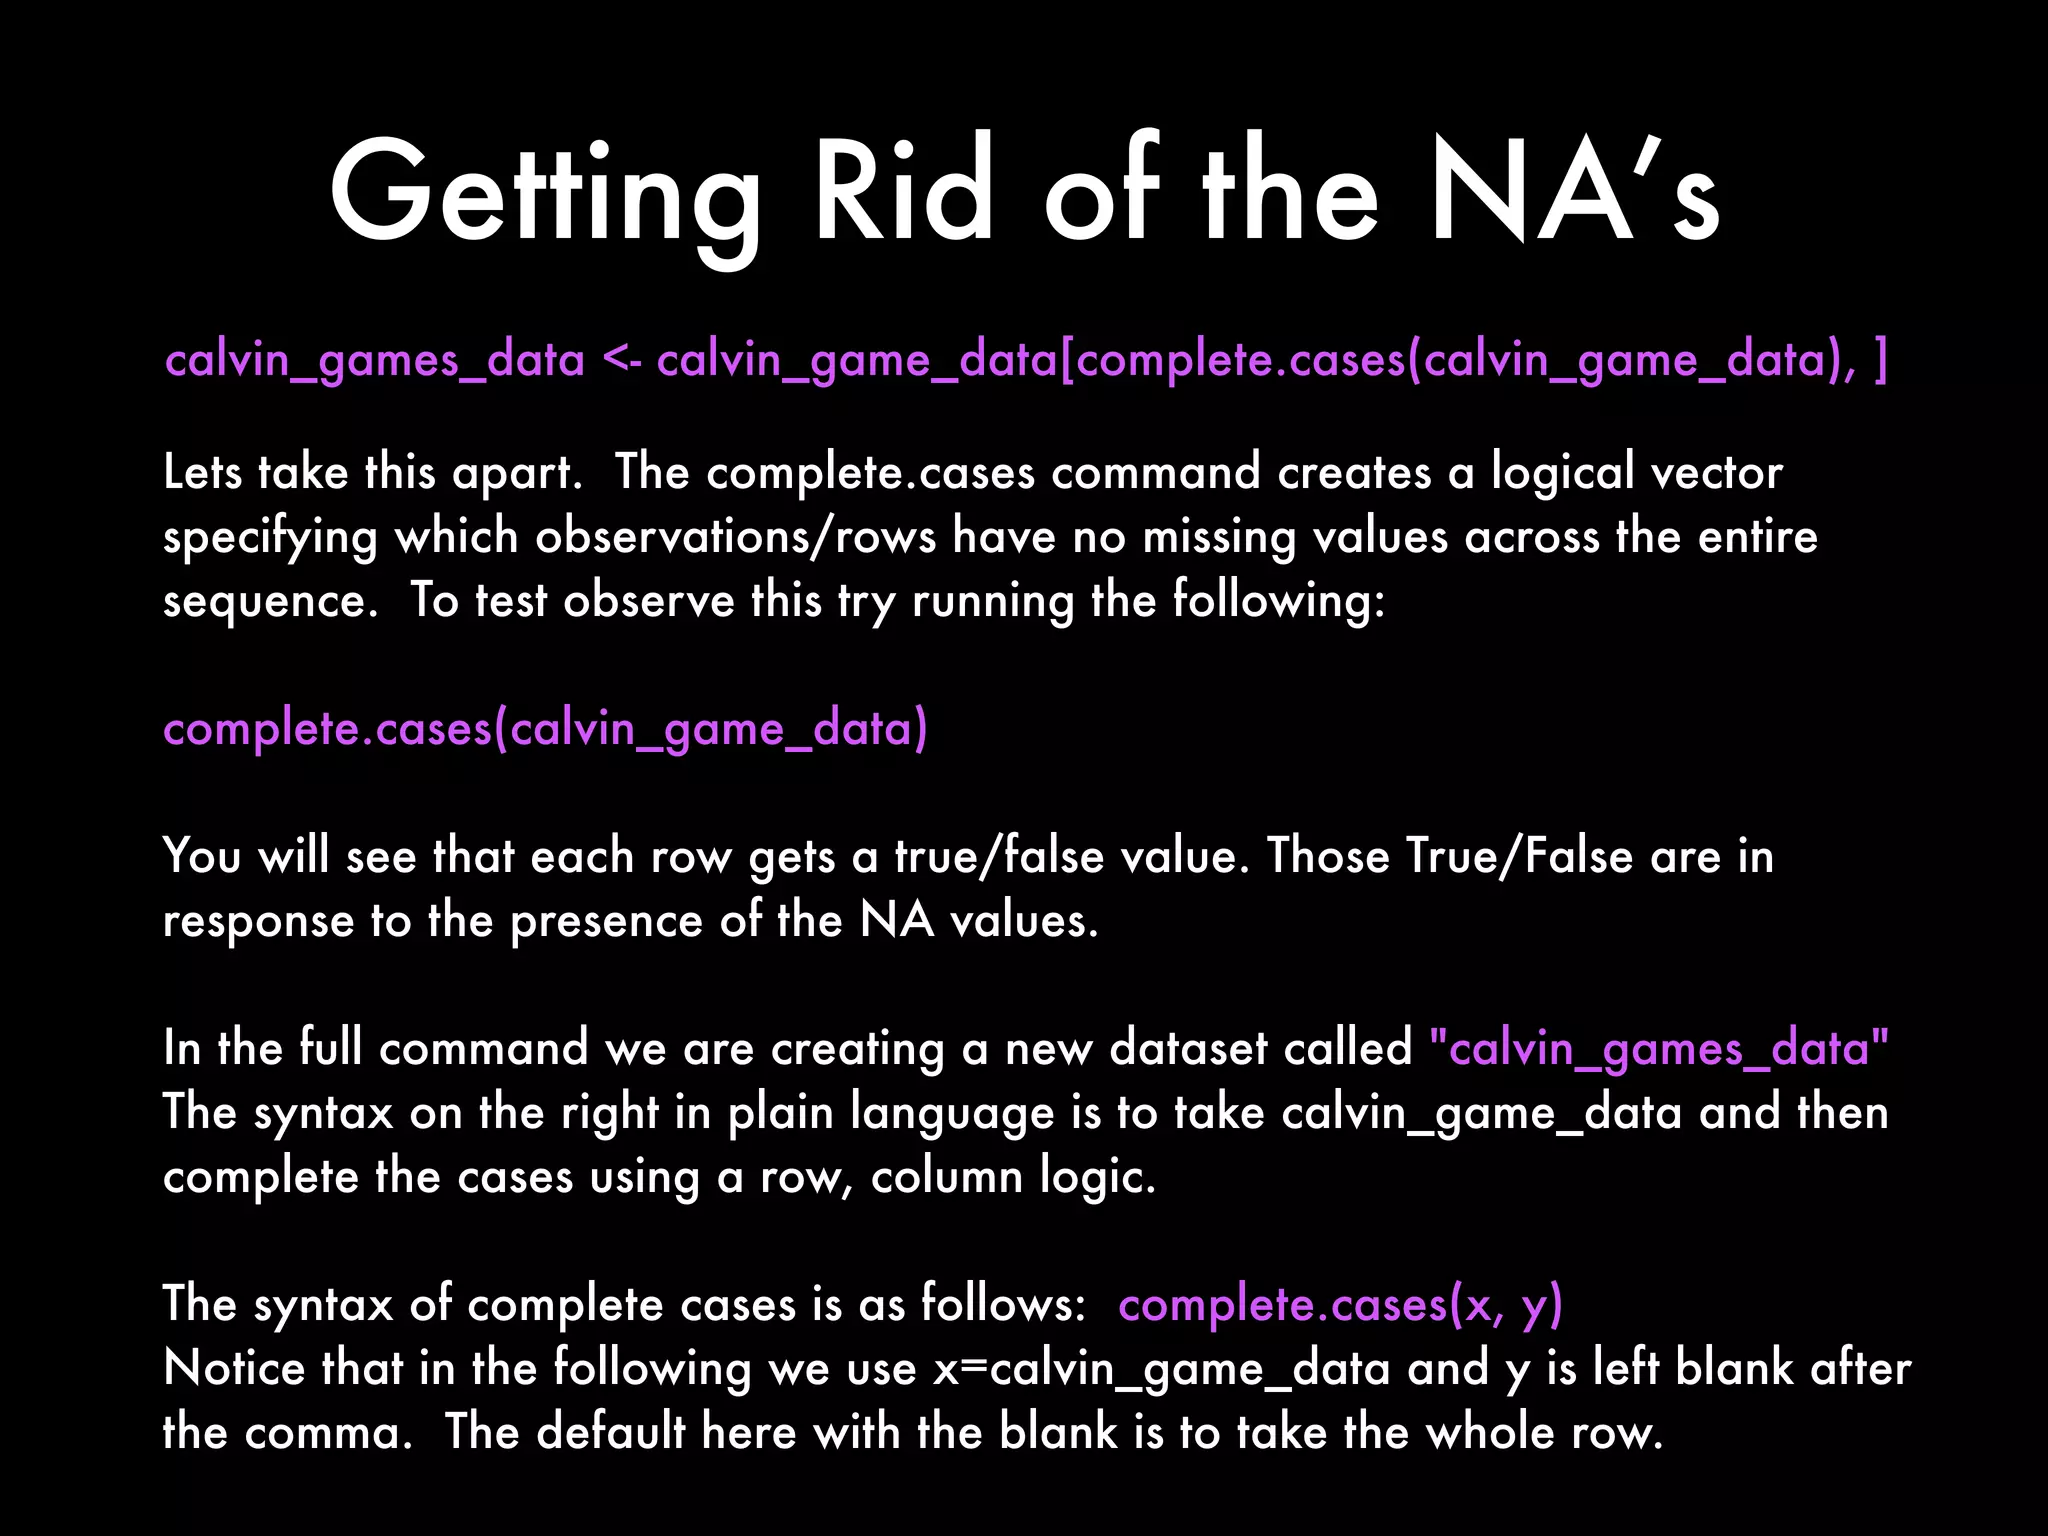
Lets take this apart. The complete.cases command creates a logical vector
specifying which observations/rows have no missing values across the entire
sequence. To test observe this try running the following:
complete.cases(calvin_game_data)
You will see that each row gets a true/false value. Those True/False are in
response to the presence of the NA values.
In the full command we are creating a new dataset called "calvin_games_data"
The syntax on the right in plain language is to take calvin_game_data and then
complete the cases using a row, column logic.
The syntax of complete cases is as follows: complete.cases(x, y)
Notice that in the following we use x=calvin_game_data and y is left blank after
the comma. The default here with the blank is to take the whole row.
calvin_games_data <- calvin_game_data[complete.cases(calvin_game_data), ]](https://image.slidesharecdn.com/qmethodsrbootcamp-2013fallfinal-131027230440-phpapp01/75/Quantitative-Methods-for-Lawyers-Class-14-R-Boot-Camp-Part-1-Professor-Daniel-Martin-Katz-39-2048.jpg)
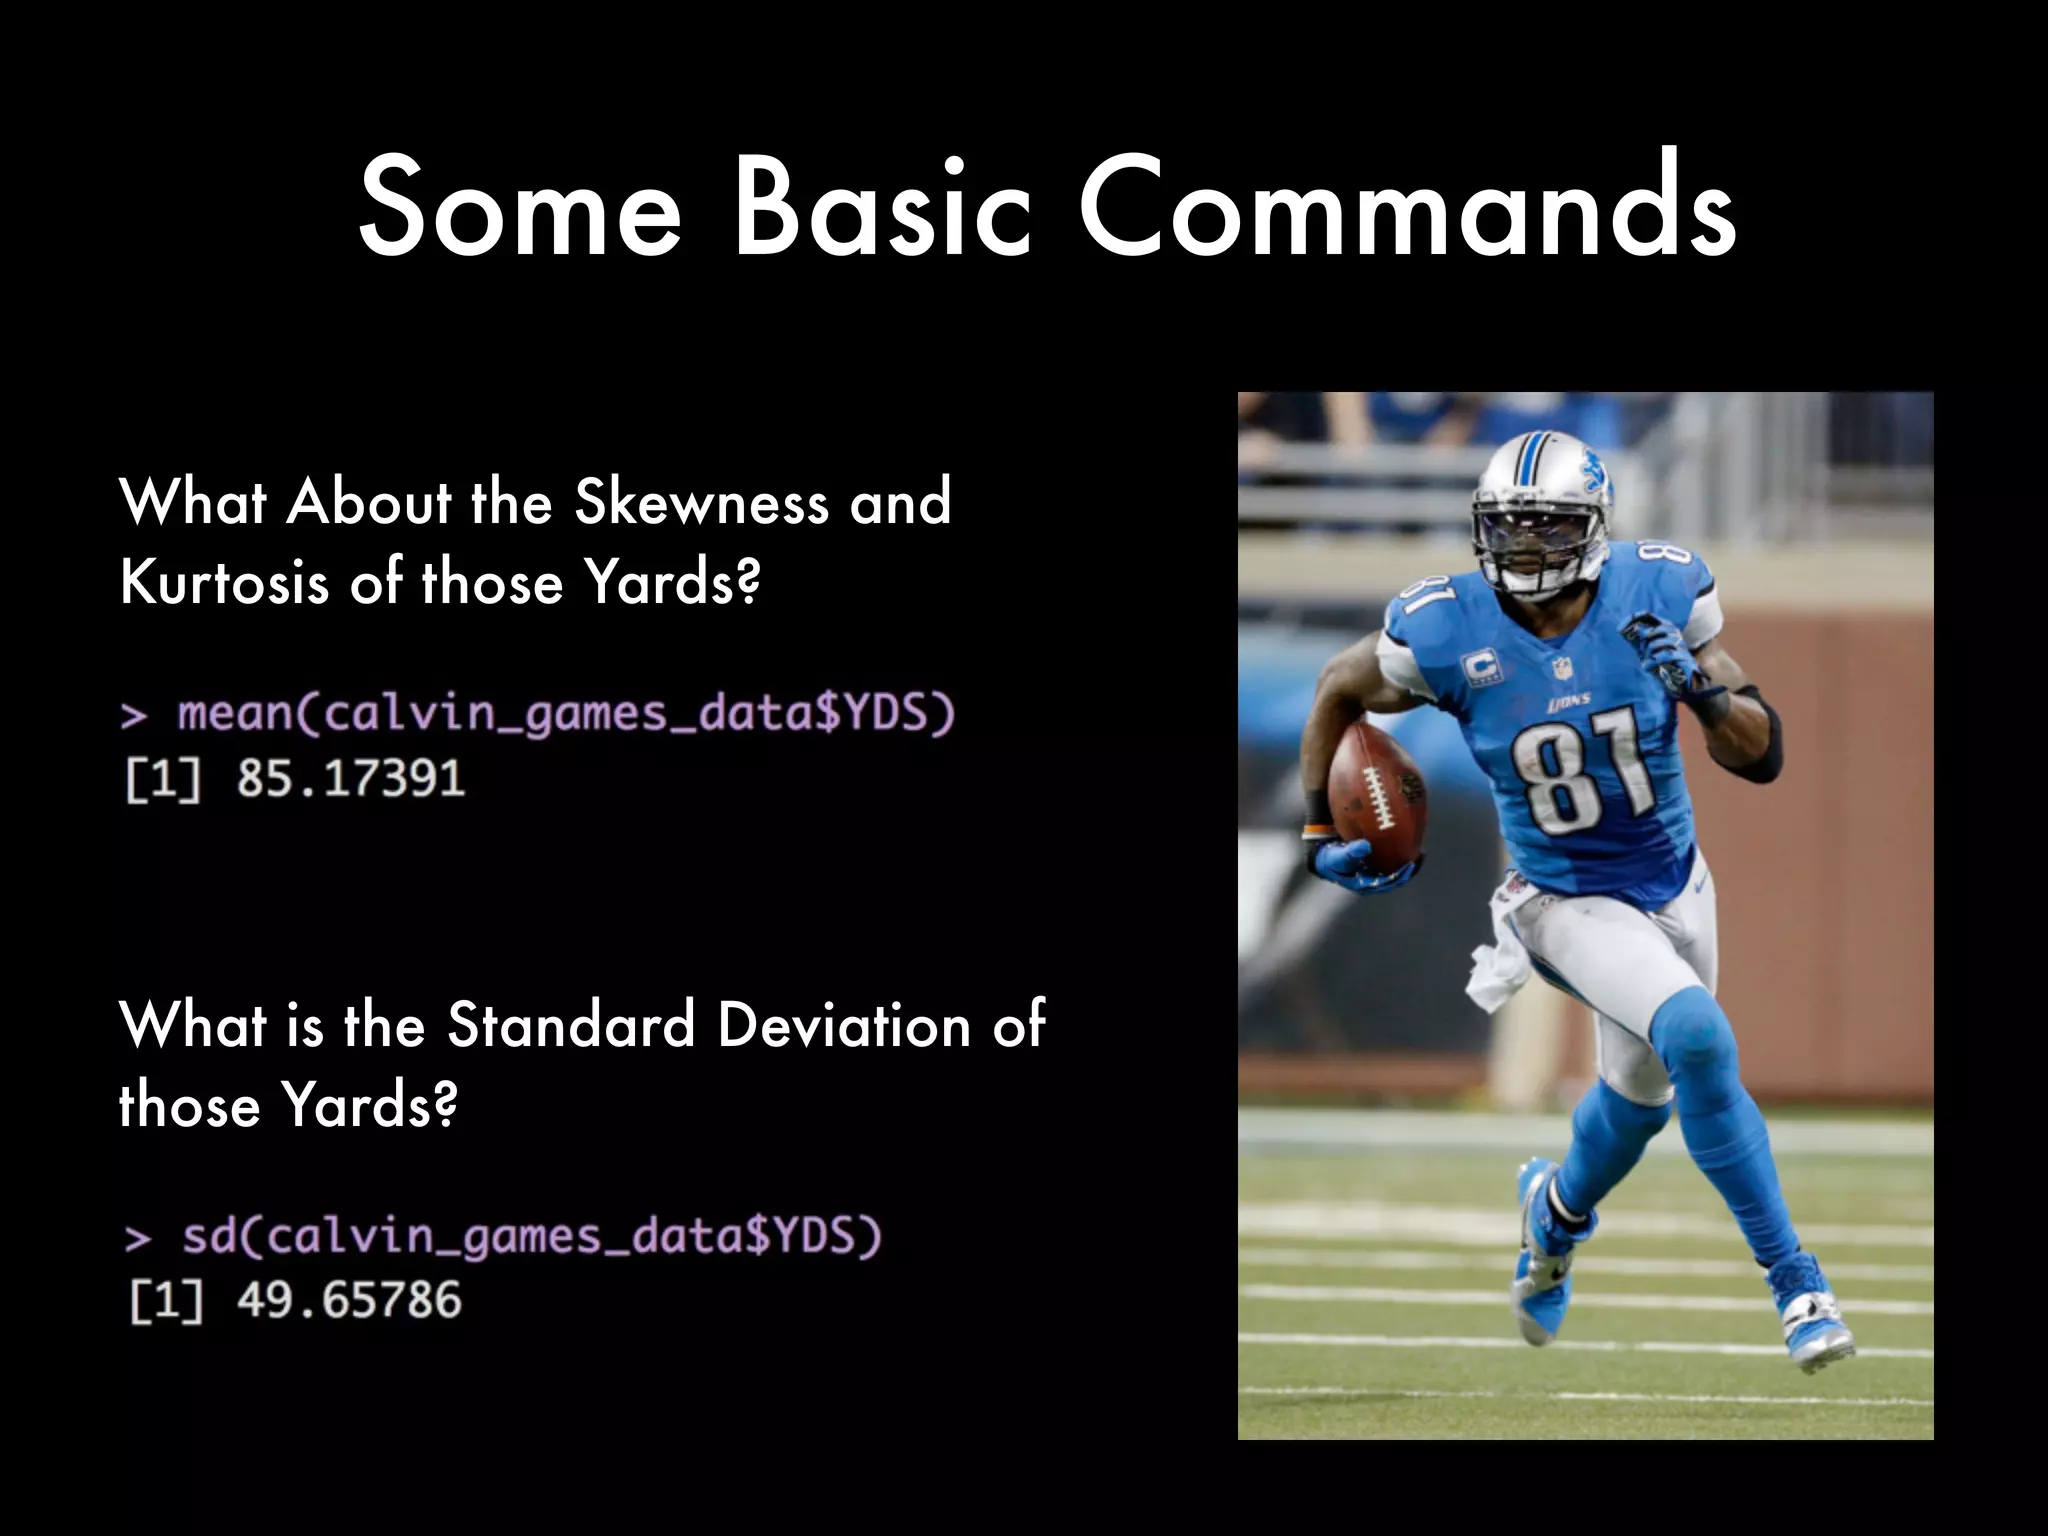
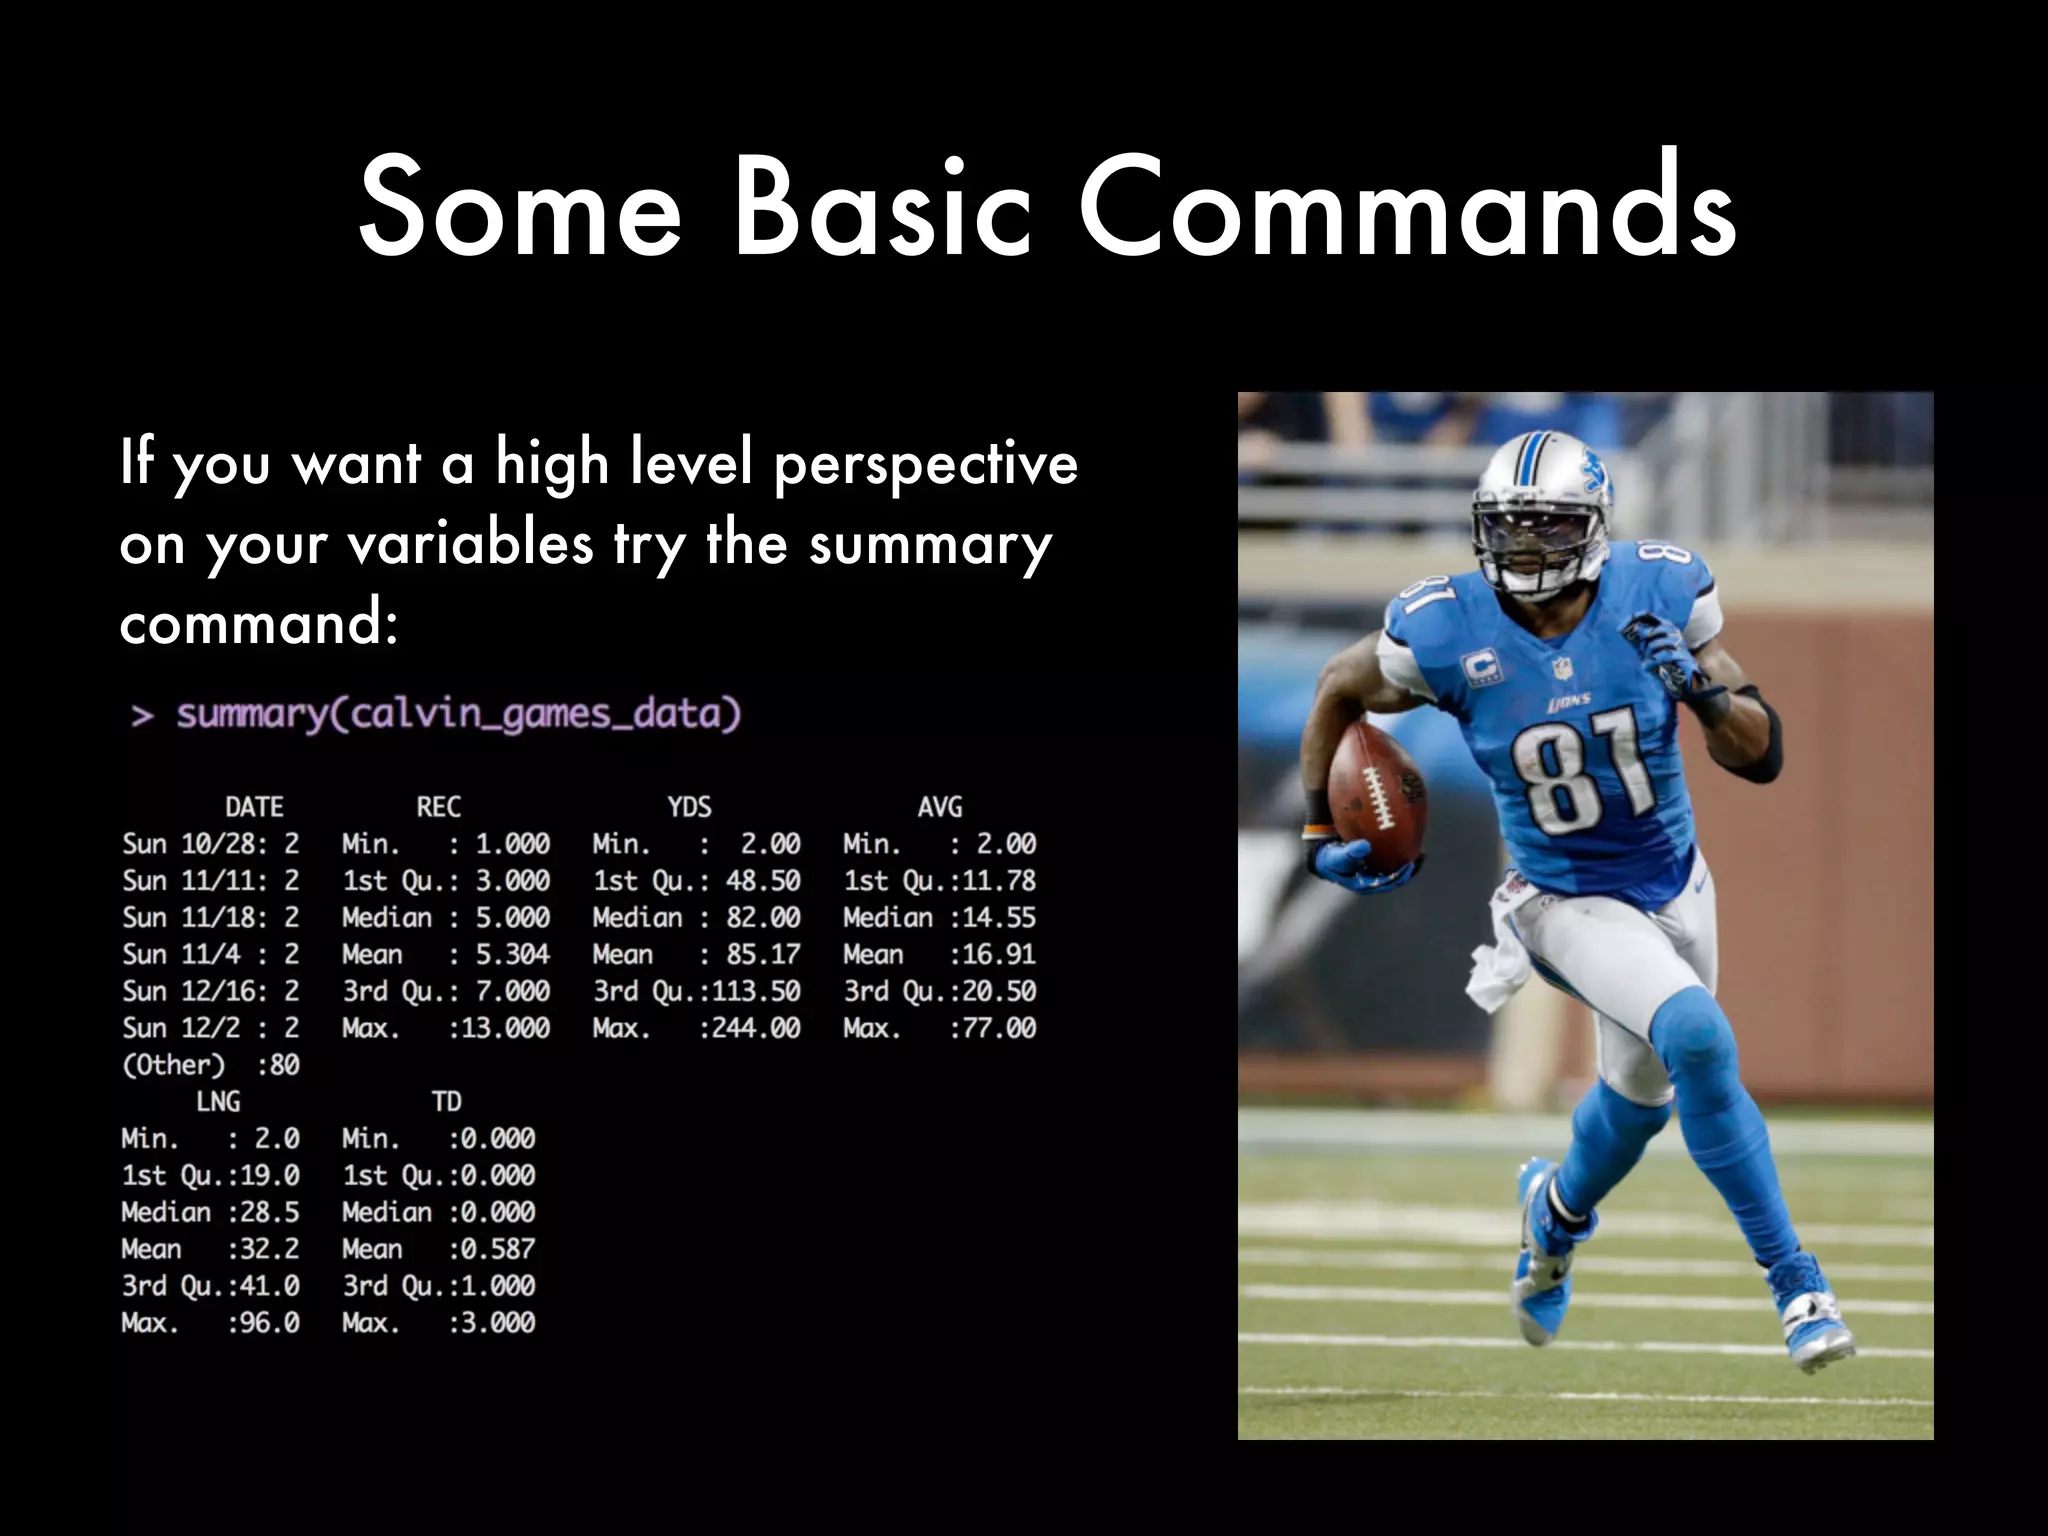
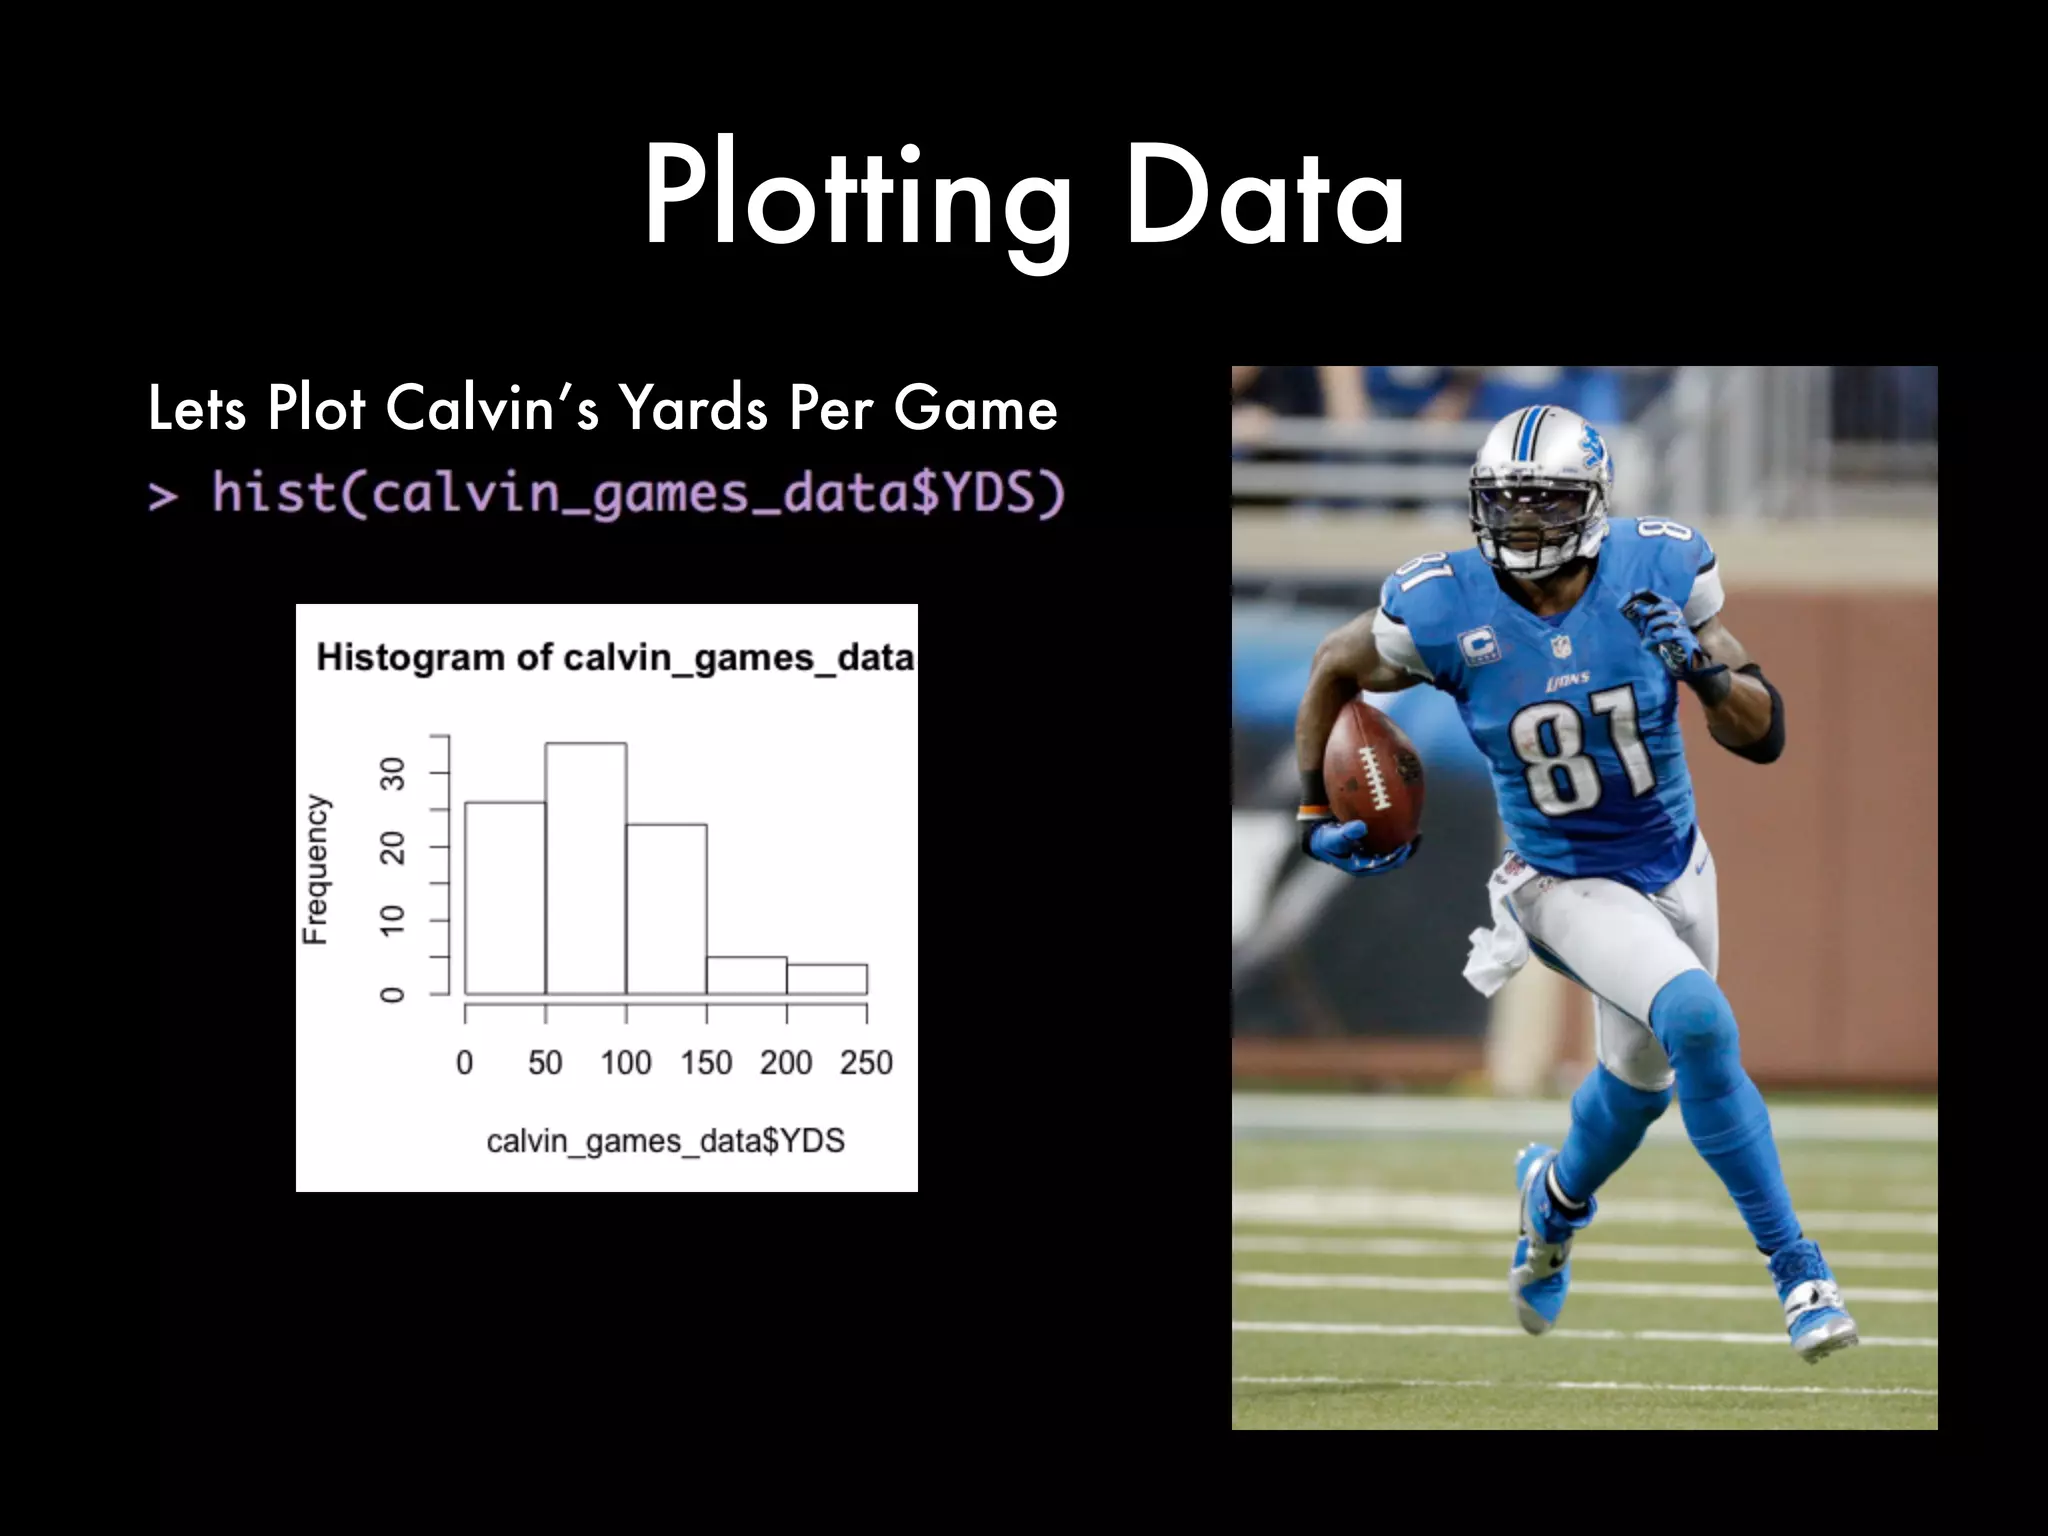
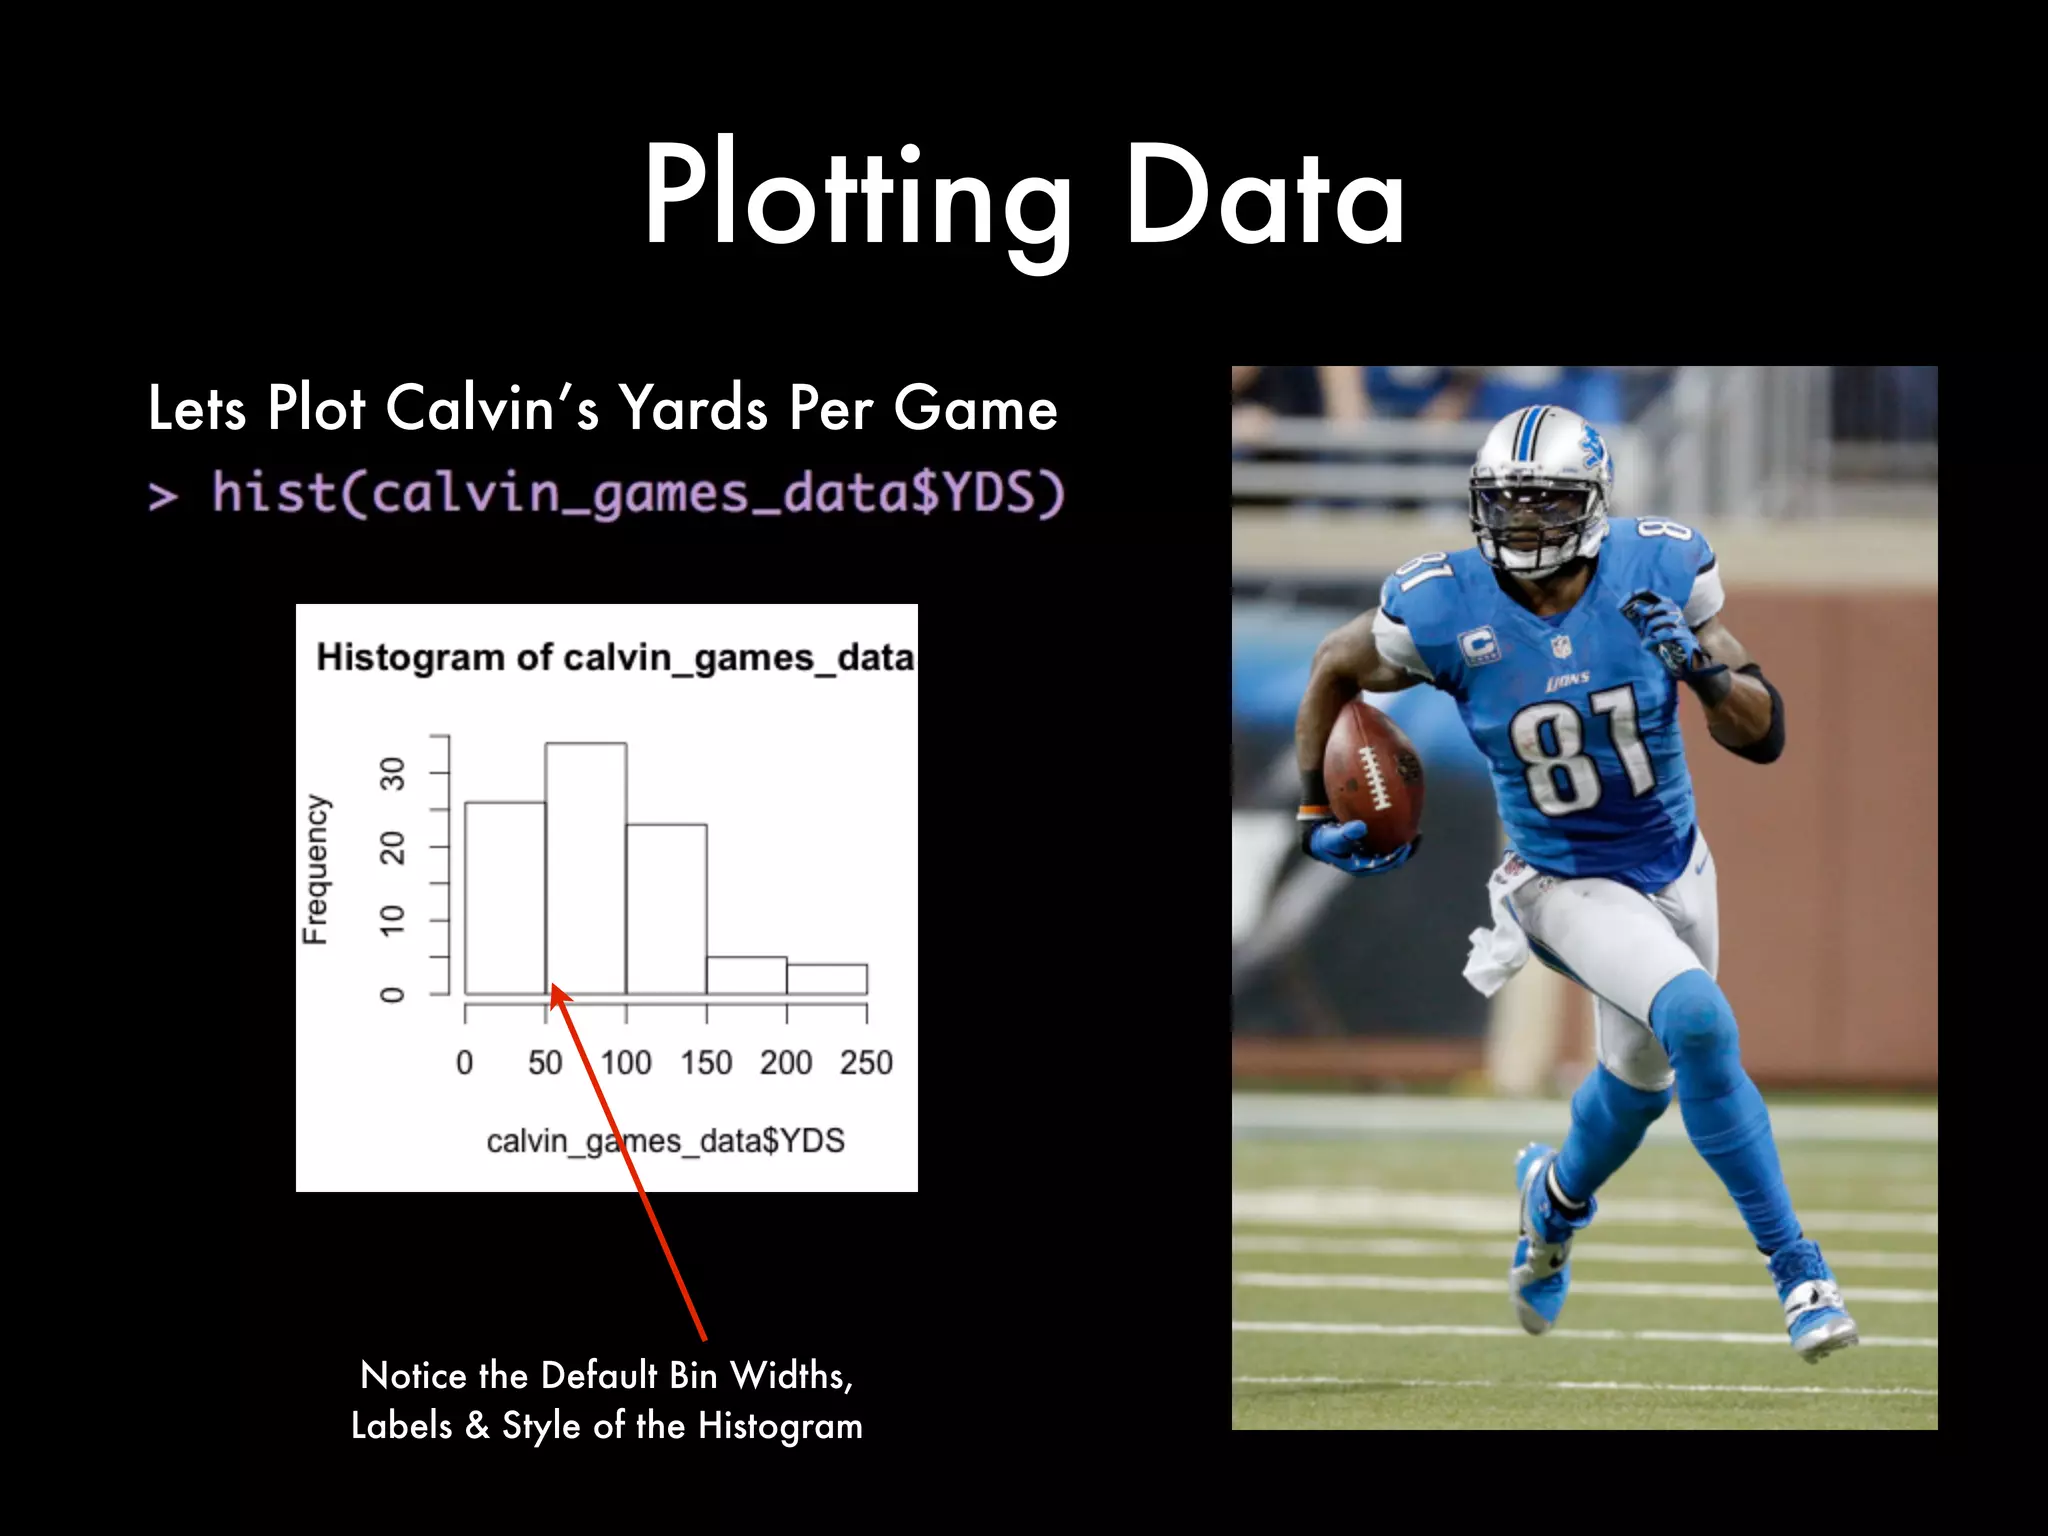
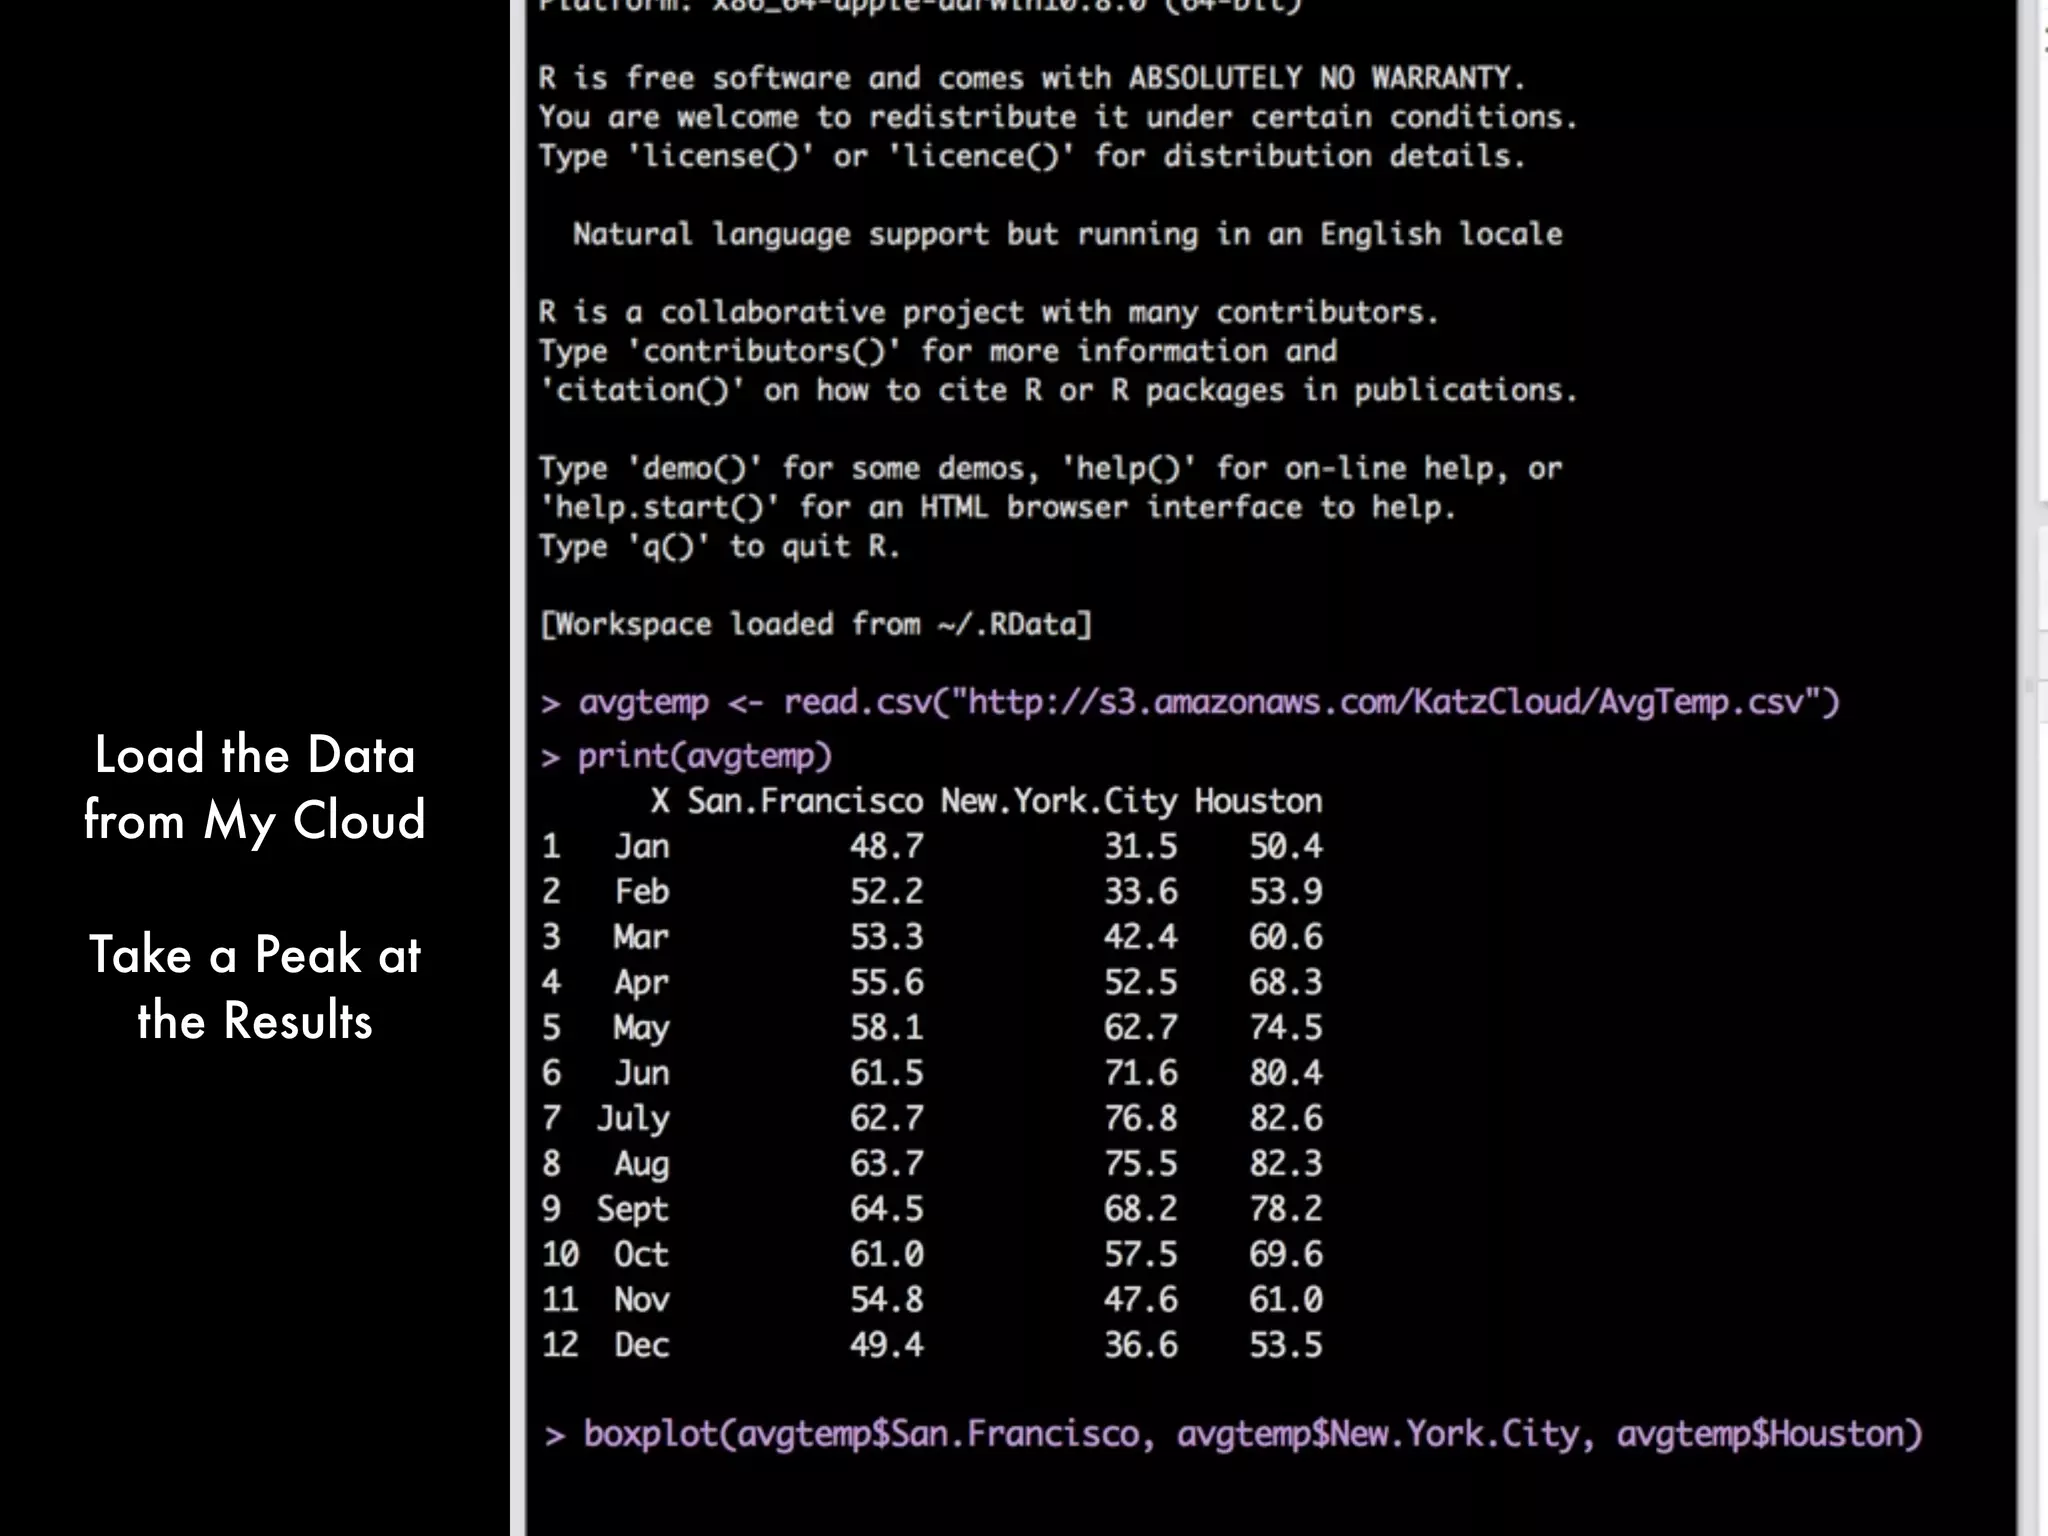
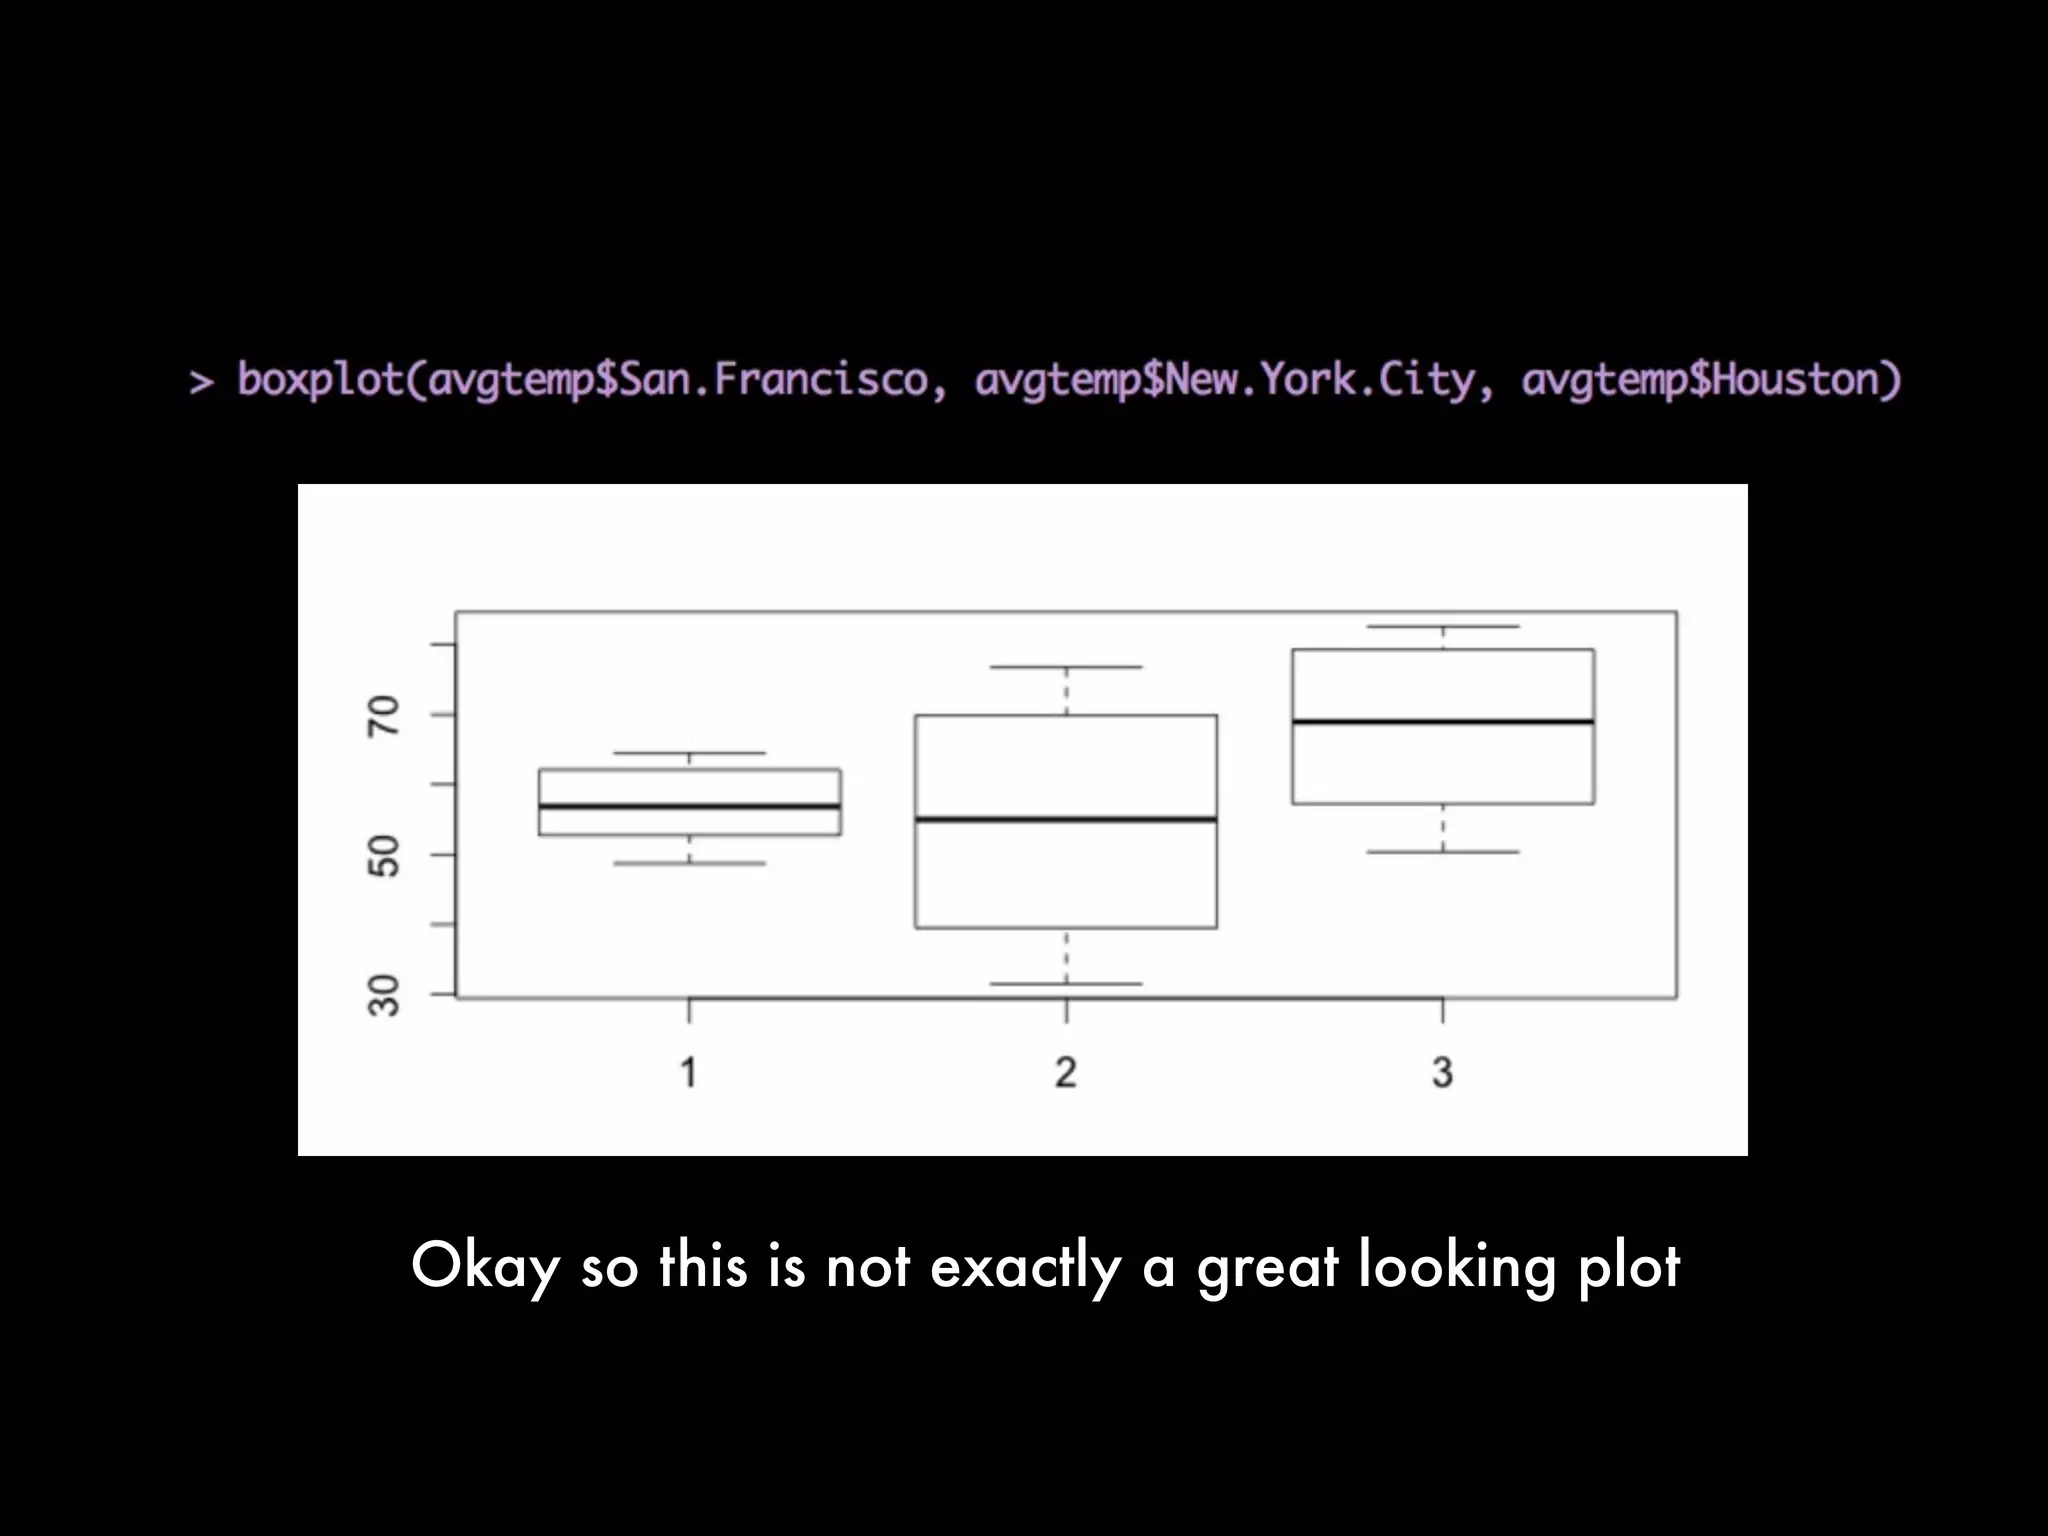


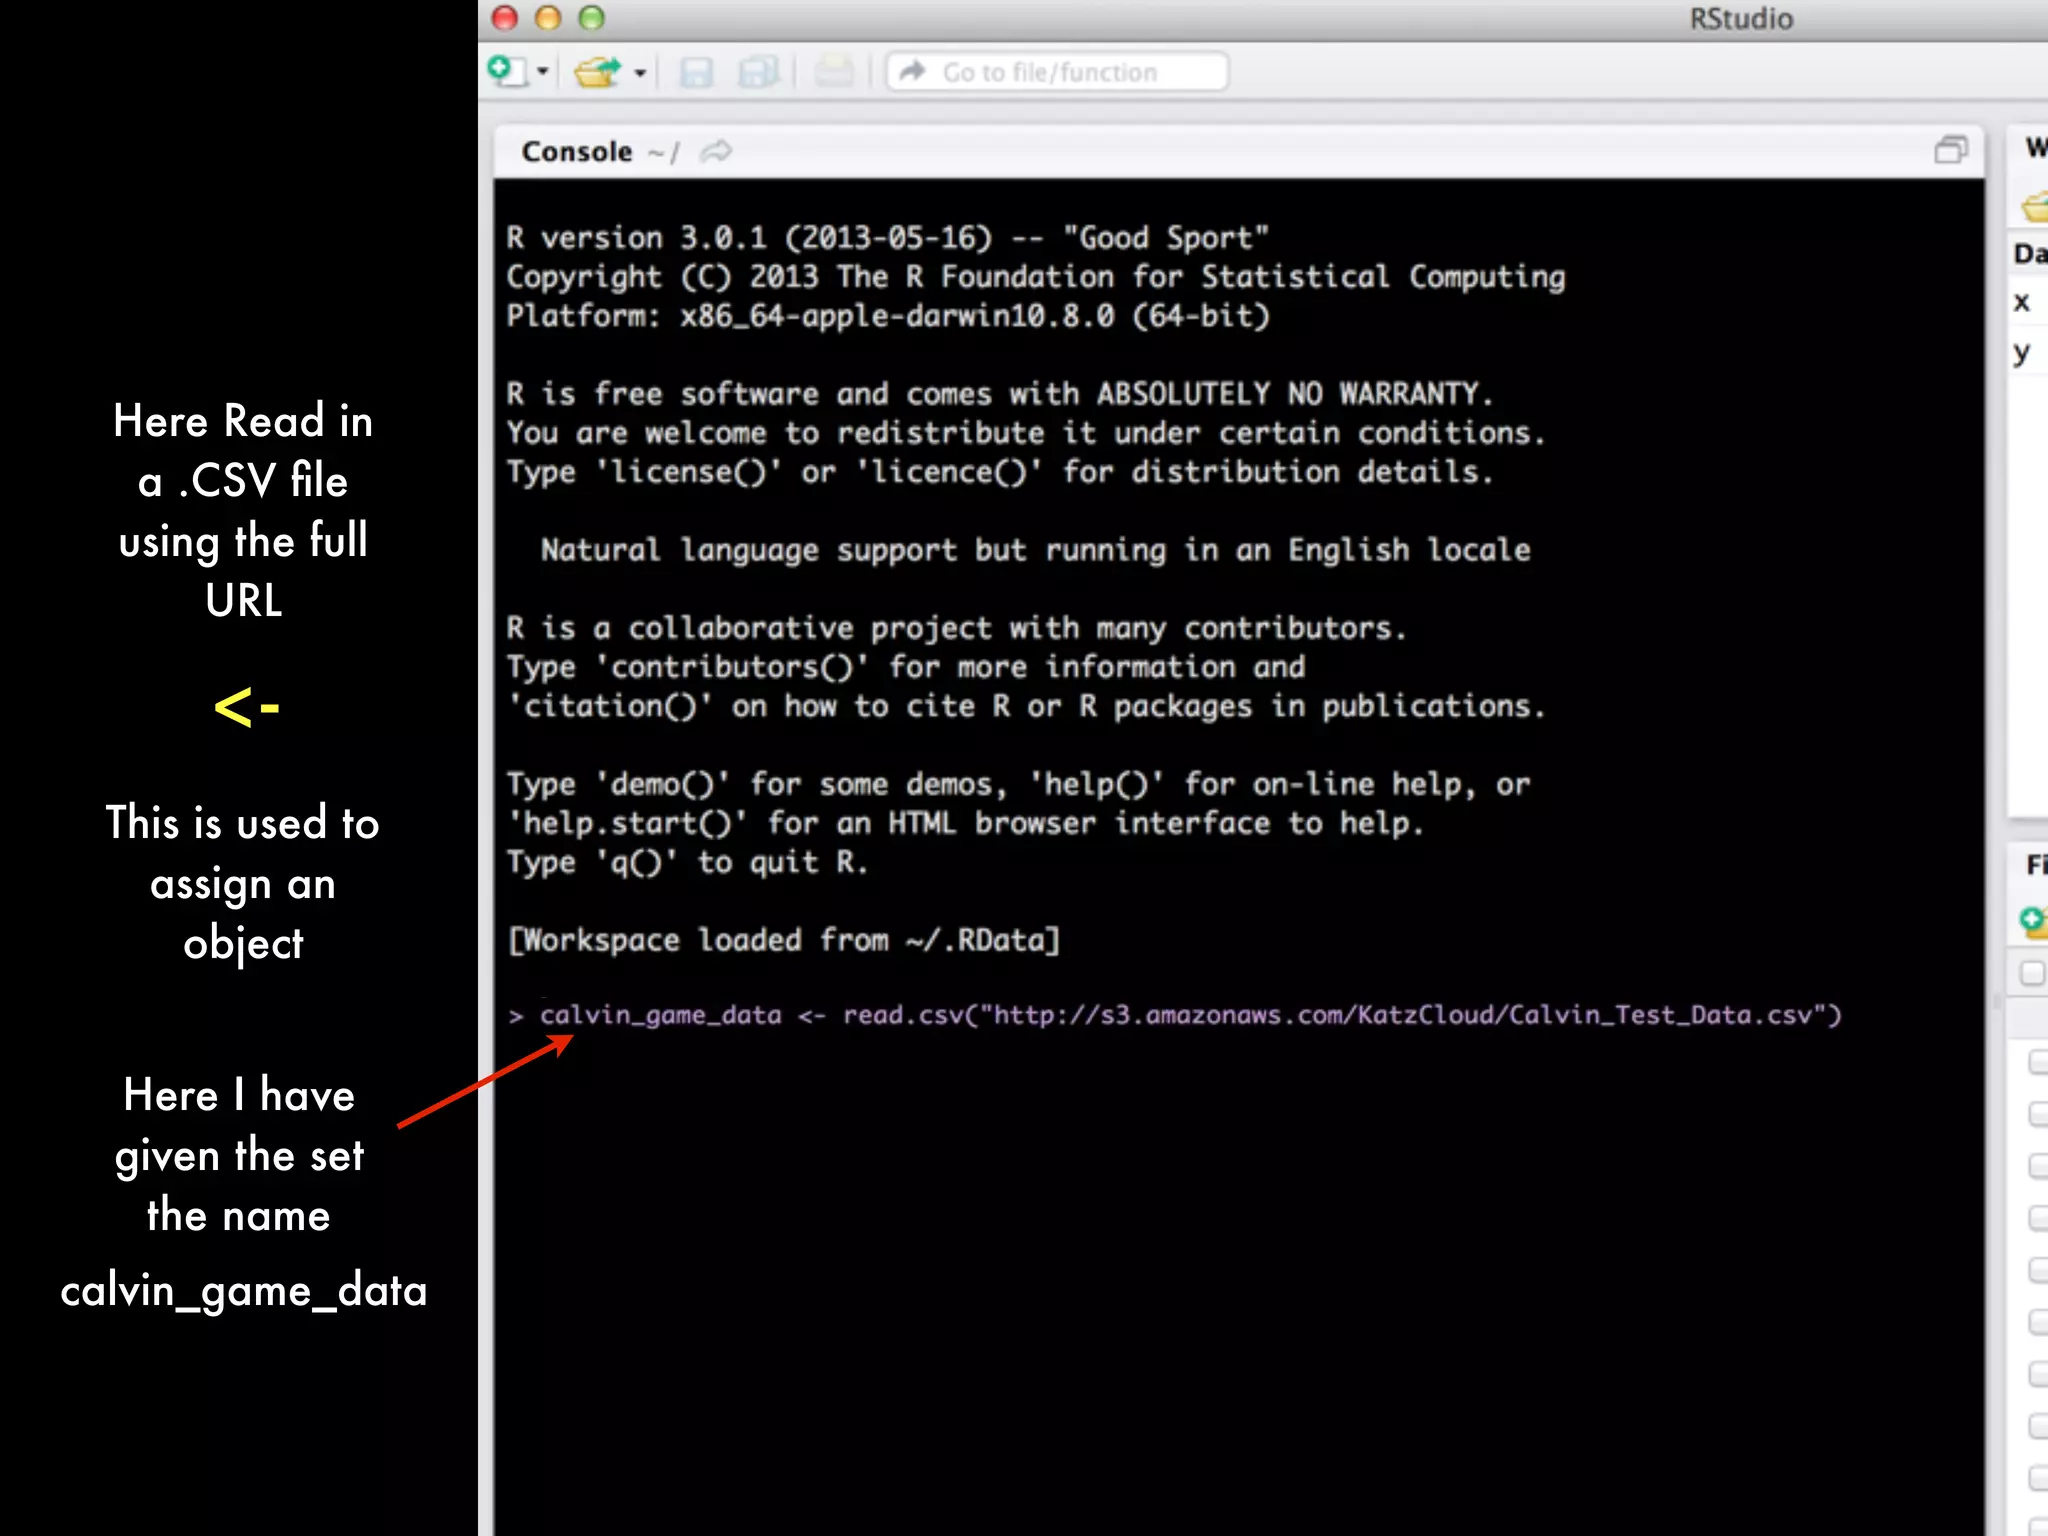
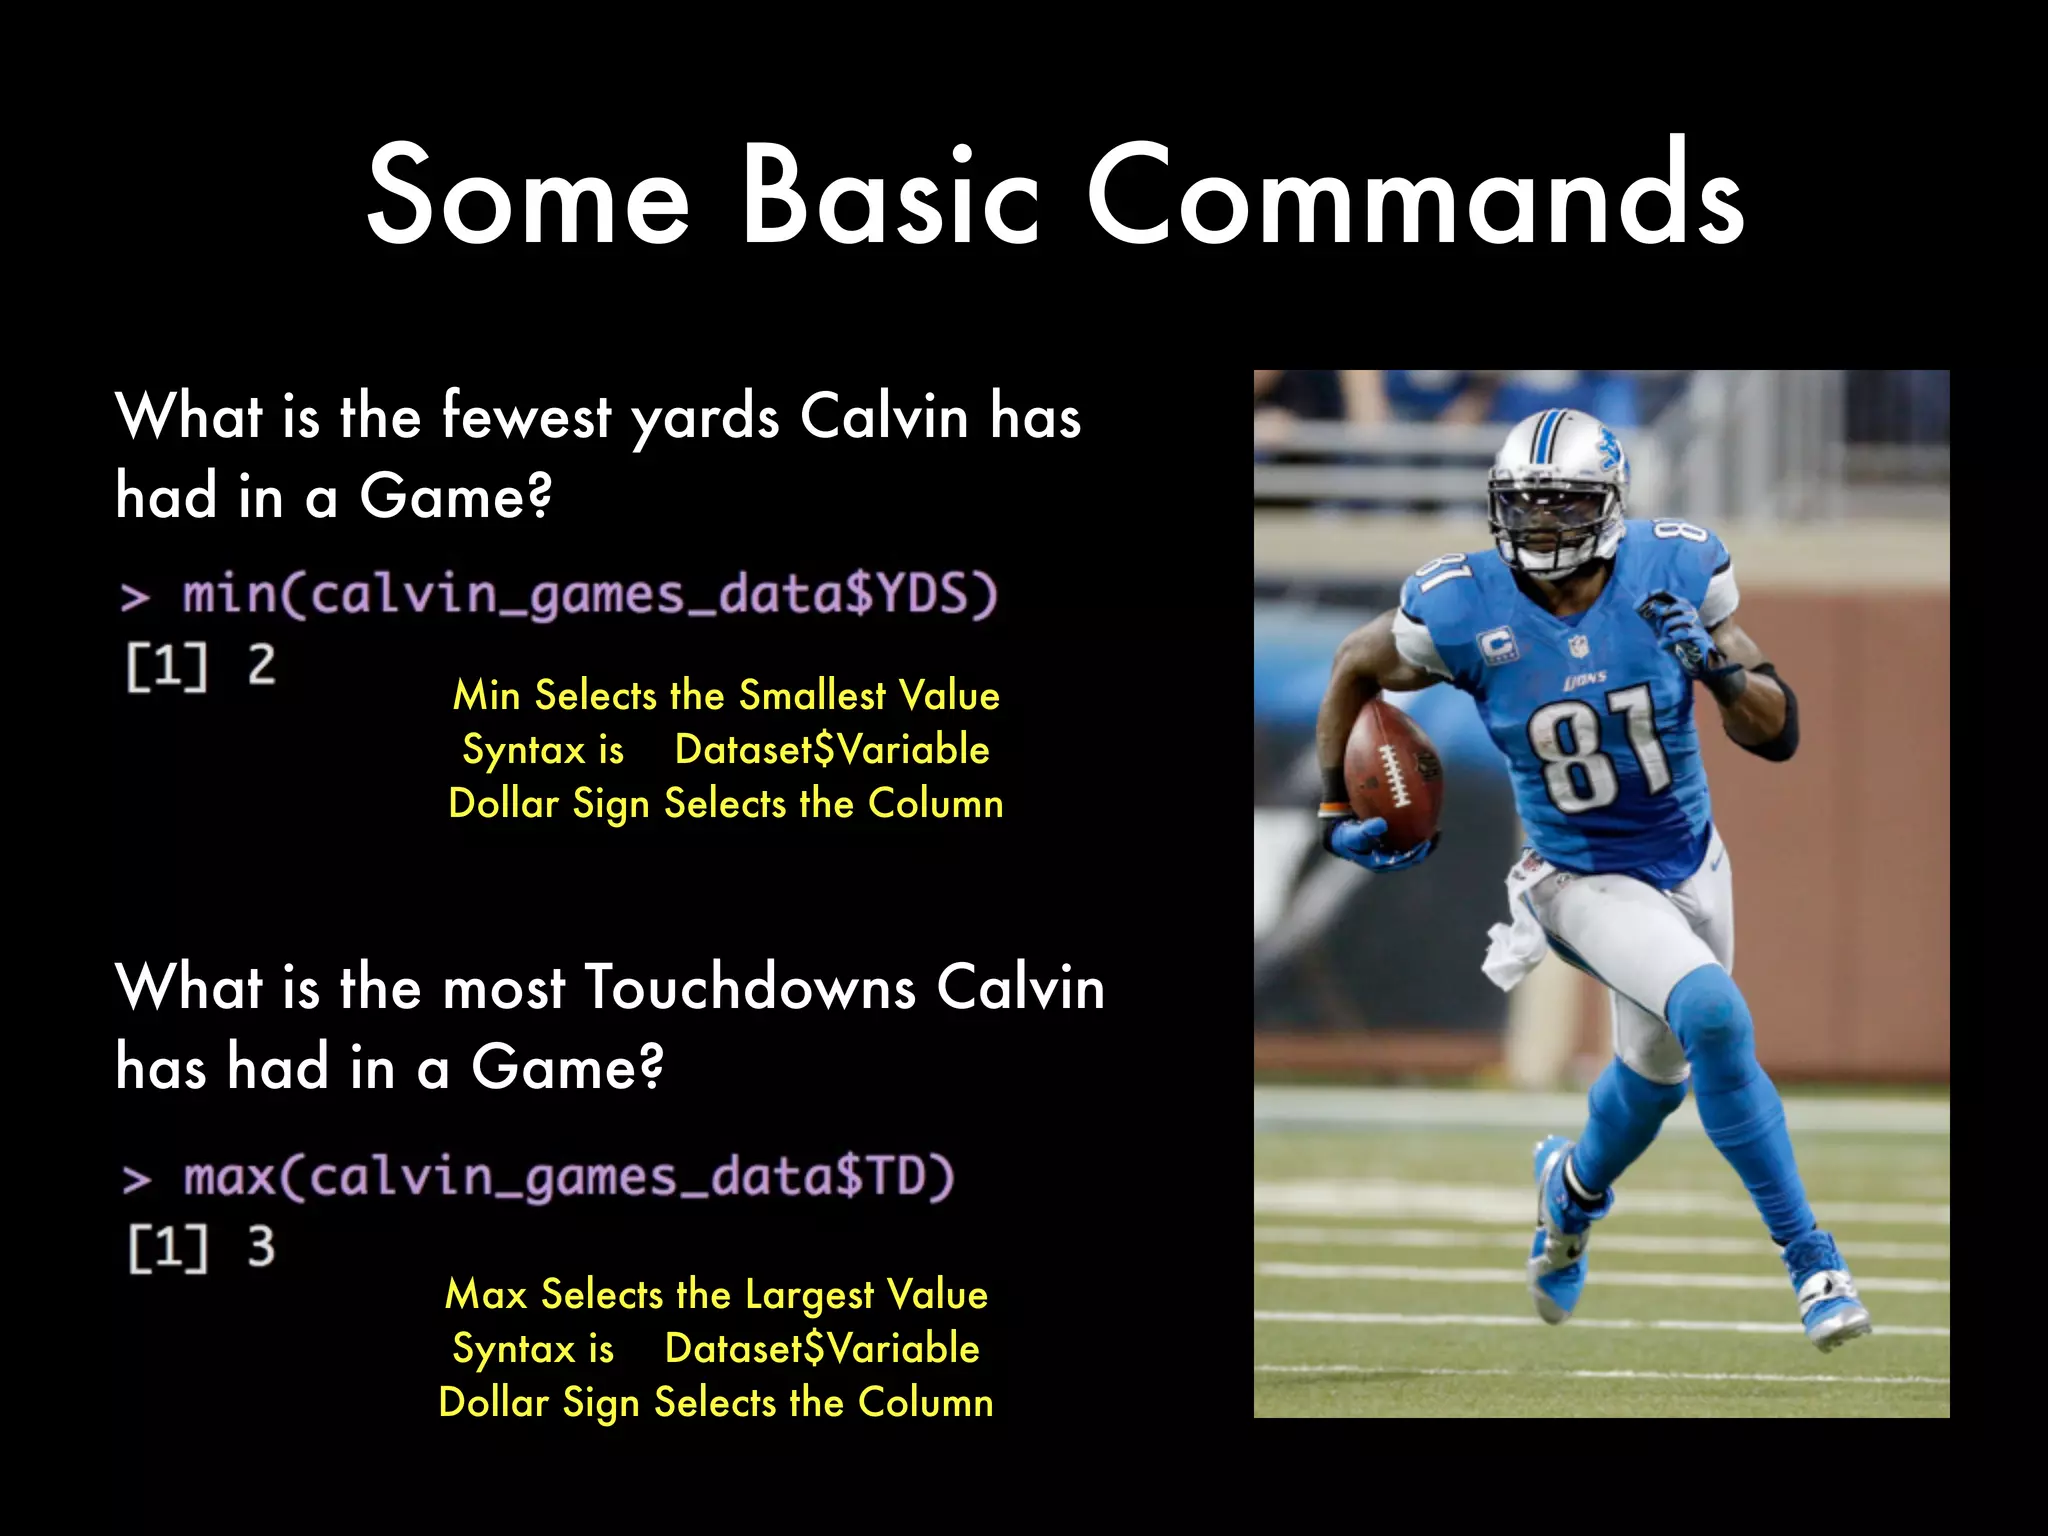
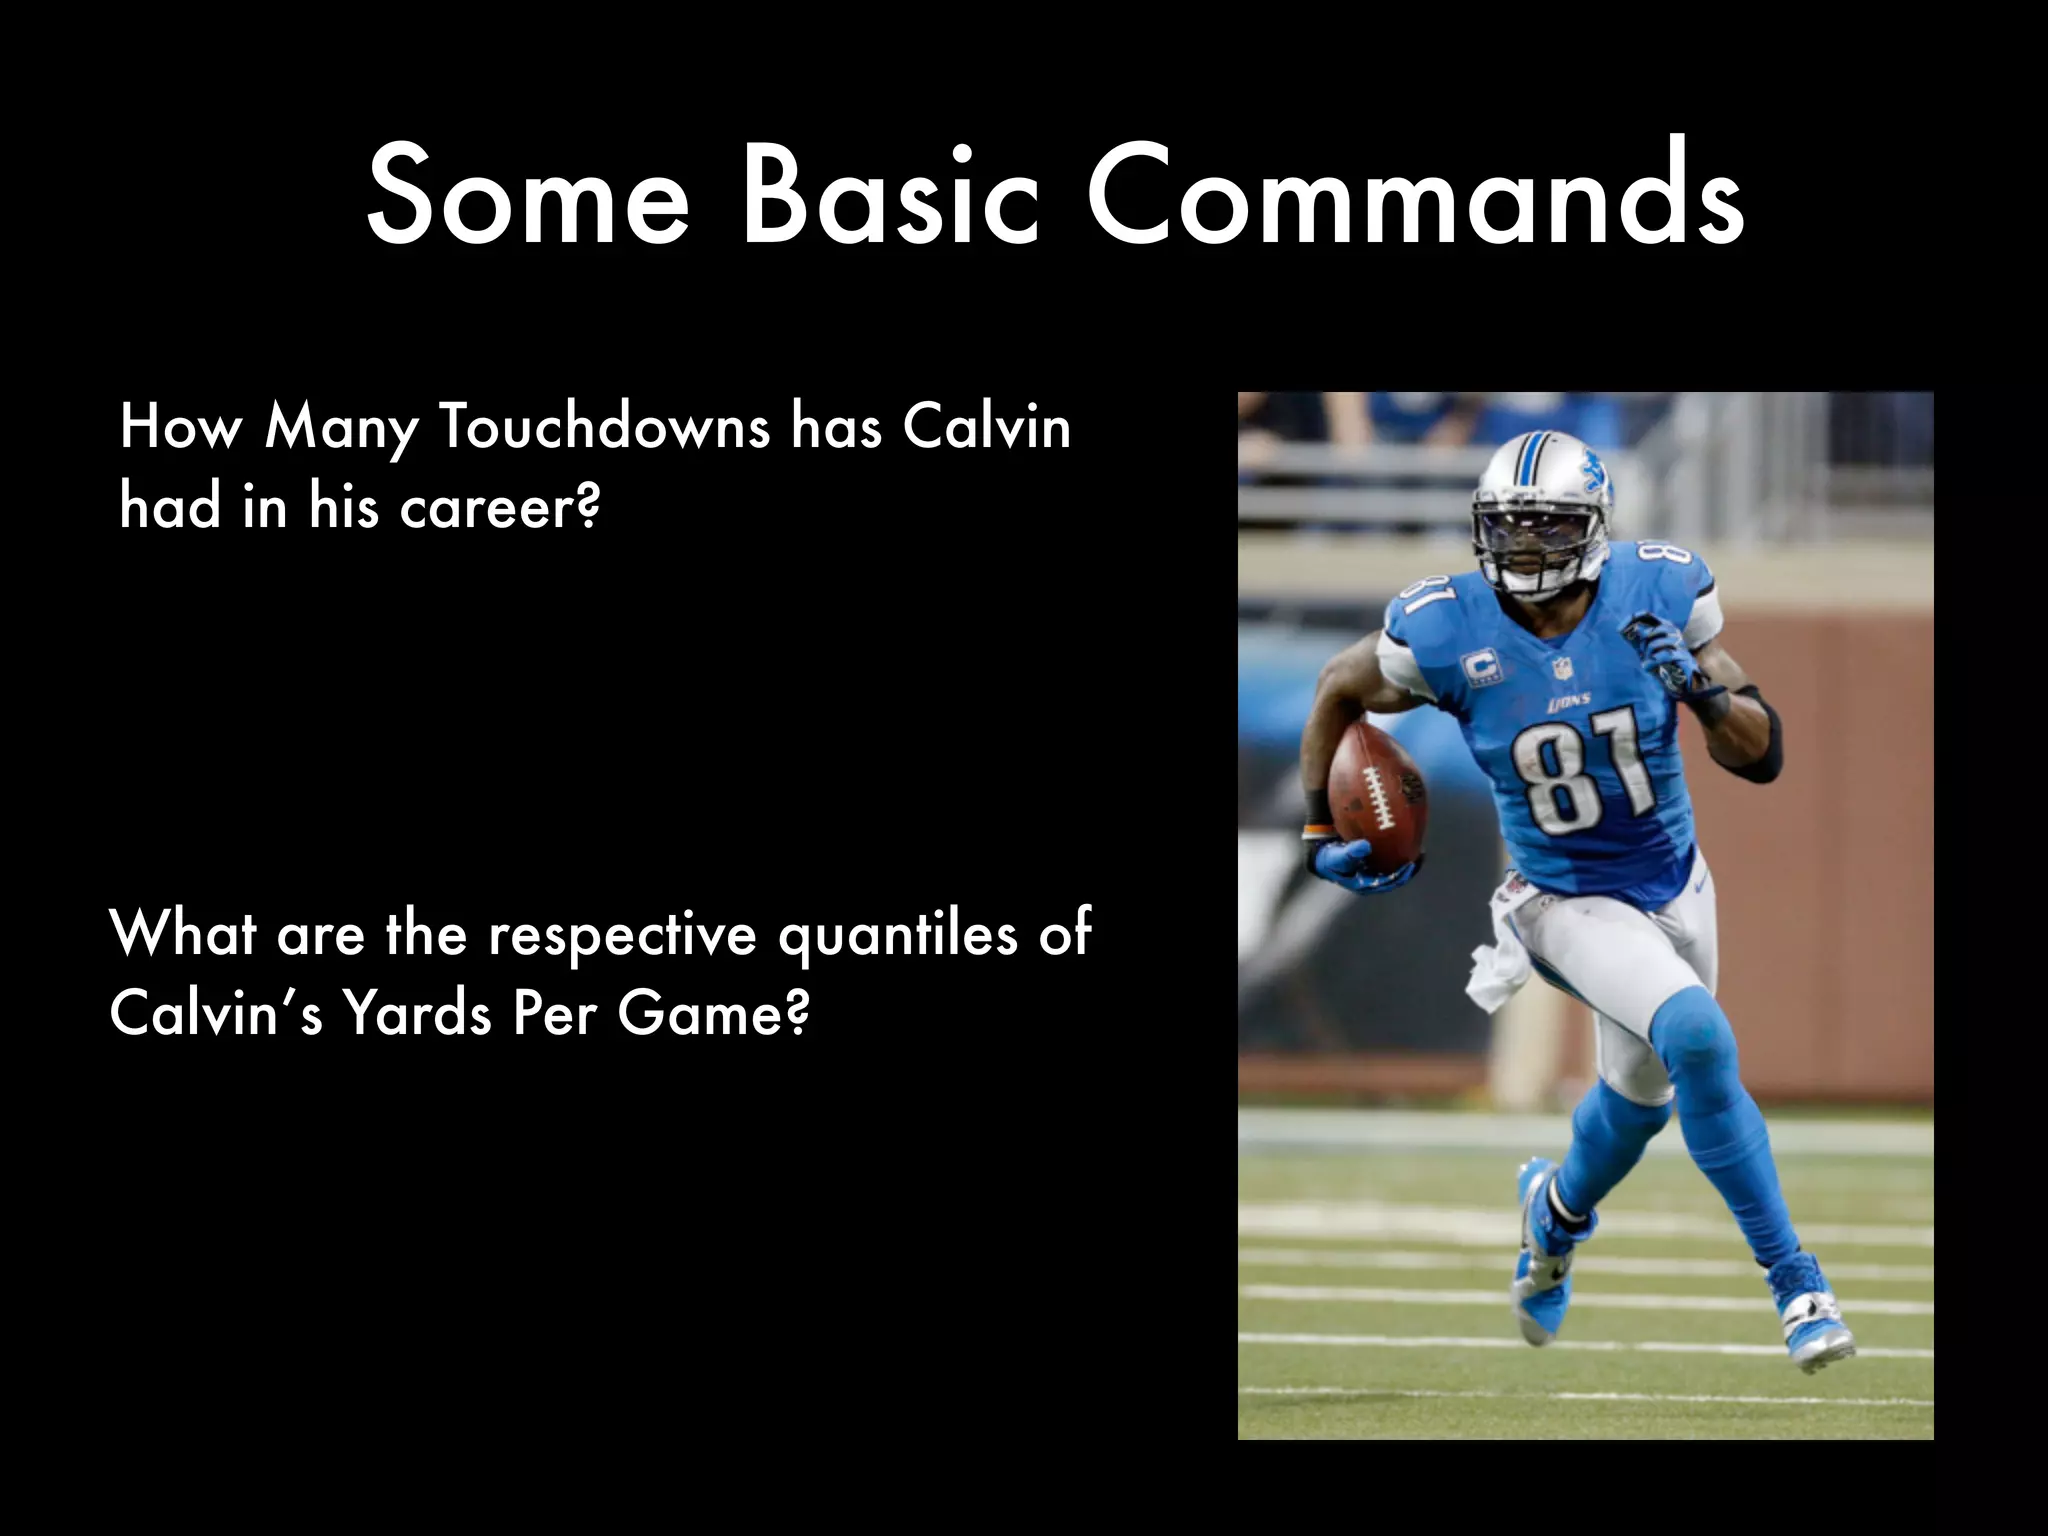
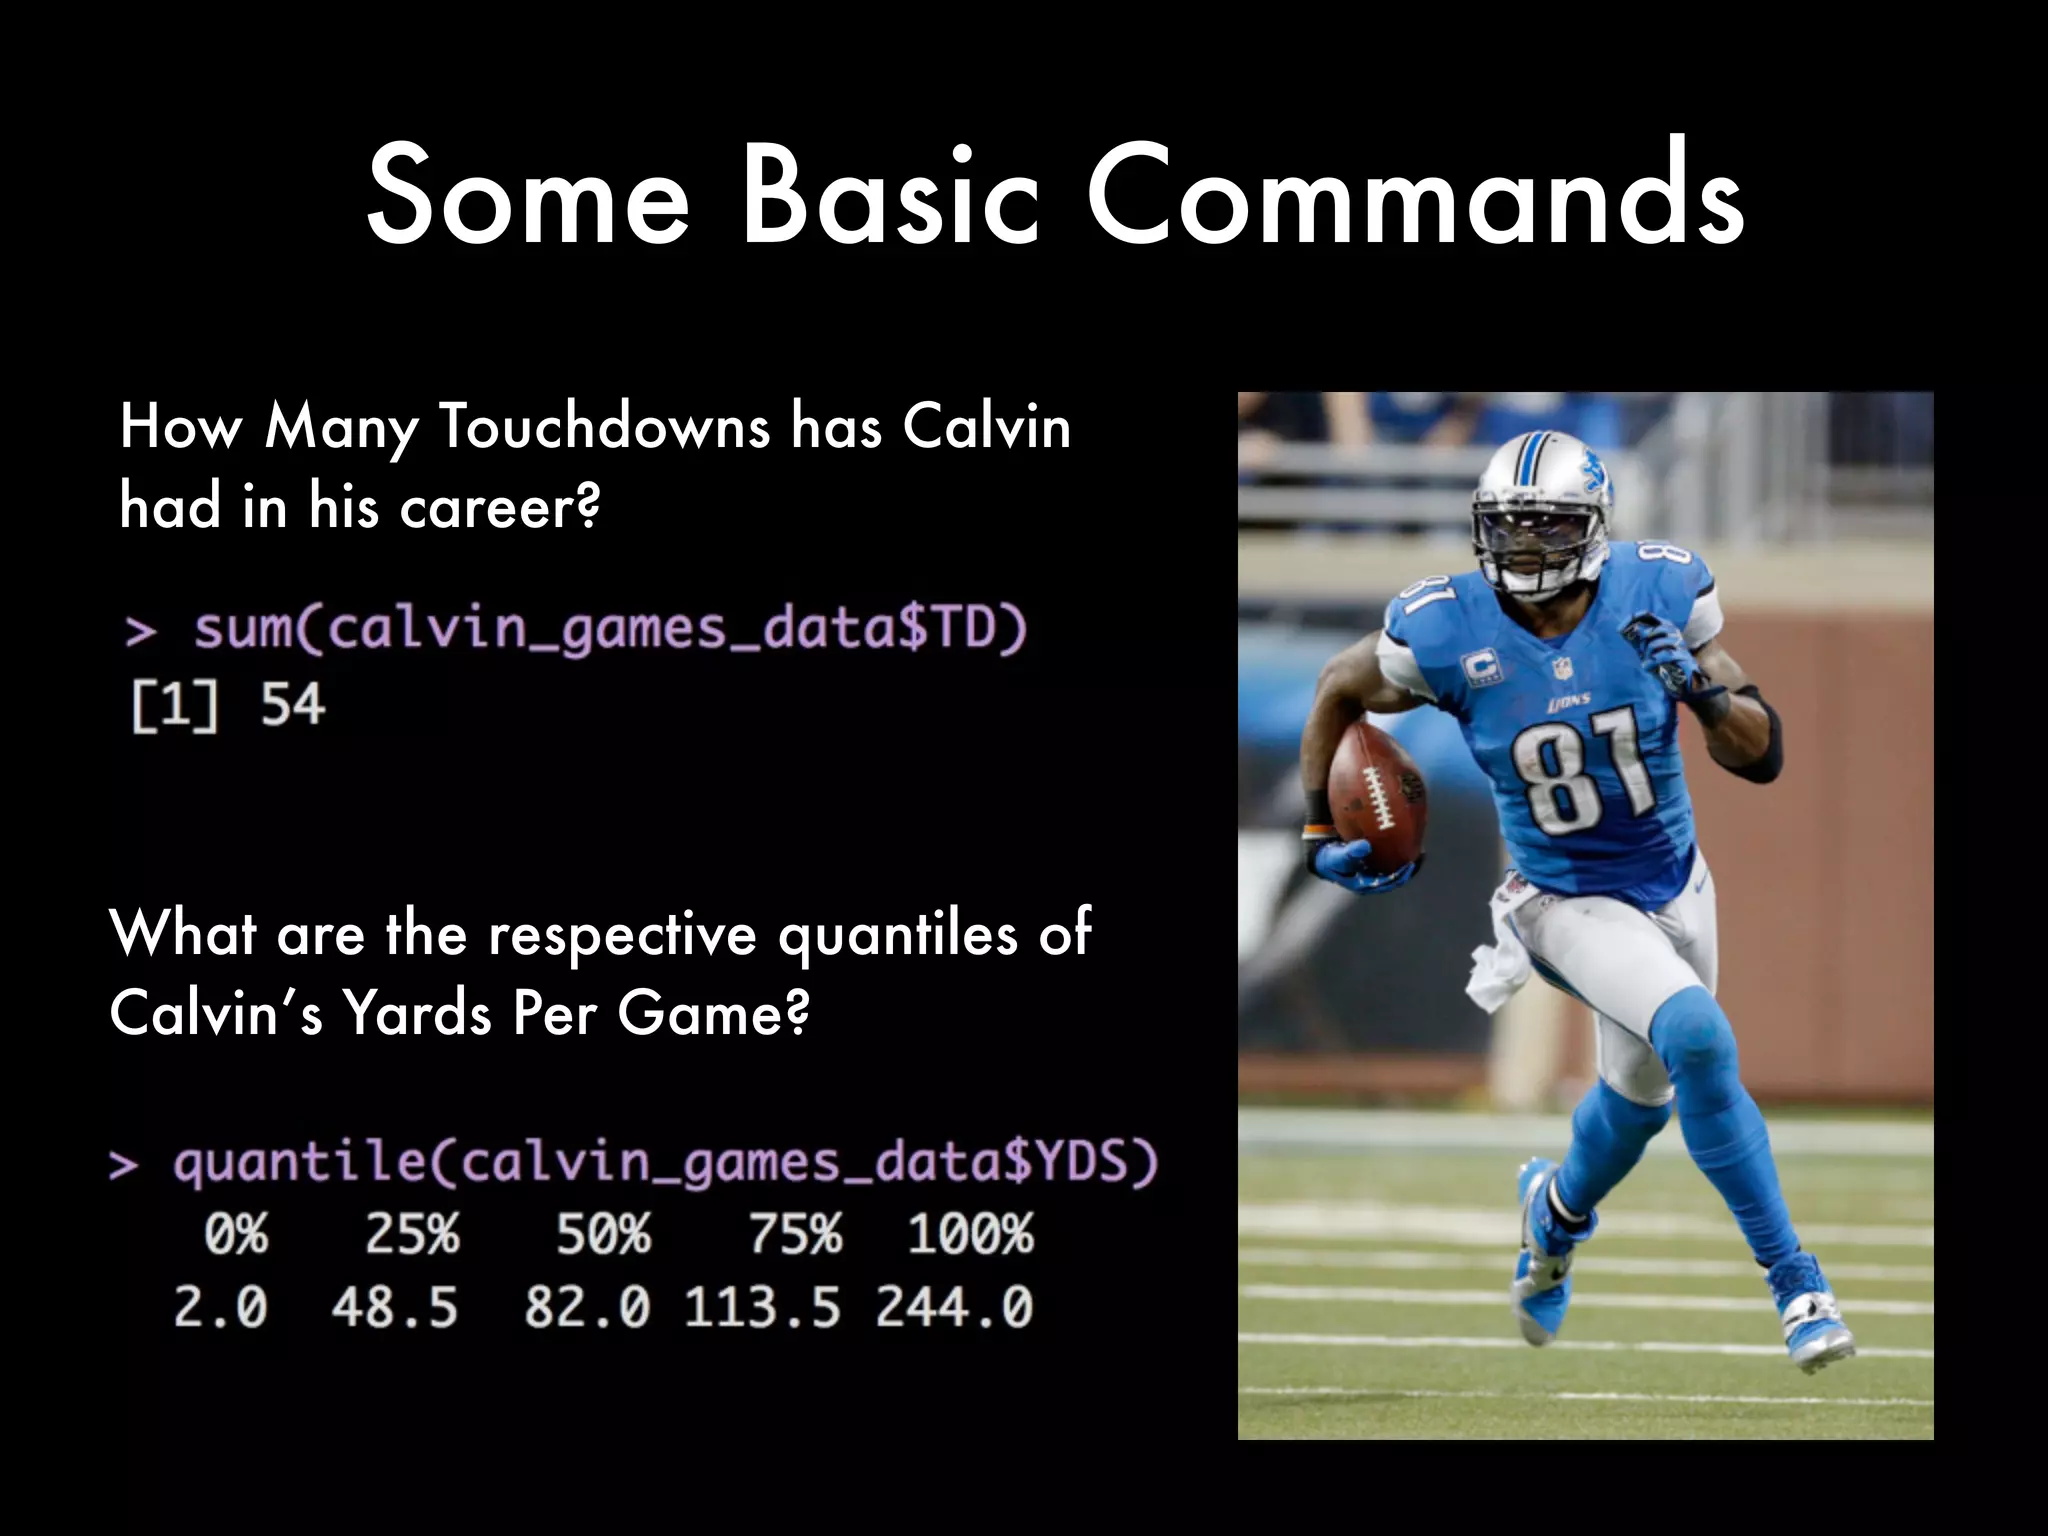
This document provides an introduction to loading datasets in R. It demonstrates how to load a CSV dataset from a URL and assign it to an object name. It shows how to remove rows with missing values and reset the row numbers. The document then covers some basic commands like min, max, mean, and standard deviation. Finally, it demonstrates plotting histograms and box plots of data.