Recommended

Recommended
More Related Content
Viewers also liked
Similar to Designing GWAS arrays for efficient imputation-based coverage
Similar to Designing GWAS arrays for efficient imputation-based coverage (20)
More from Affymetrix
More from Affymetrix (20)
Recently uploaded
Recently uploaded (20)
Designing GWAS arrays for efficient imputation-based coverage
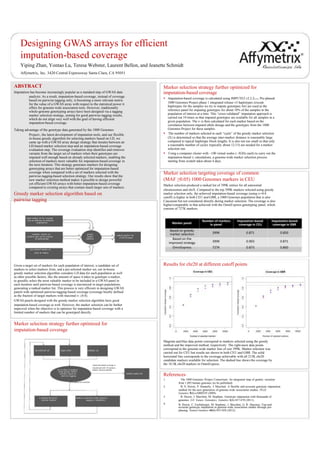
- 1. try to select X markers Designing GWAS arrays for efficient imputation-based coverage Yiping Zhan, Yontao Lu, Teresa Webster, Laurent Bellon, and Jeanette Schmidt Affymetrix, Inc. 3420 Central Expressway Santa Clara, CA 95051 Results for chr20 at different cutoff points ABSTRACT Imputation has become increasingly popular as a standard step of GWAS data analysis. As a result, imputation-based coverage, instead of coverage based on pairwise tagging only, is becoming a more relevant metric for the value of a GWAS array with respect to the statistical power it offers for genome-wide association tests. However, traditionally whole-genome genotyping arrays have been designed via a tagging marker selection strategy, aiming for good pairwise tagging results, which do not align very well with the goal of having efficient imputation-based coverage. Taking advantage of the genotype data generated by the 1000 Genomes Project1, the latest development of imputation tools, and our flexible in-house greedy algorithm for selecting markers based on LD, we came up with a GWAS array design strategy that iterates between an LD-based marker selection step and an imputation-based coverage evaluation step. The coverage evaluation step identifies and removes variants from the target set of markers when their genotypes are imputed well enough based on already selected markers, enabling the selection of markers more valuable for imputation-based coverage in the next iteration. This strategy generates markers for designing genotyping arrays that are better optimized for imputation-based coverage when compared with a set of markers selected with the pairwise-tagging-based selection strategy. Our results show that the new marker selection method makes it possible to design powerful yet efficient GWAS arrays with better imputation-based coverage compared to existing arrays that contain much larger sets of markers. Greedy marker selection algorithm based on pairwise tagging Magenta and blue data points correspond to markers selected using the greedy method and the improved method, respectively. The right-most data points correspond to the genome-wide marker lists of size 399K. Marker selection was carried out for CEU but results are shown in both CEU and GBR. The solid horizontal line corresponds to the coverage achievable with all 215K chr20 candidate markers available for selection. The dashed line shows the coverage by the 18.5K chr20 markers in OmniExpress. References 1. The 1000 Genomes Project Consortium. An integrated map of genetic variation from 1,092 human genomes (to be published) 2. B. N. Howie, P. Donnelly, J. Marchini. A flexible and accurate genotype imputation method for the next generation of genome-wide association studies. PLoS Genetics 5(6):e1000529 (2009). 3. B. Howie, J. Marchini, M. Stephens. Genotype imputation with thousands of genomes. G3: Genes, Genomics, Genetics 1(6):457-470 (2011). 4. B. Howie, C. Fuchsberger, M. Stephens, J. Marchini, G. R. Abecasis. Fast and accurate genotype imputation in genome-wide association studies through pre- phasing. Nature Genetics 44(8):955-959 (2012). target marker set for coverage (can be different for different populations) candidate marker set (markers that can be selected for genotyping) pre-selected marker set (may be empty) greedy marker selection ranked markers for a GWAS panel Given a target set of markers for each population of interest, a candidate set of markers to select markers from, and a pre-selected marker set, our in-house greedy marker selection algorithm considers LD data for each population as well as other possible factors, like the amount of space it takes to genotype a marker, to greedily select the most valuable marker to be included in a GWAS panel in each iteration until pairwise-based coverage is maximized in target populations, generating a ranked marker list. This process is very efficient in designing GWAS panels with optimized pairwise-tagging-based coverage (coverage hereby defined as the fraction of target markers with maximal r2 ≥0.8). GWAS panels designed with the greedy marker selection algorithm have good imputation-based coverage as well. However, the marker selection can be further improved when the objective is to optimize for imputation-based coverage with a limited number of markers that can be genotyped directly. Marker selection strategy further optimized for imputation-based coverage ranked marker list pre-selected set target set(s) candidate set if pairwise-based coverage is maximized with <X markers, marker selection finishes using greedy marker selection based on pairwise tagging if X markers are selected update the pre-selected set update the target set to remove to include the newly markers covered by either pairwise selected markers tagging or imputation Marker selection strategy further optimized for imputation-based coverage Imputation-based coverage is calculated using IMPUTE2 v2.2.22,3,4. Pre-phased 1000 Genomes Project phase 1 integrated release v3 haplotypes (except haplotypes for the samples we try to impute genotypes for) are used as the reference panel for imputing genotypes for about 10% of the samples in the population of interest at a time. This “cross-validated” imputation approach is carried out 10 times so that imputed genotypes are available for all samples in a given population. The r2 is then calculated for each marker based on the correlation between imputed allele dosage and the genotypes from the 1000 Genomes Project for these samples. The number of markers selected in each “cycle” of the greedy marker selection (X) is determined so that the average inter-marker distance is reasonably large compared to typical haplotype block lengths. It is also not too small so that only a reasonable number of cycles (typically about 12-15) are needed for a marker selection run. Using a computer cluster with ~100 virtual nodes (~3GHz each) to carry out the imputation-based r2 calculations, a genome-wide marker selection process starting from scratch takes about 4 days. Marker selection targeting coverage of common (MAF ≥0.05) 1000 Genomes markers in CEU Marker selection produced a ranked list of 399K entries for all autosomal chromosomes and chrX. Compared to the top 399K markers selected using greedy marker selection only, the achieved imputation-based coverage (using r2=0.8 cutoff) is higher in both CEU and GBR, a 1000 Genomes population that is also Caucasian but not considered directly during marker selection. The coverage is also higher/comparable to that achieved with the OmniExpress genotyping panel, which consists of 727K markers. Marker panel Number of markers in panel Imputation‐based coverage in CEU Imputation‐based coverage in GBR Based on greedy marker selection Based on the improved strategy OmniExpress 399K 399K 727K 0.871 0.903 0.873 0.850 0.871 0.860