Download as PDF, PPTX
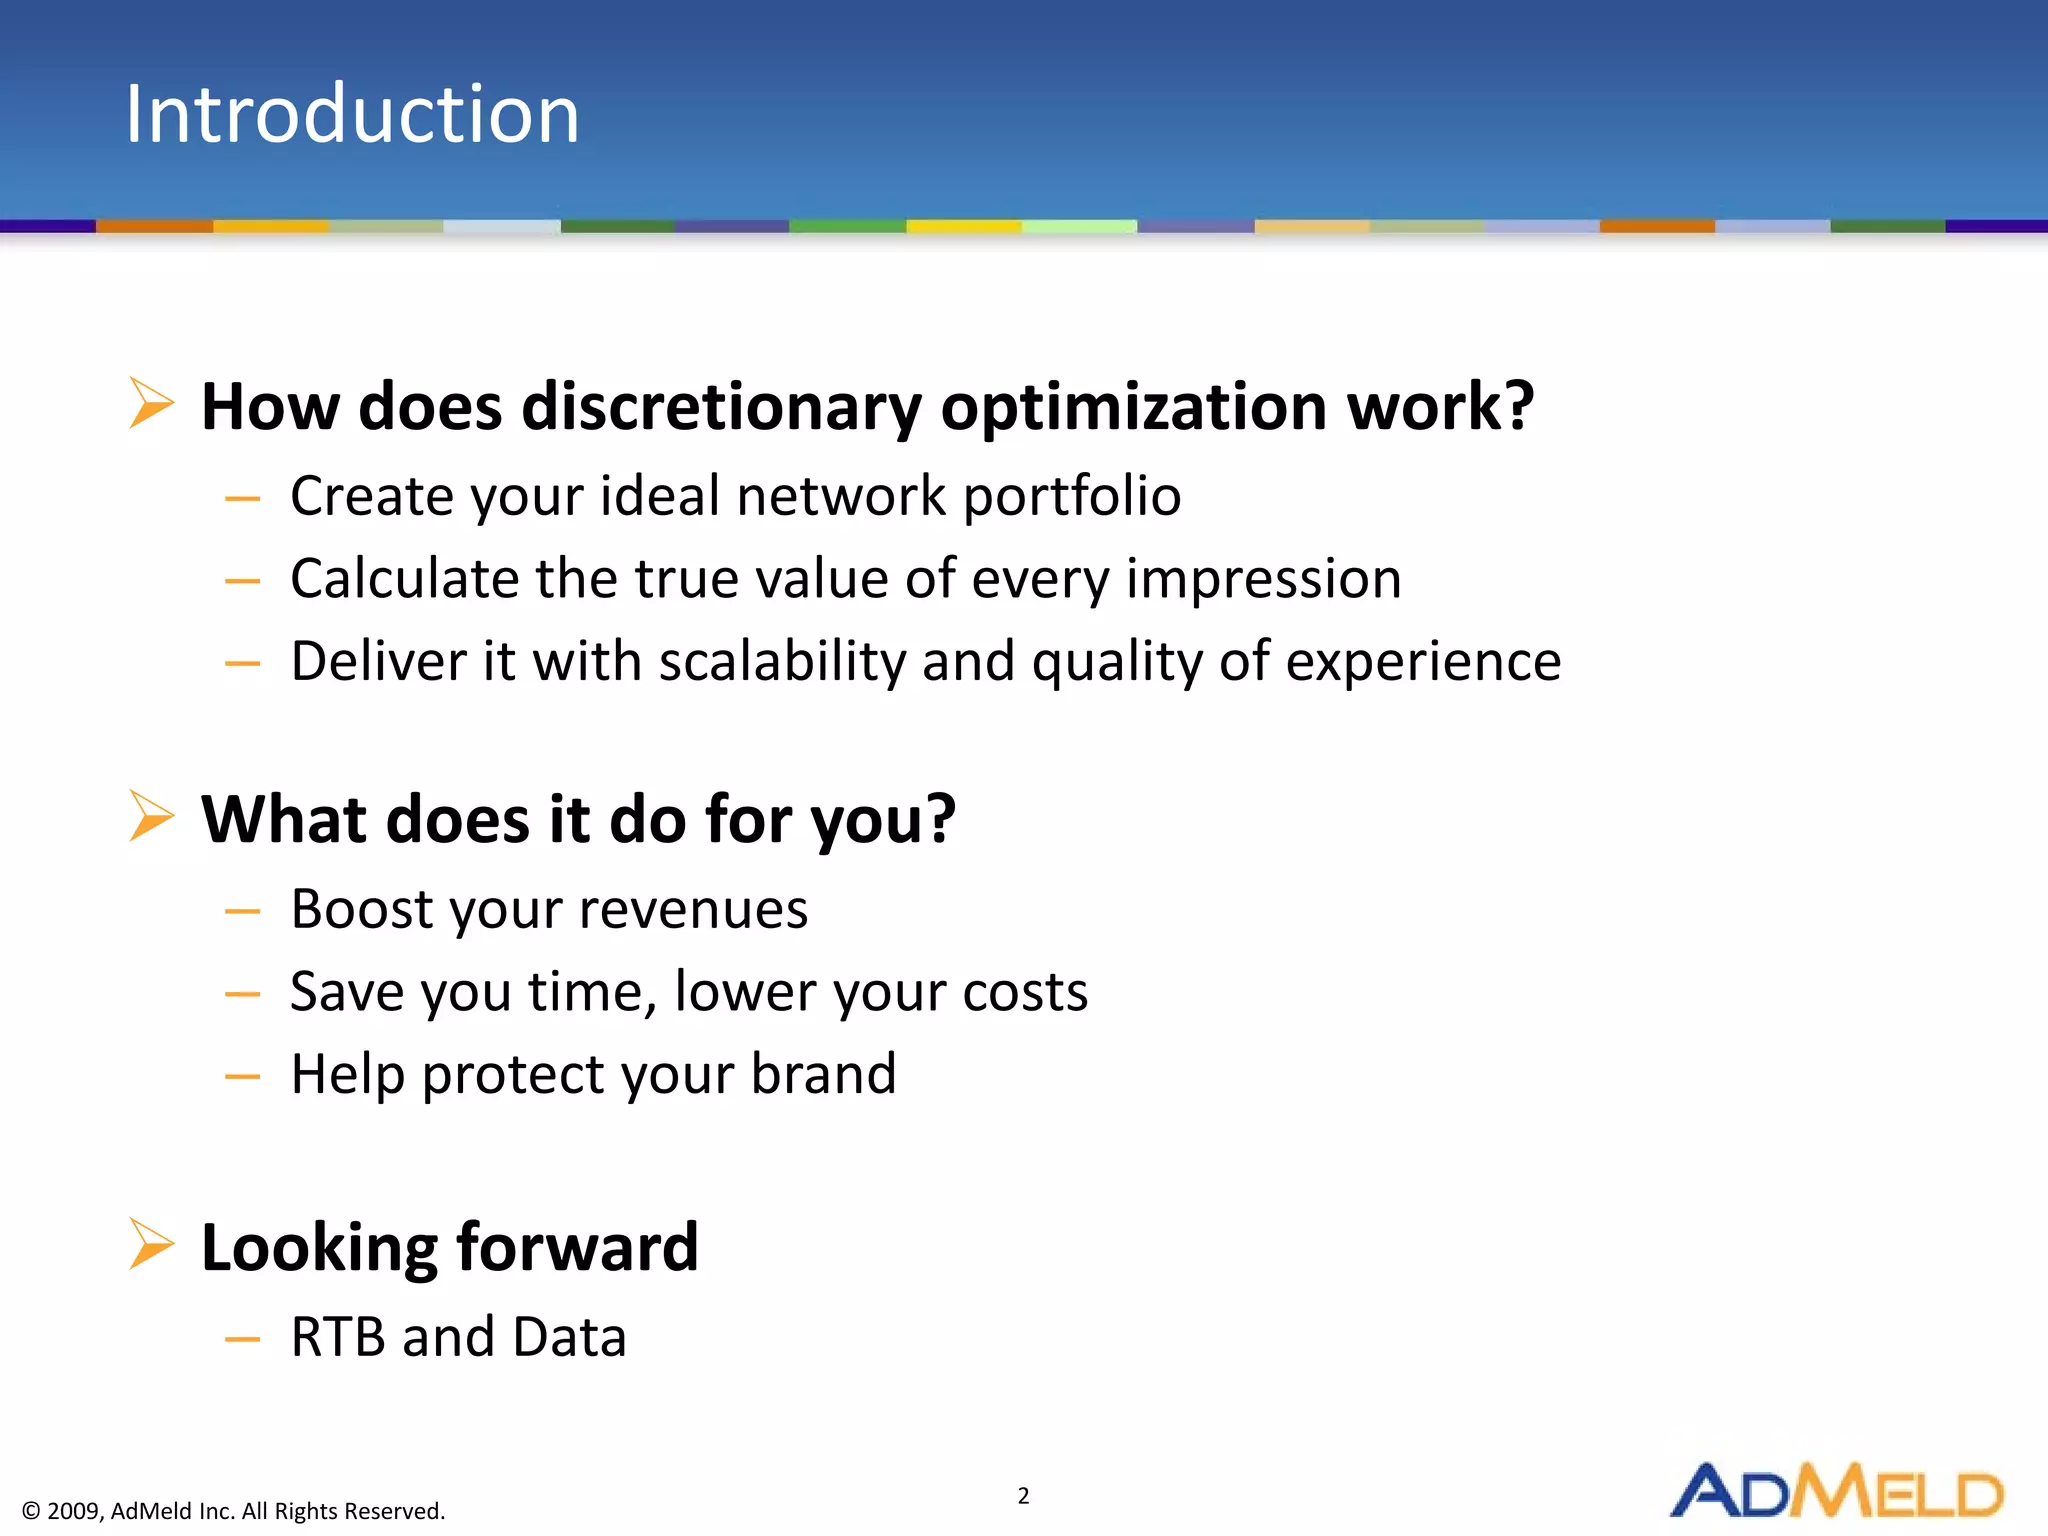
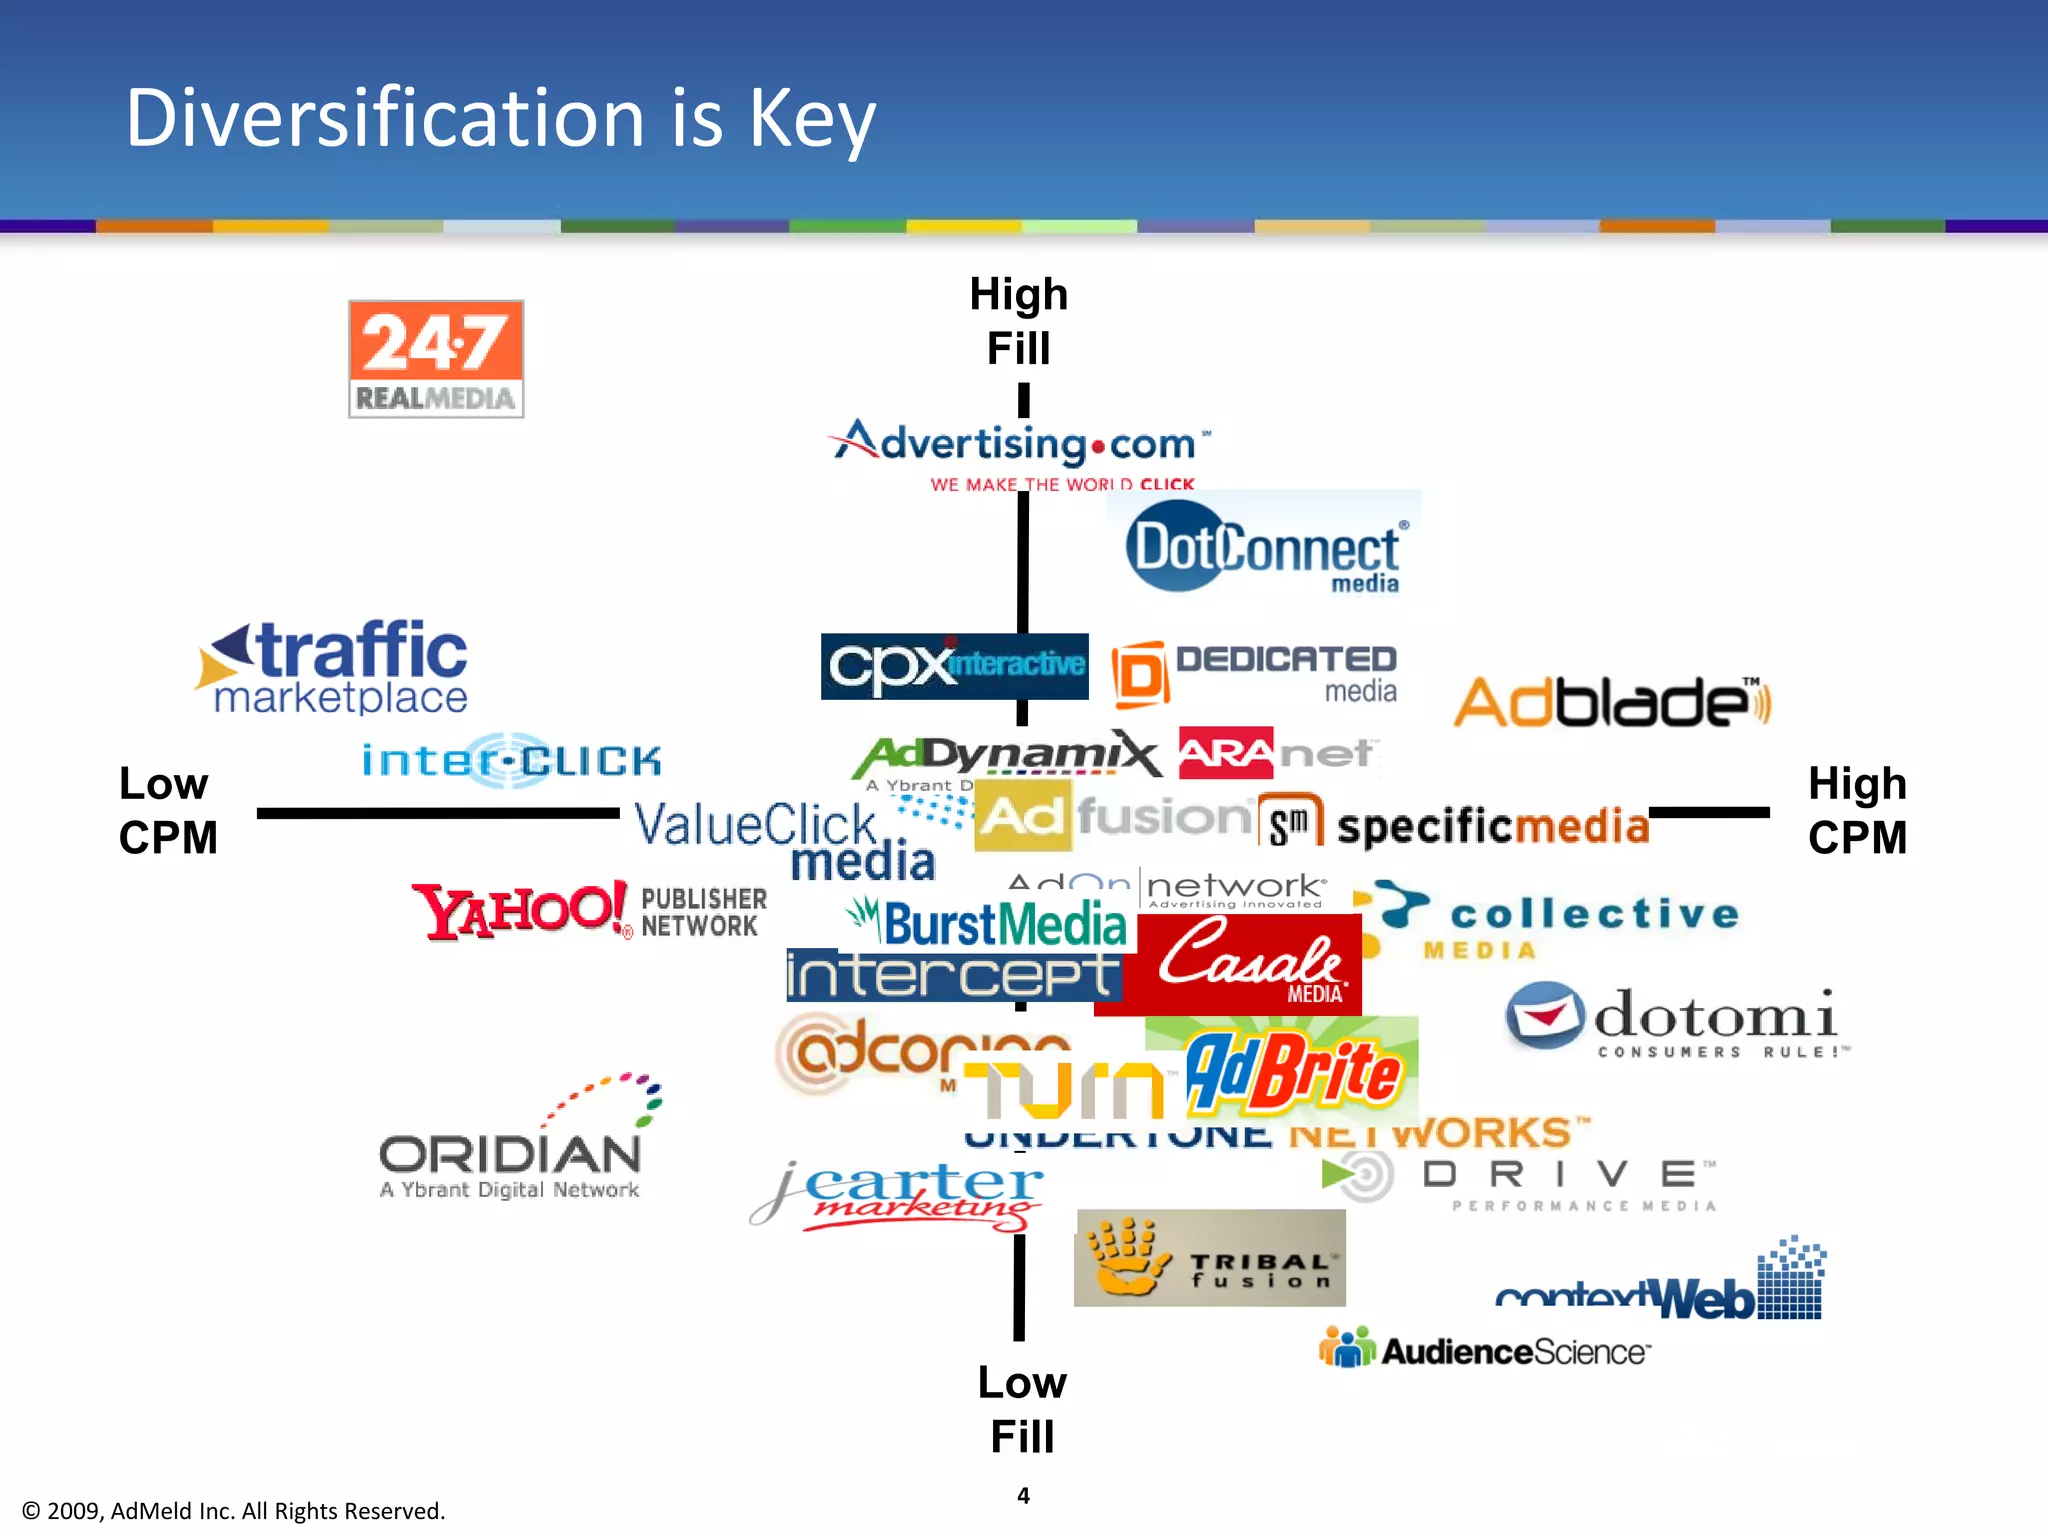
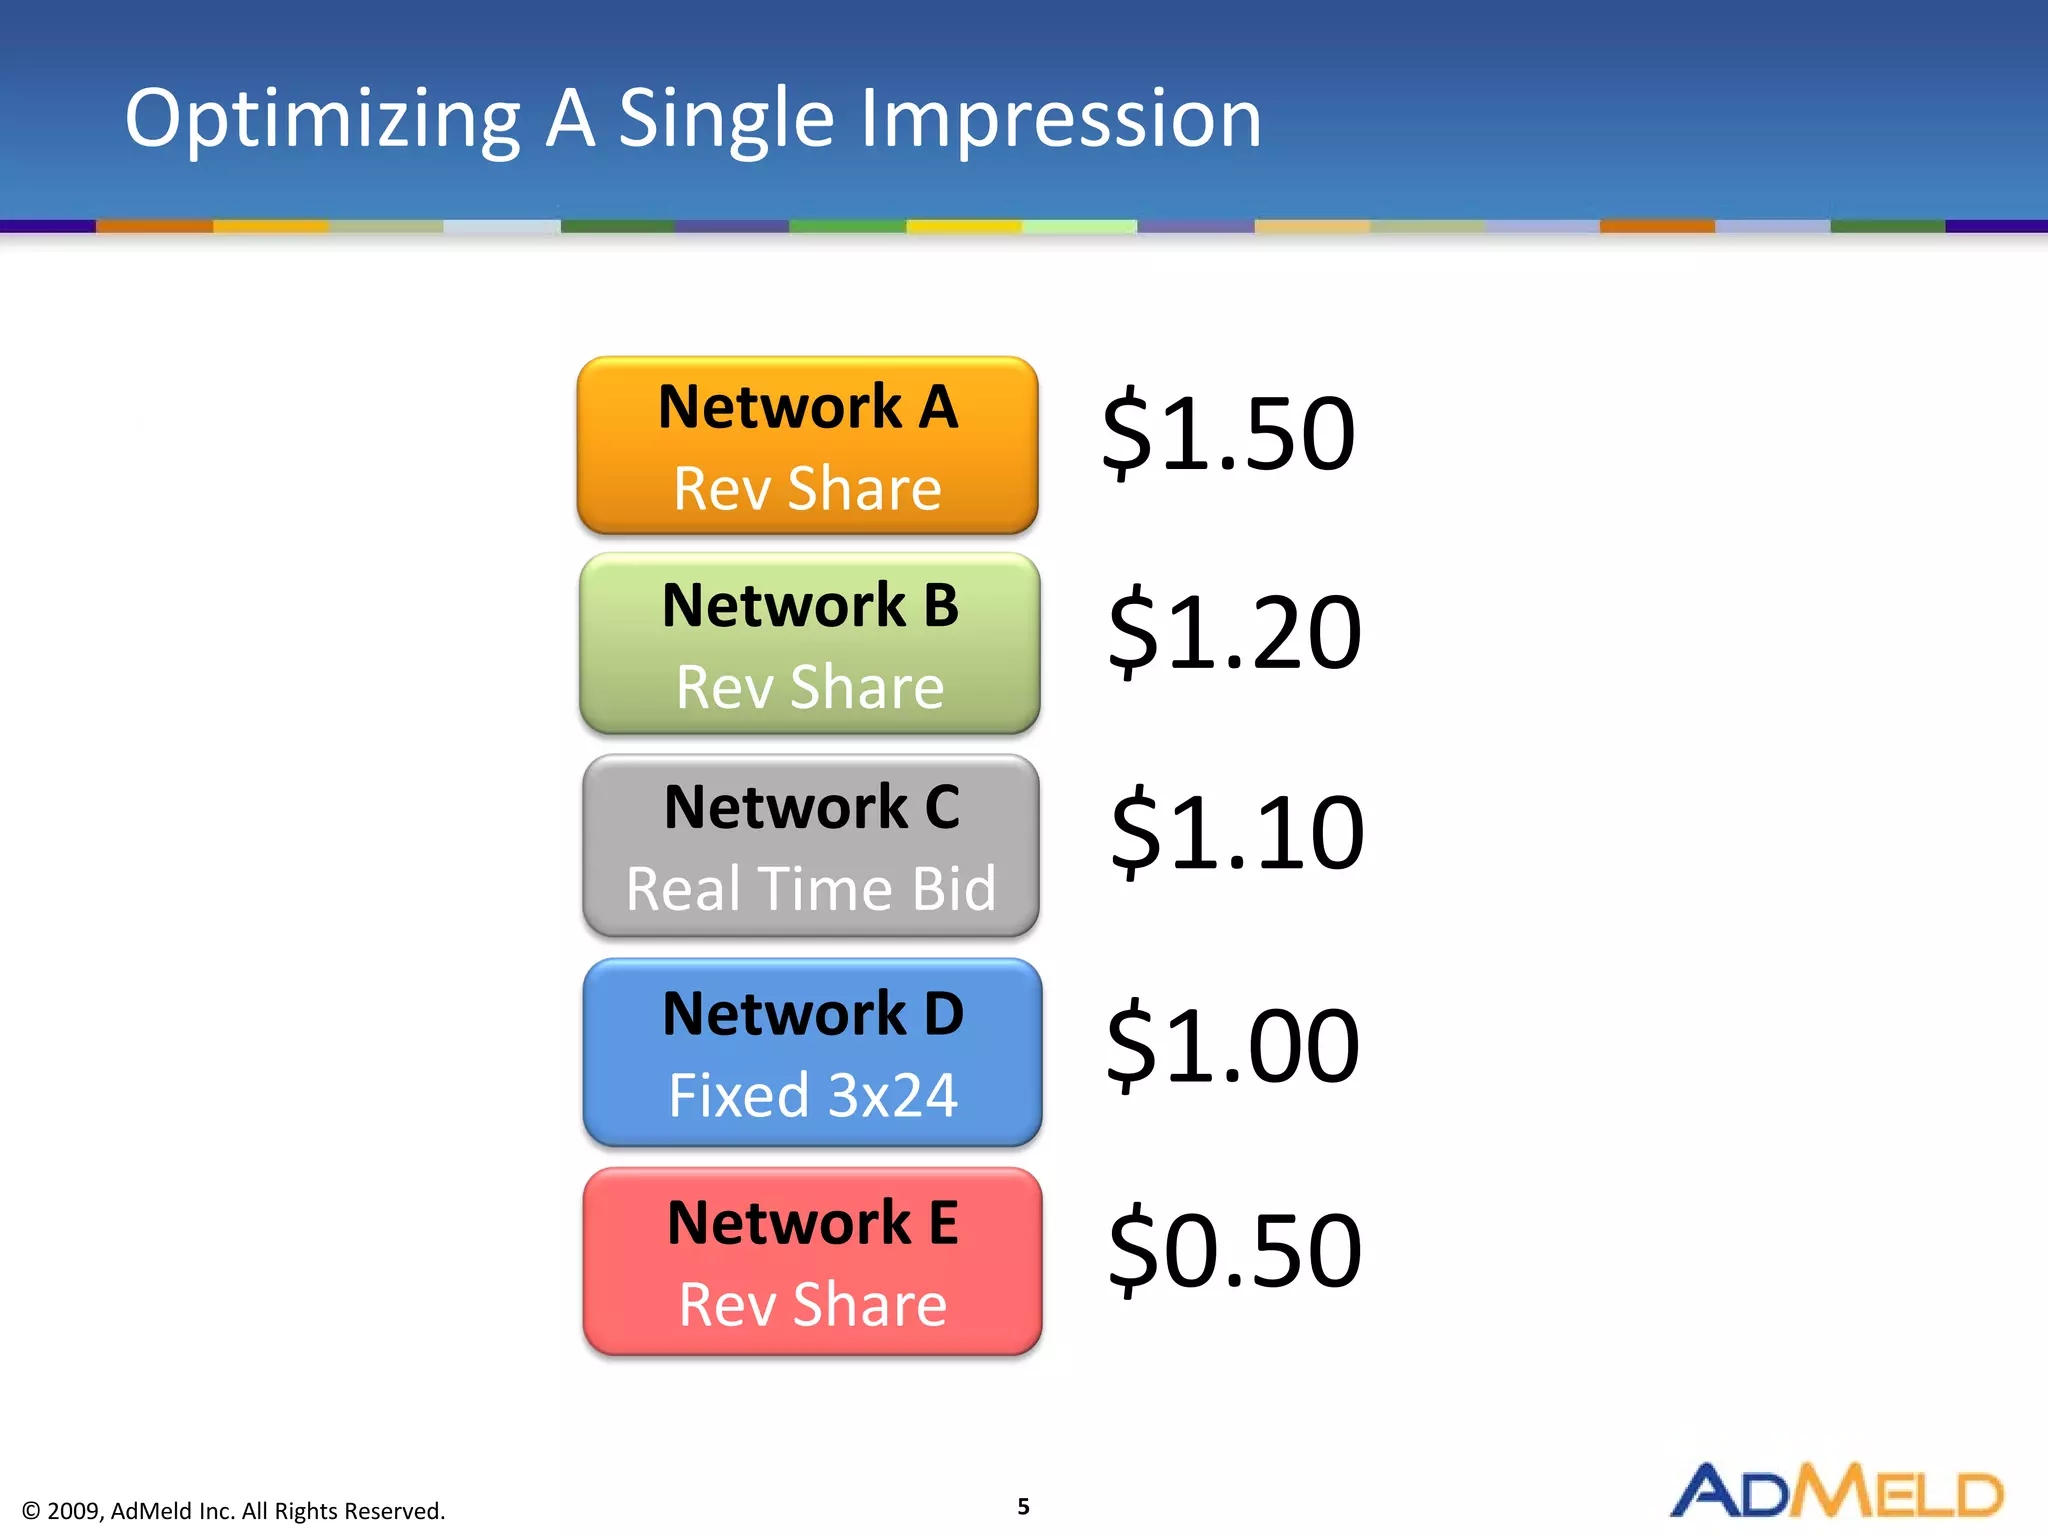
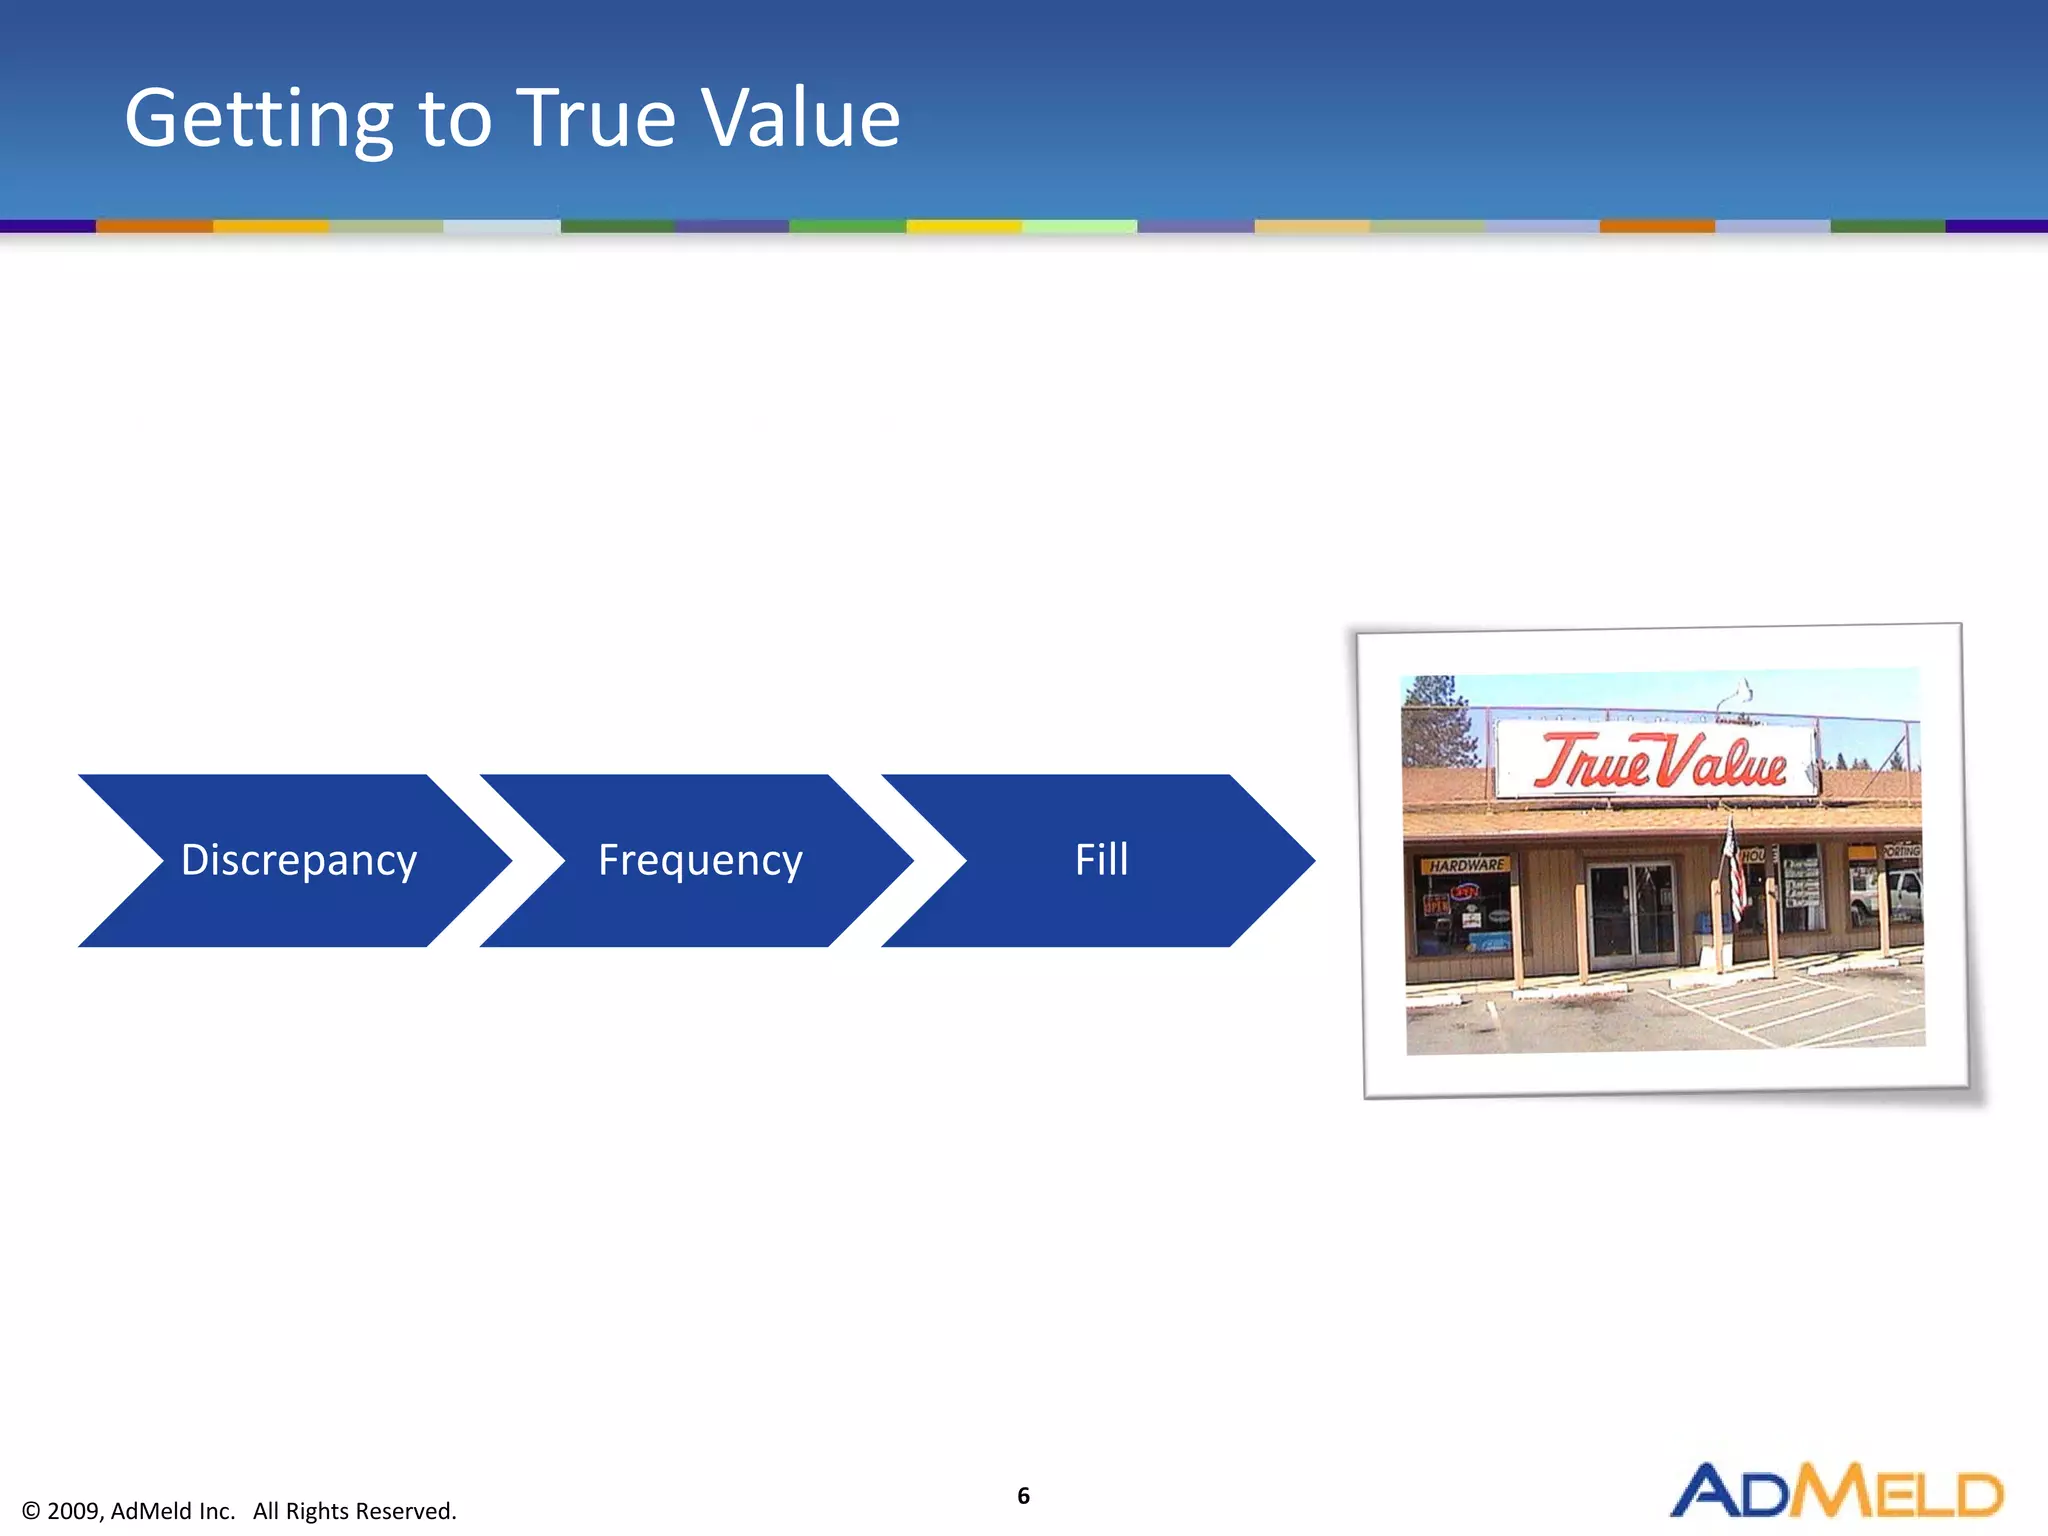
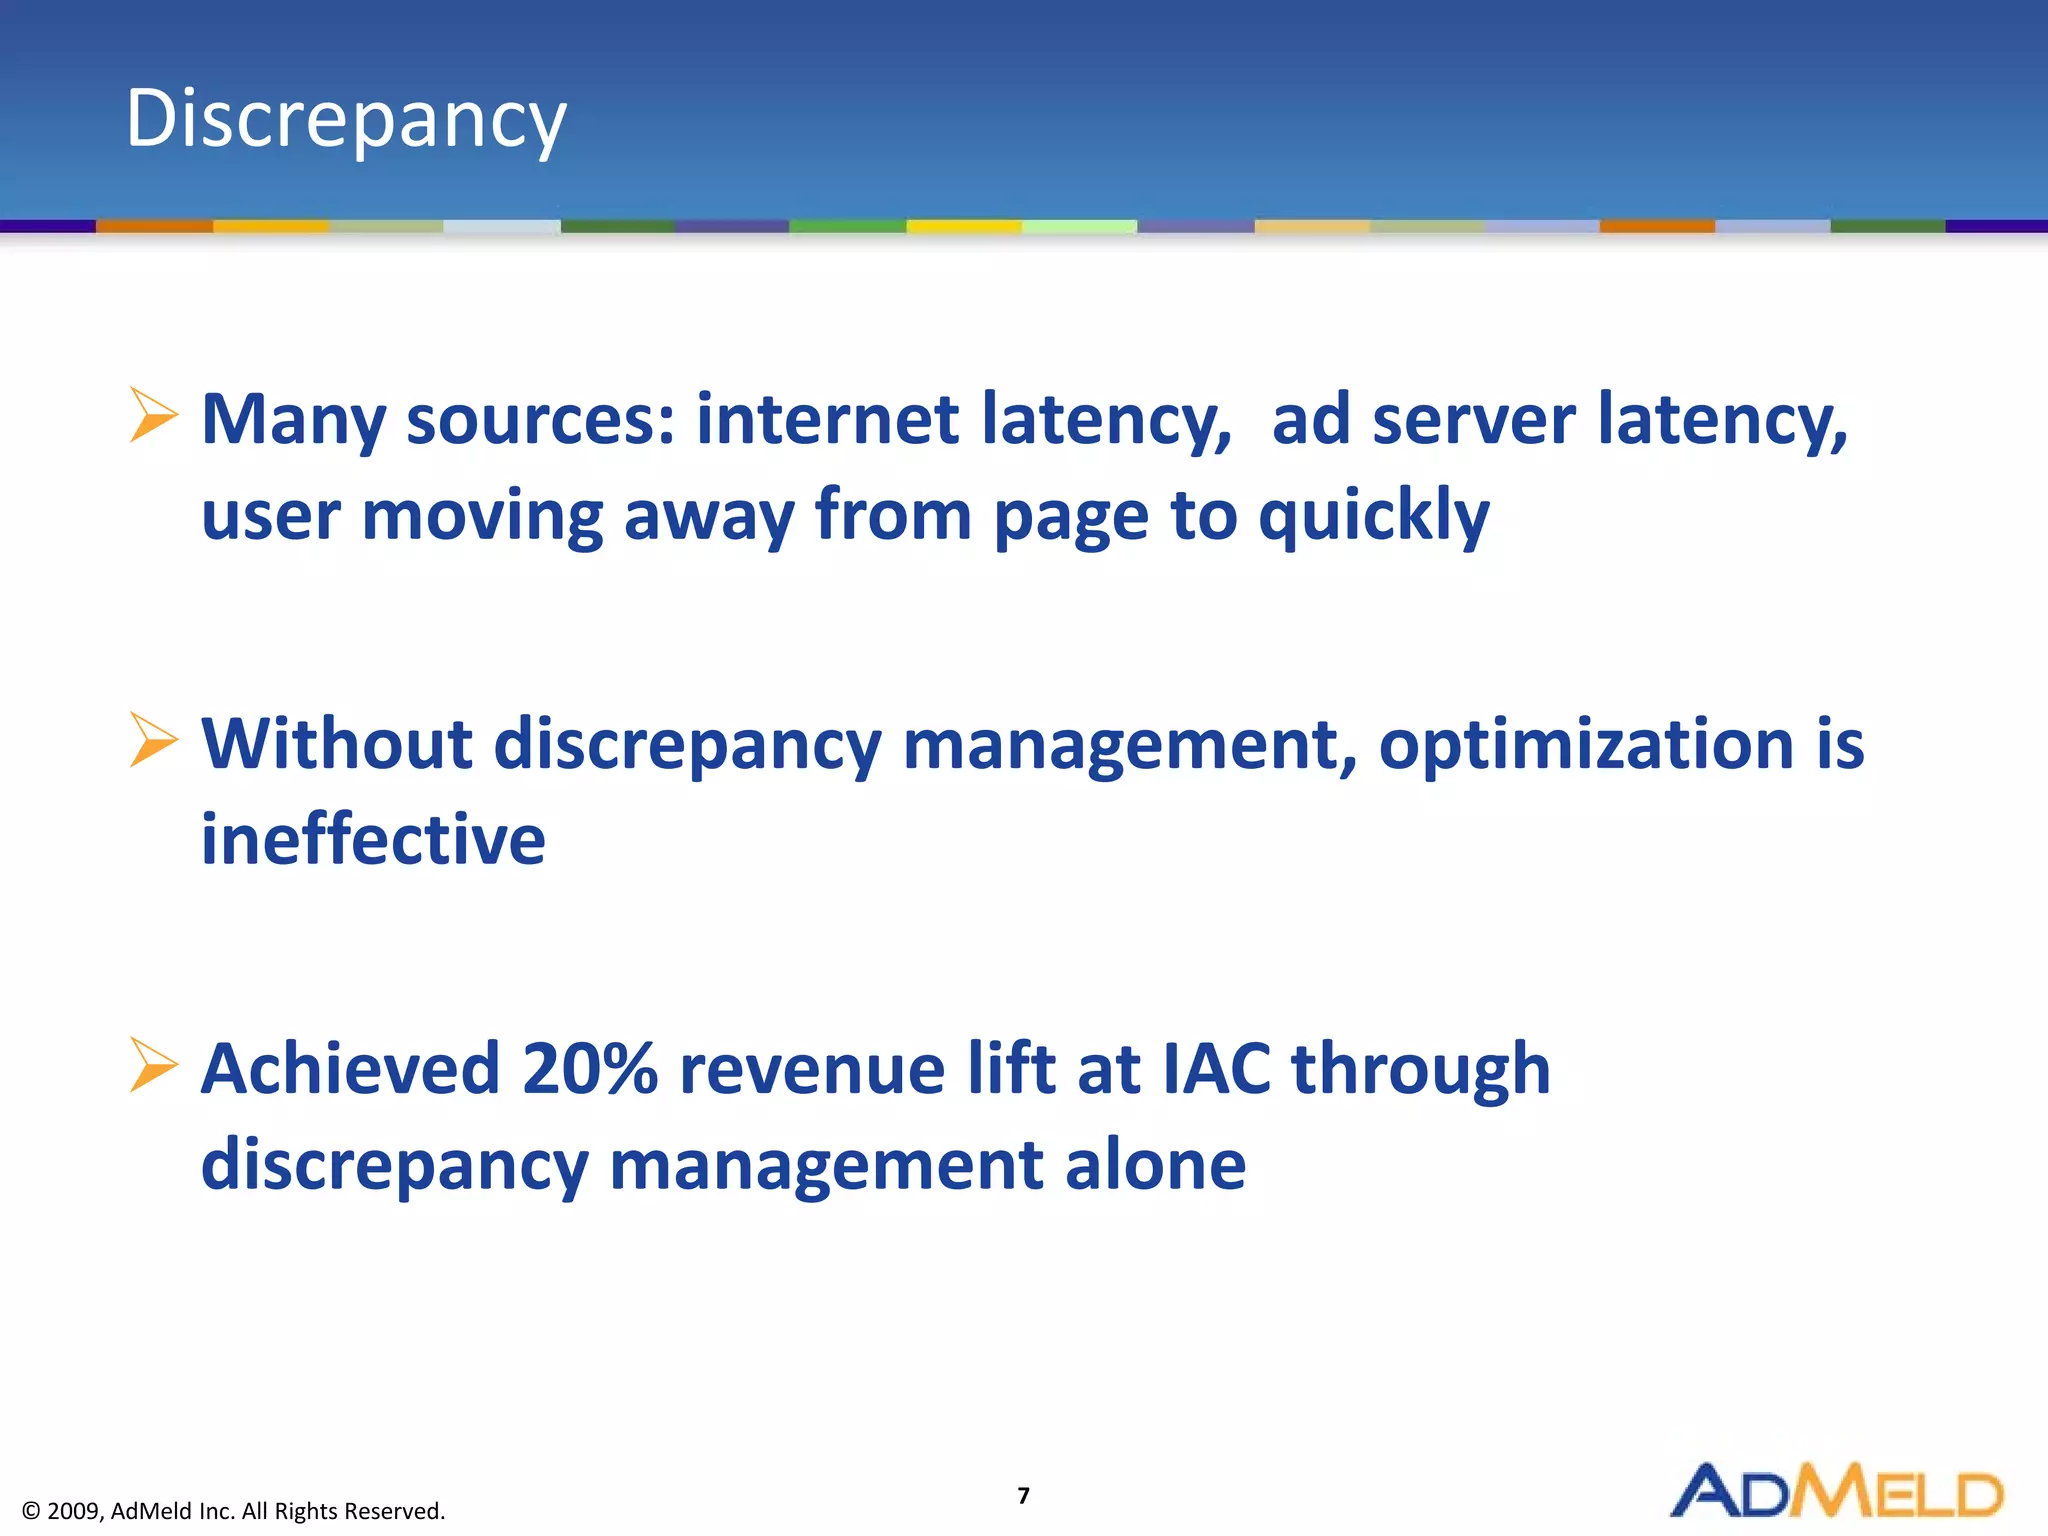
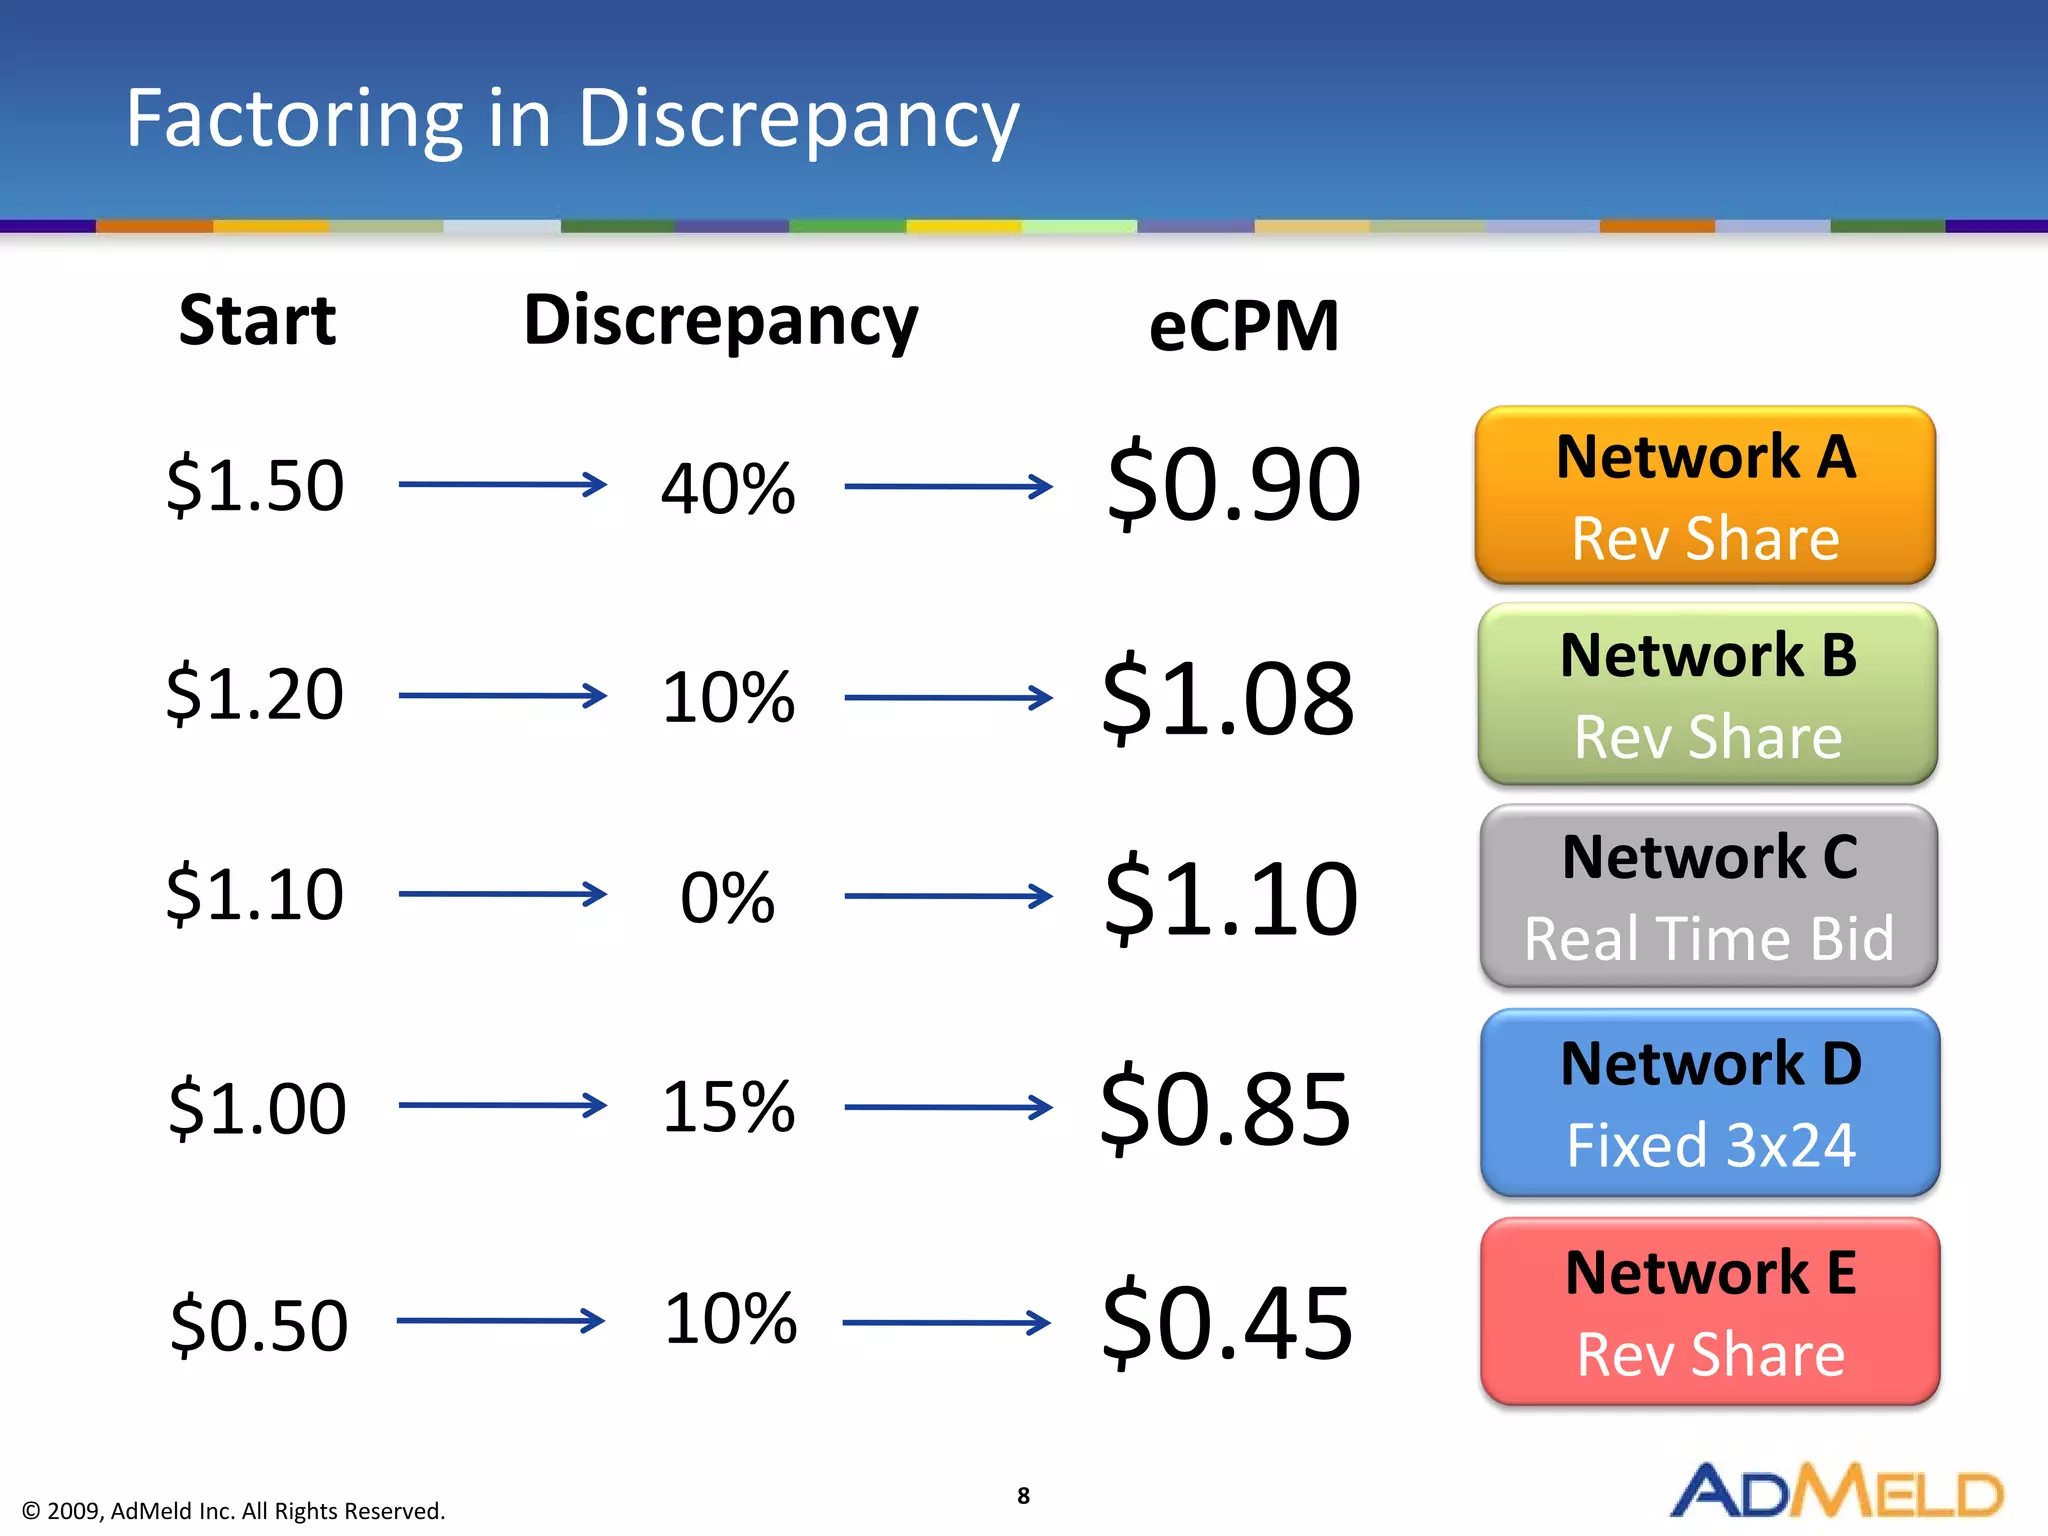
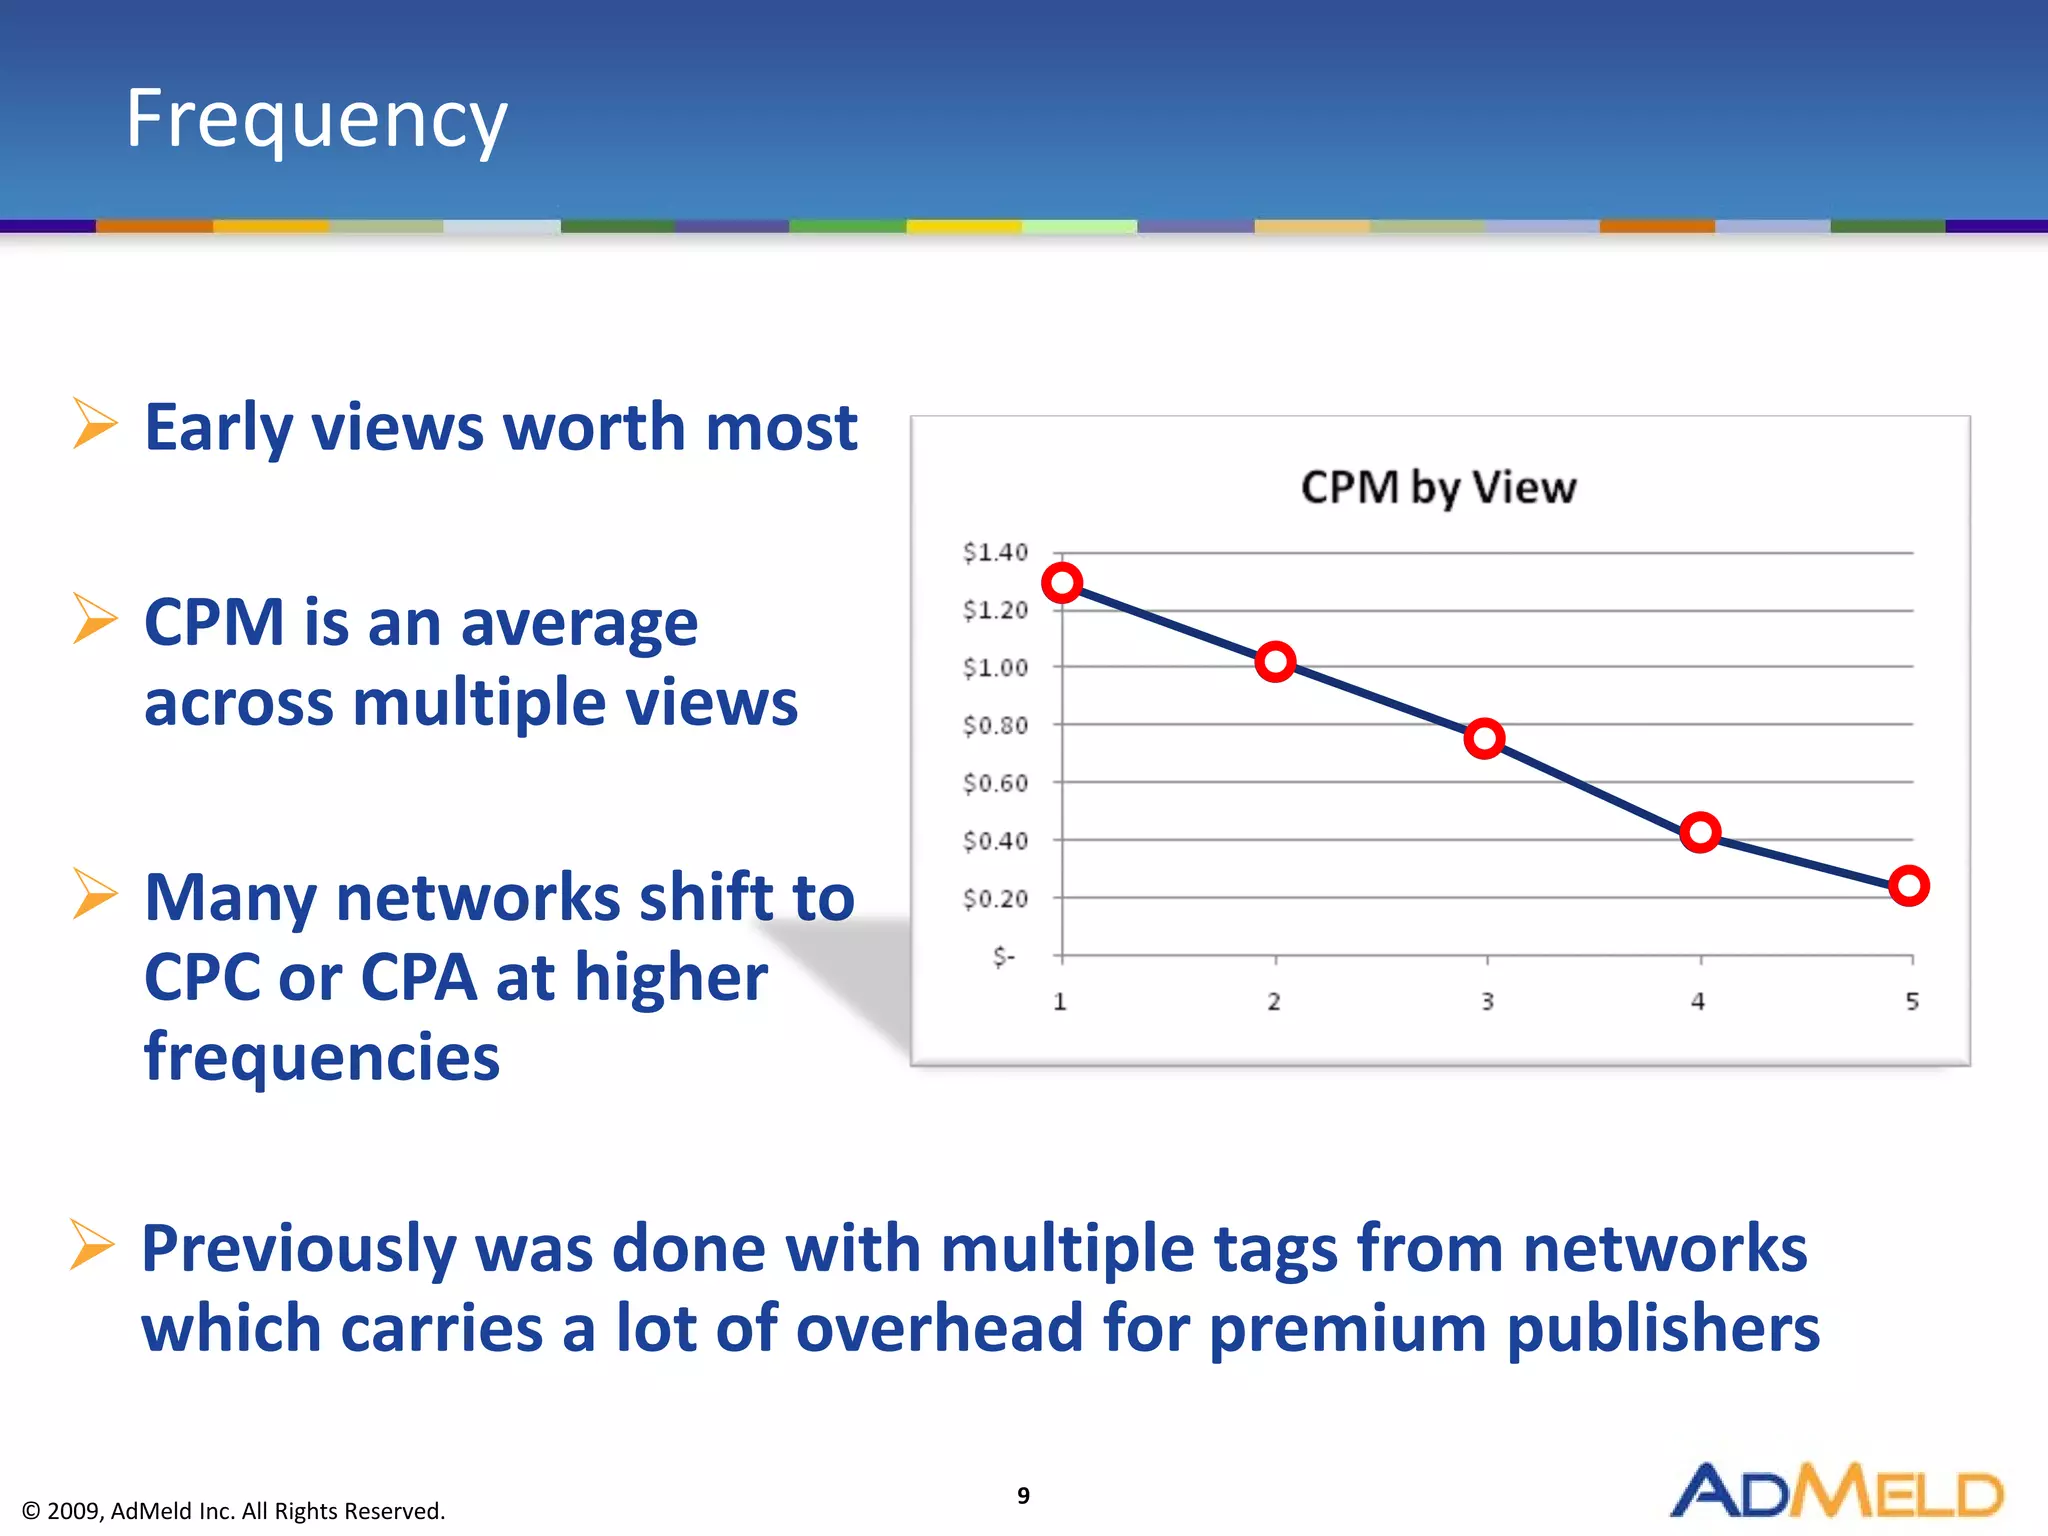
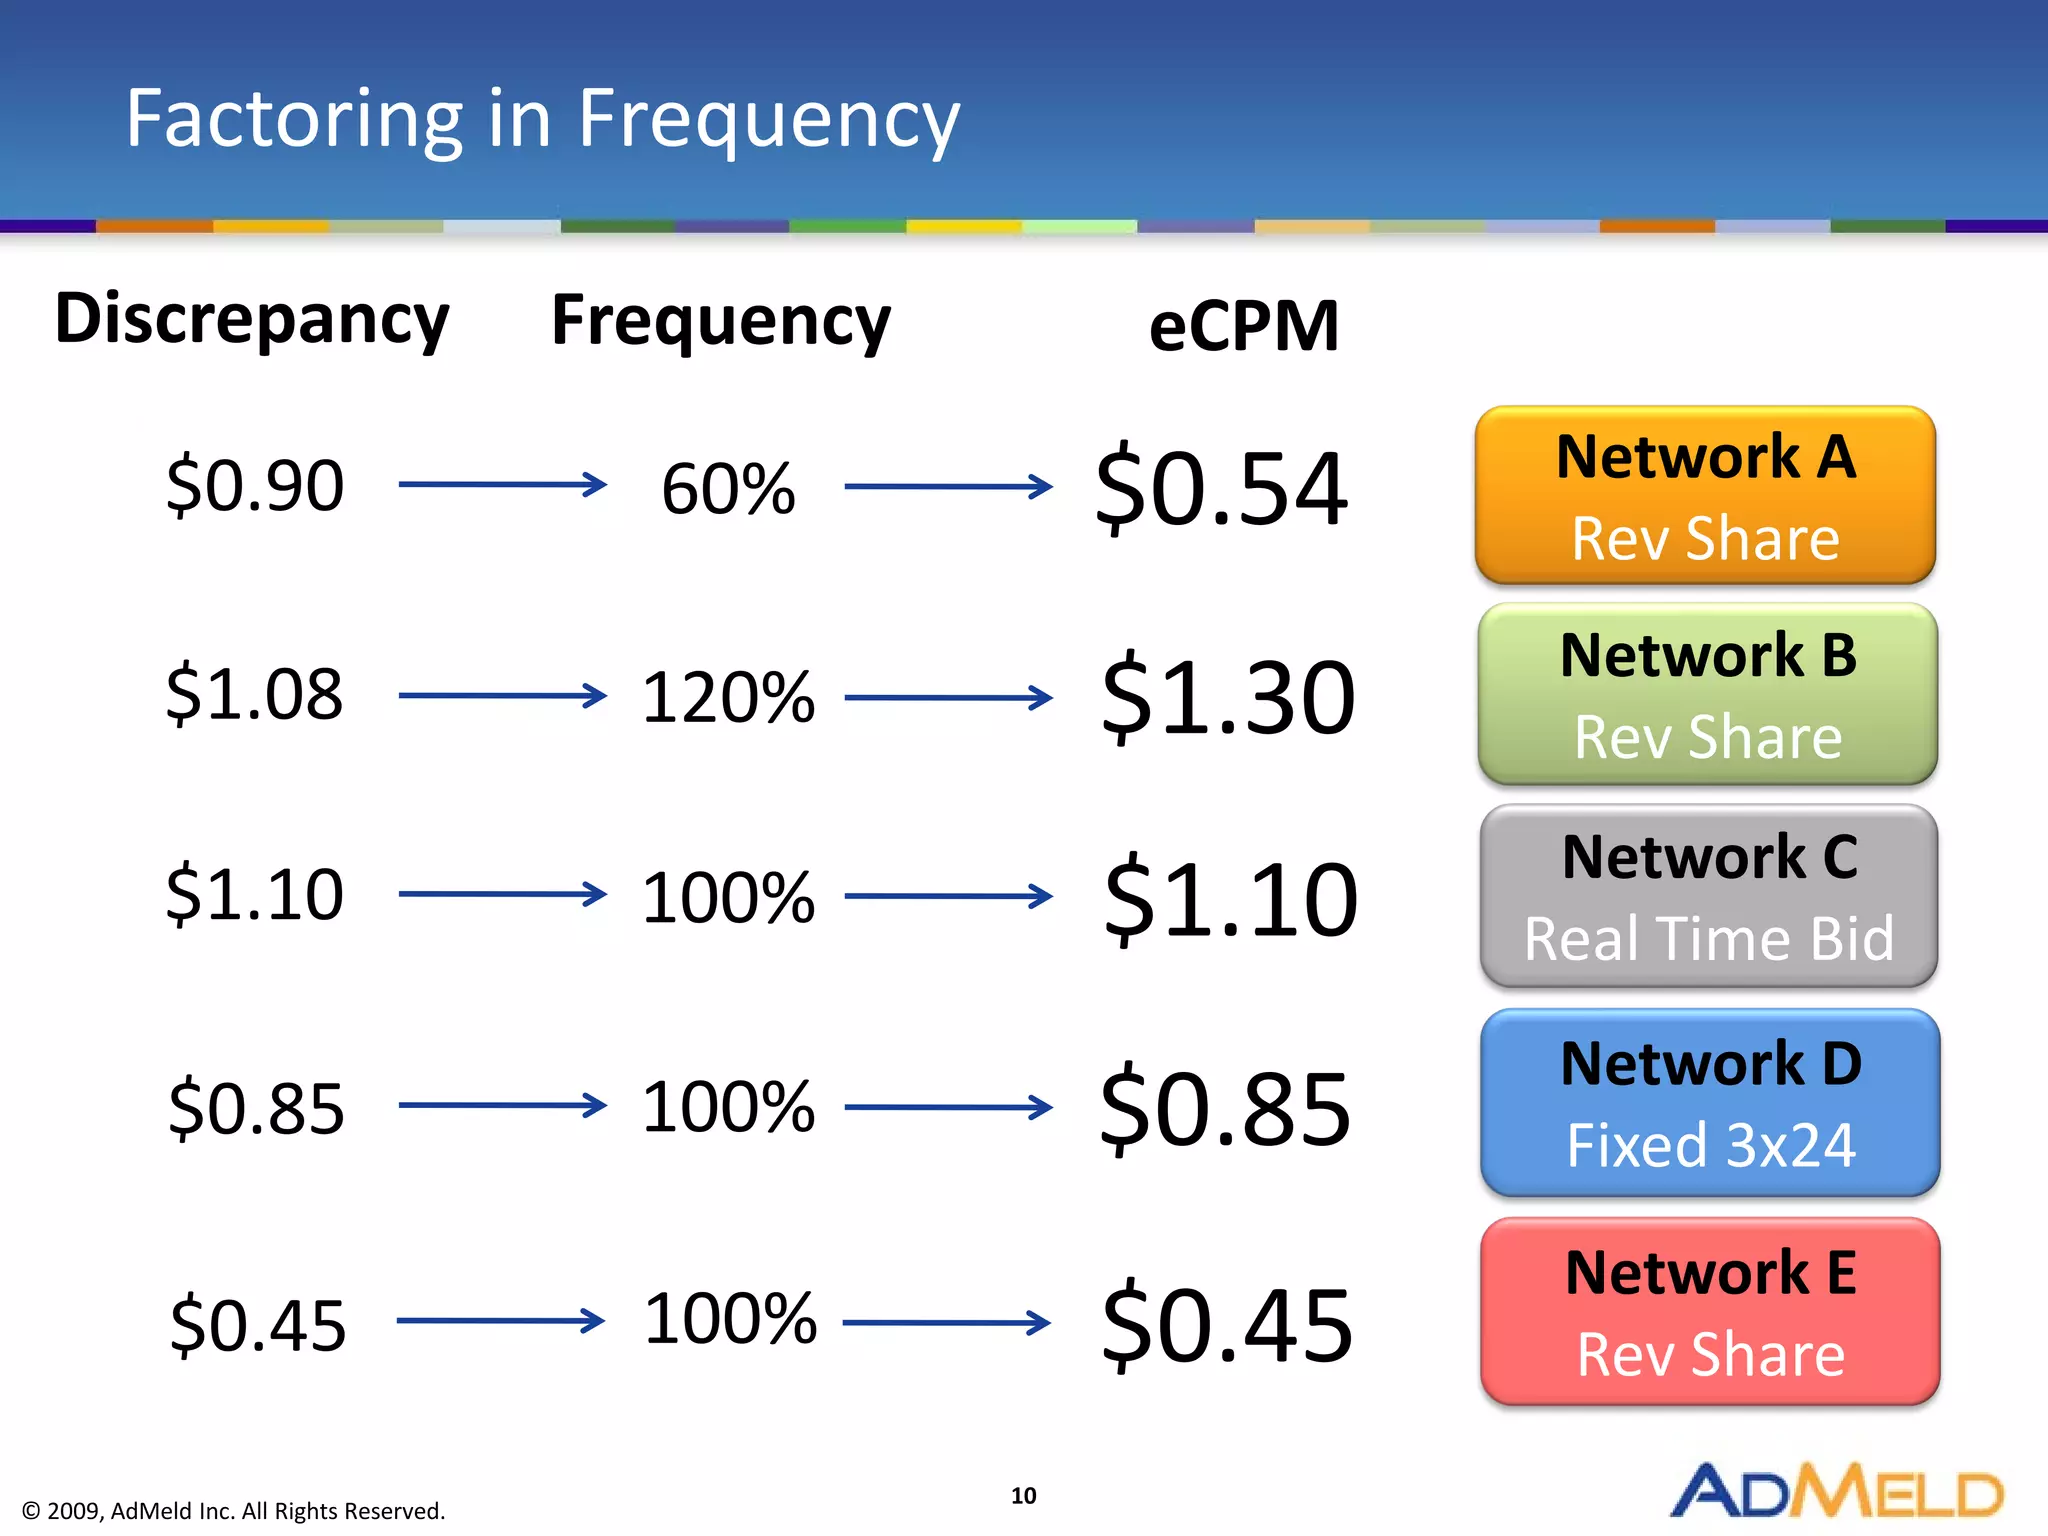
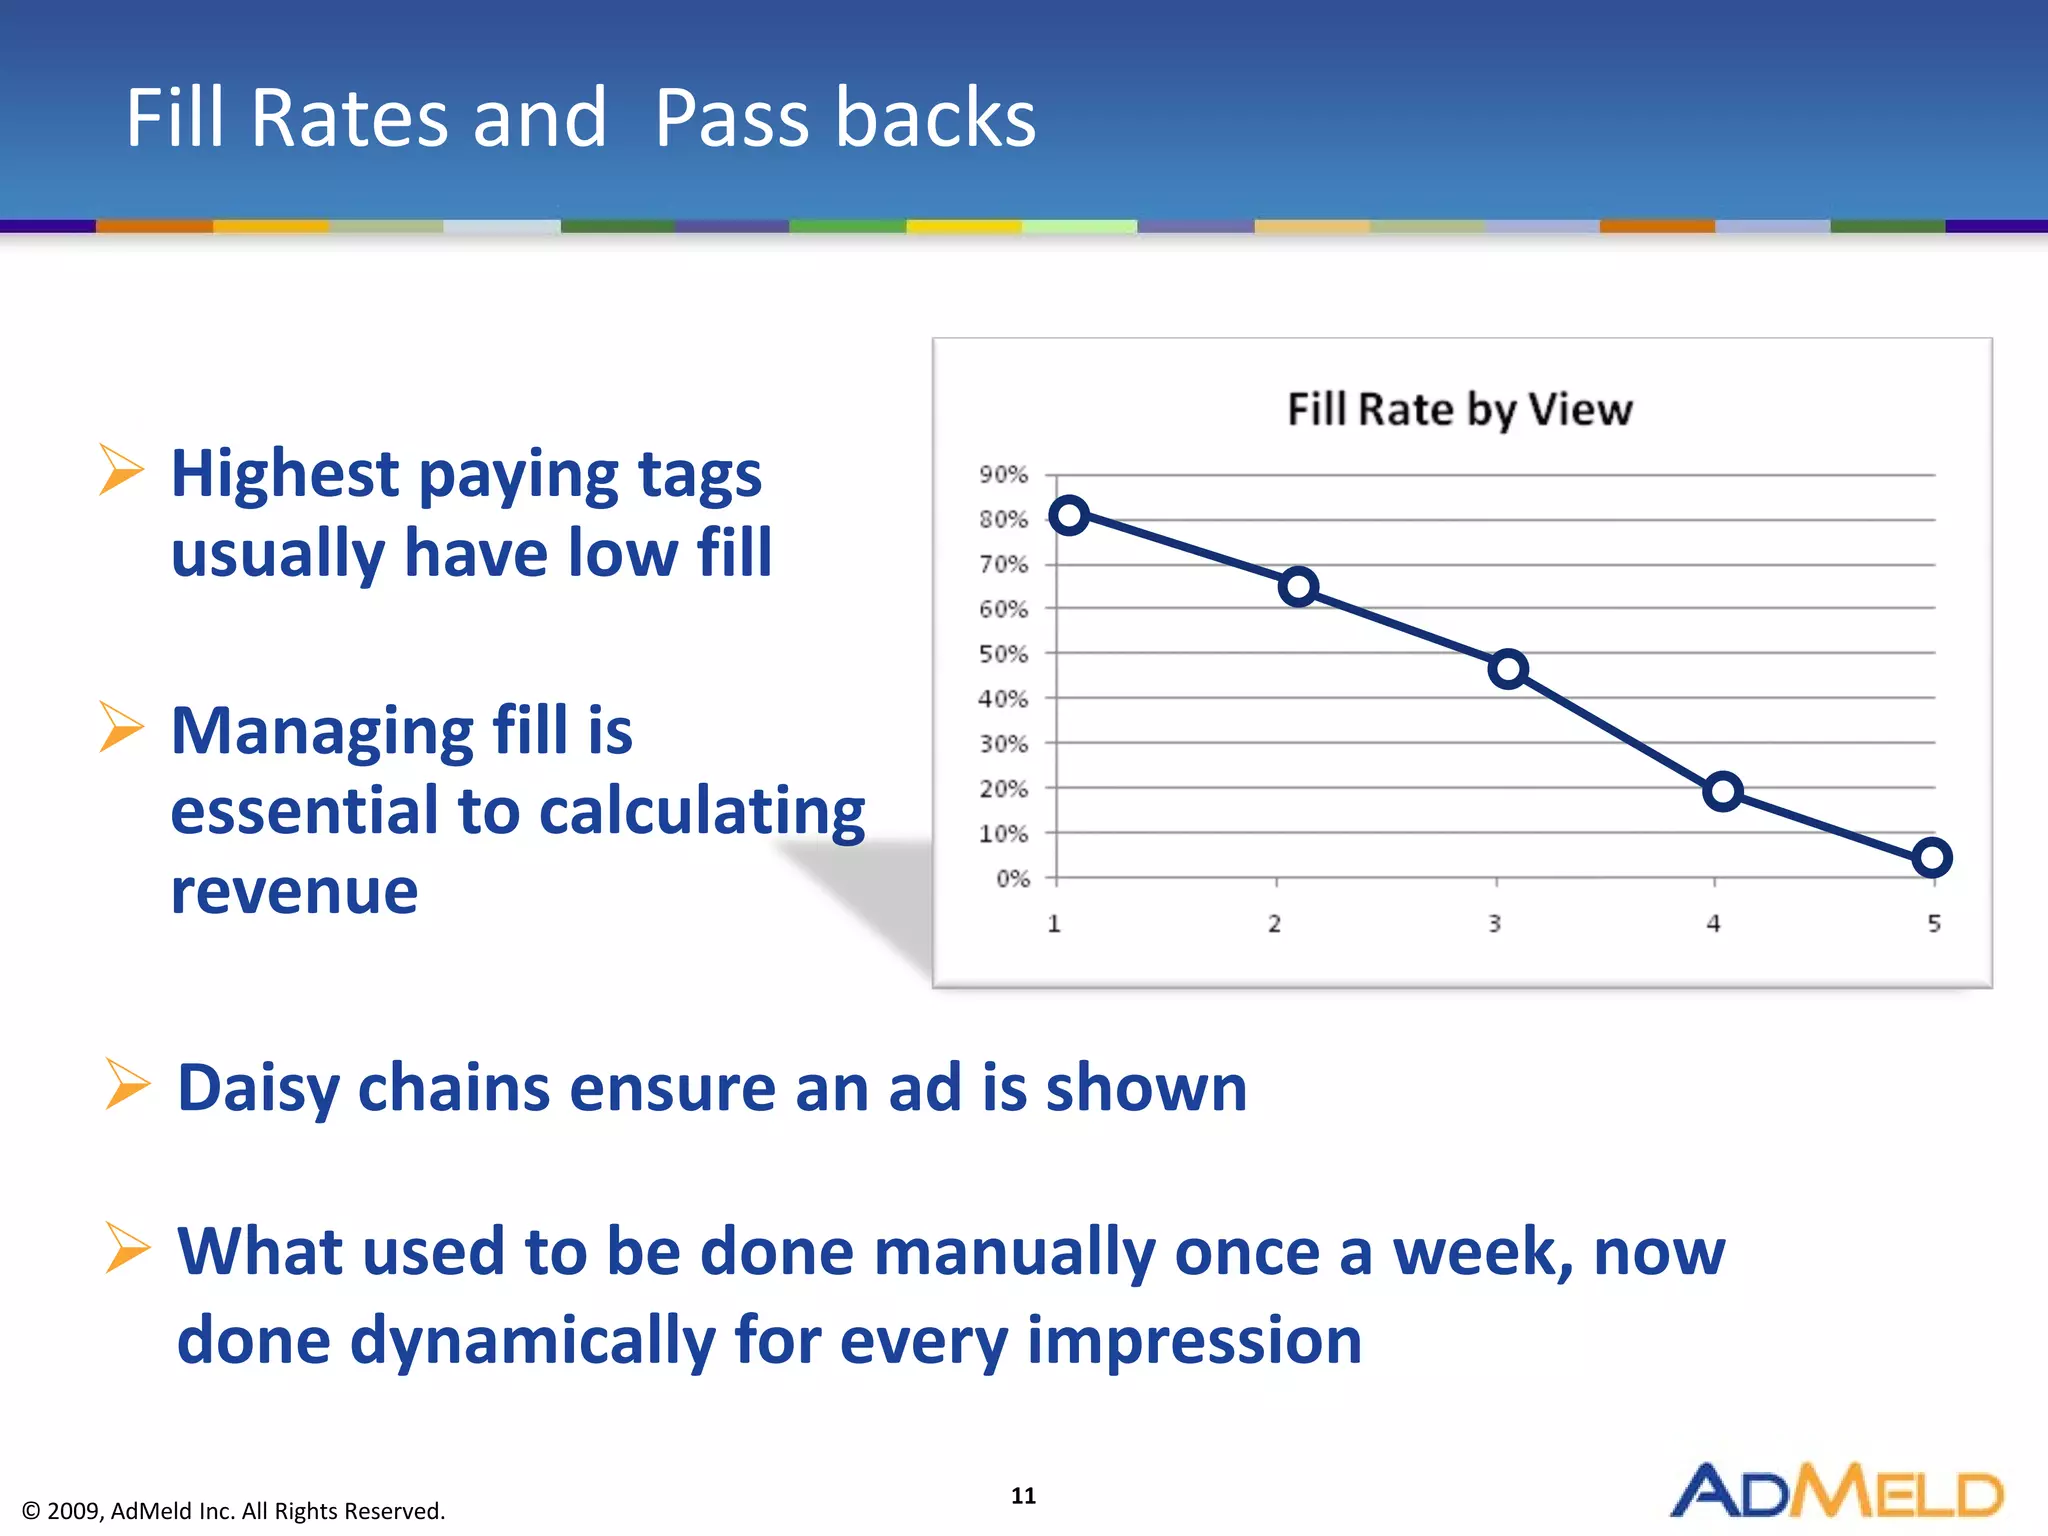
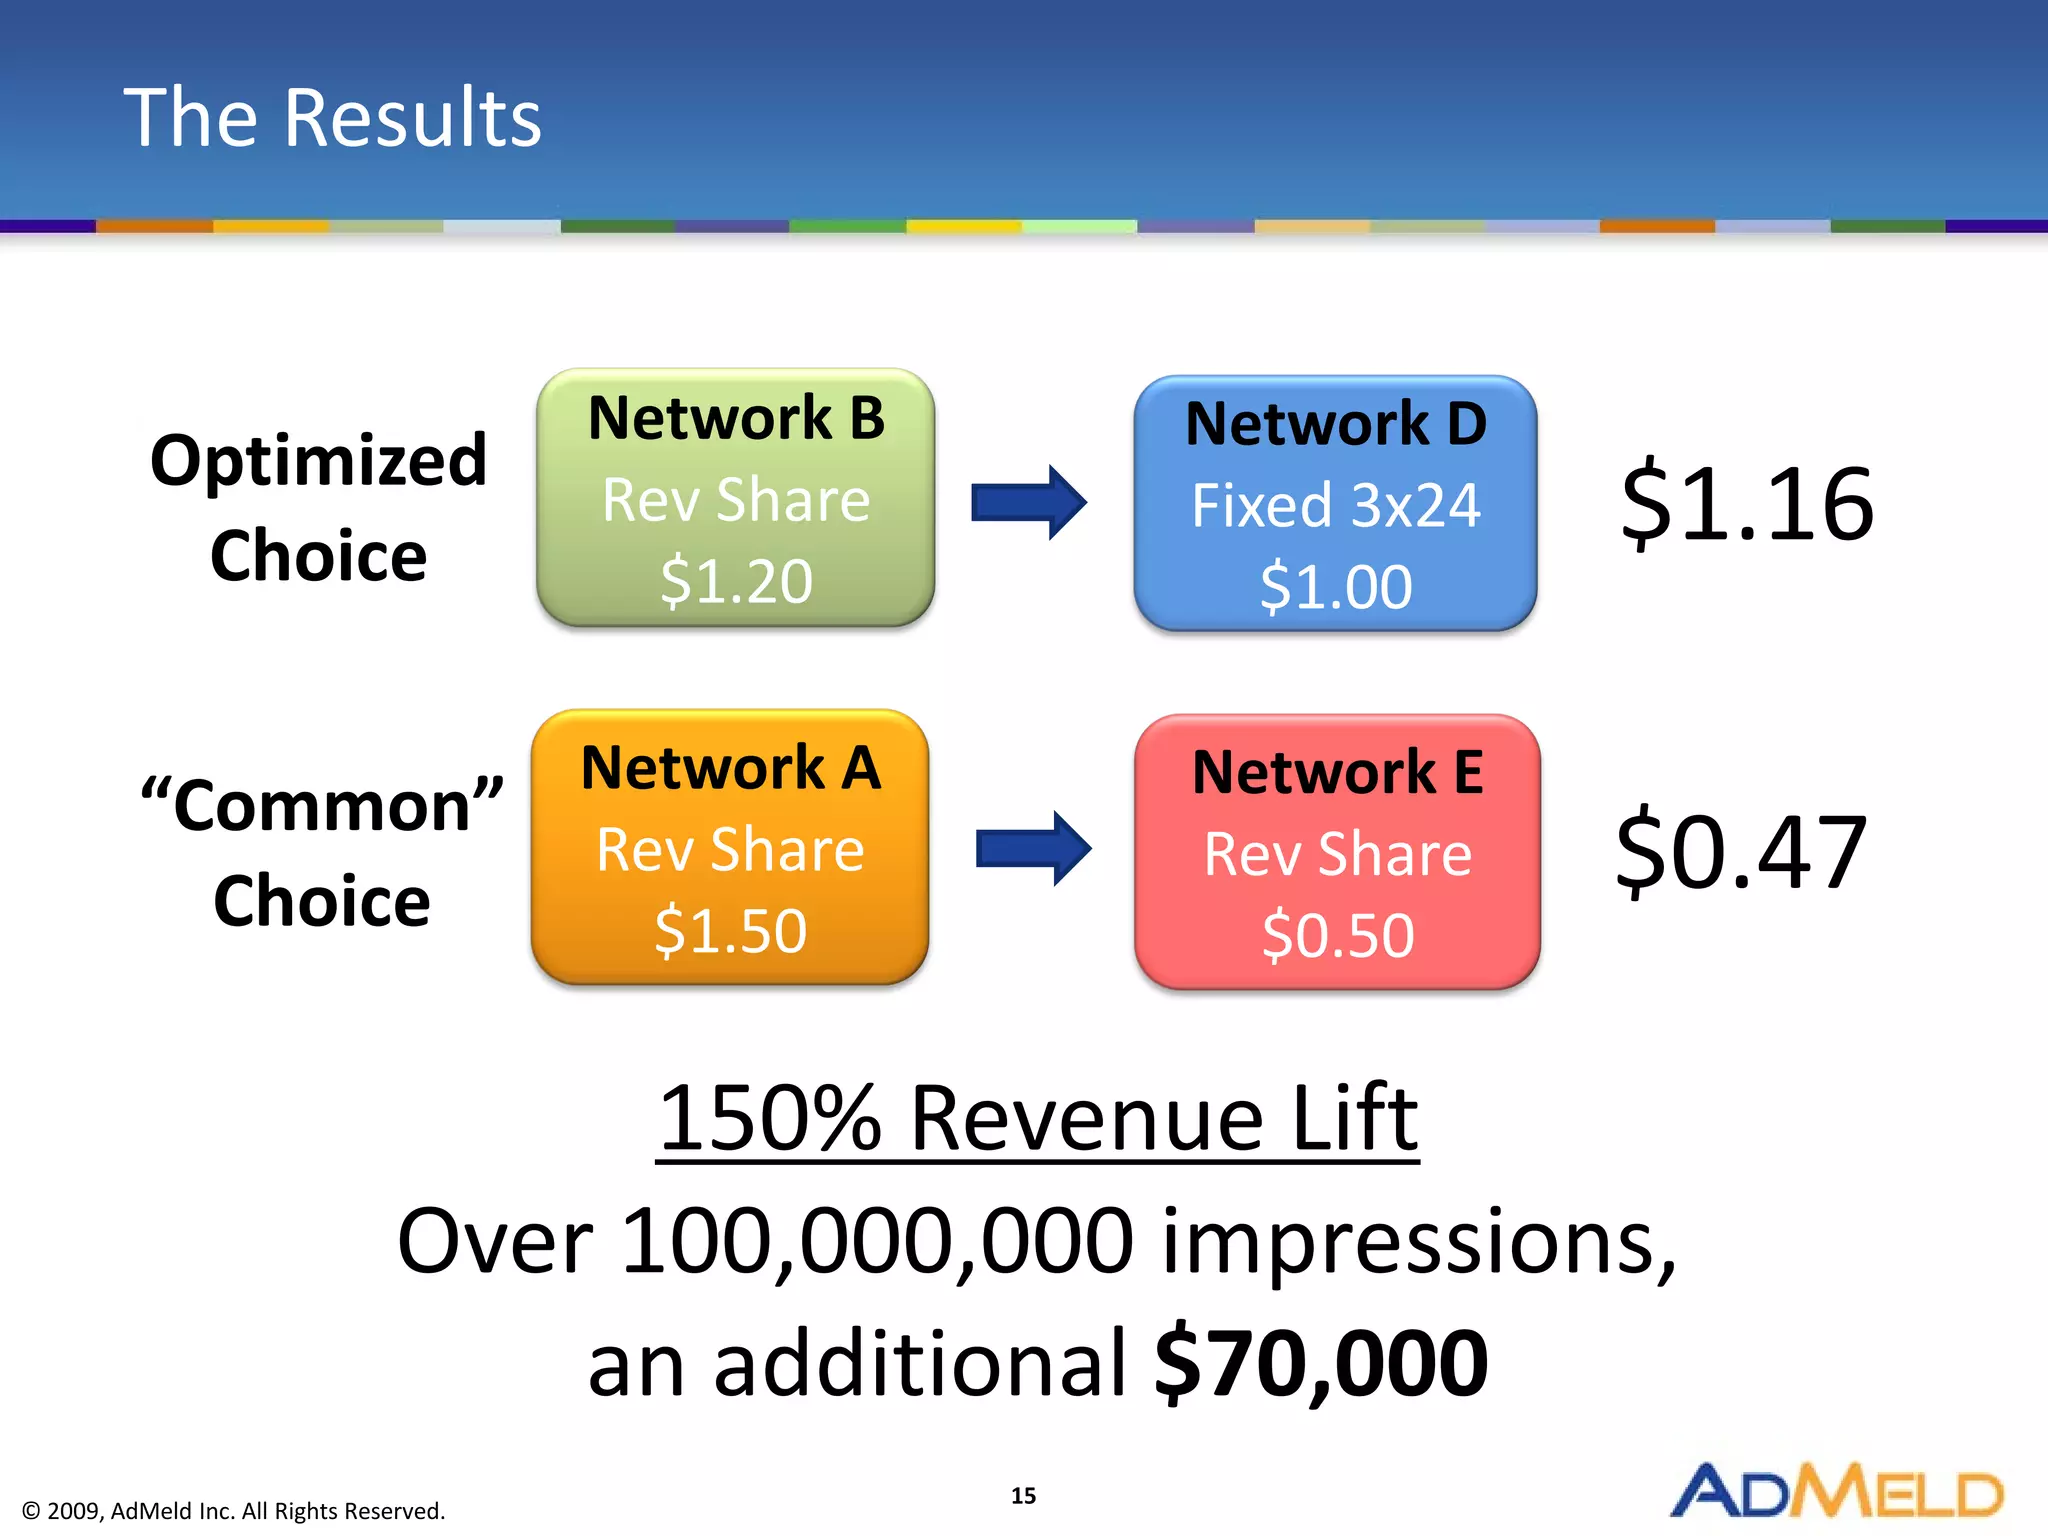

The document discusses the remnant inventory problem faced by premium publishers and outlines how discretionary optimization can enhance revenues, lower costs, and protect brand reputation. It emphasizes the importance of managing discrepancies, frequency, and fill rates in ad optimization while introducing real-time bidding (RTB) as a solution for maximizing revenue. The findings illustrate significant revenue lifts through dynamic strategies and the importance of data in the ad industry.


![Coded Agents – with UiPath SDK + LangGraph [Virtual Hands-on Workshop]](https://cdn.slidesharecdn.com/ss_thumbnails/codedagentsdeck-251215155422-5497c599-thumbnail.jpg?width=640&height=640&fit=bounds)


