SlideShare a Scribd company logo
1 of 5
Download to read offline
summary Report
Zaqui Saiyed
Date Created:06/21/21
Date Opened: 11/11/21
Industry SeriesID
New single-family general contractors CEU2023611503
Residential remodelers CEU2023611803
Industrial building CEU2023621003
Commercial building CEU2023622003
All the industries had increases and decreases in average rates around the same time.
In 2016 industries hit their median rate.
Themonth ofJunehadthelowestaverageratefor allindustries.
I chose these four industries because I've always had an interest in real estate and
construction
The Industry with the highest average rates in most recent two years is the
commercial building industry with an average rate of $36.24 between 2019-2021
The Industry with the lowest average rates in most recent two years is the residential
remodelers industry with an average rate of $27.83 between 2019-2021
The industrial building and commercial building industries have a similar pay with a
difference of only $1.02
The Difference between the Highest rate and lowest rate form 2021 is of $8.59
Thedifferencebetween theaverageratesfor industrialbuildingandcommercial
buildingisonly $0.42
Pivot Tables
Zaqui Saiyed
Date Created:06/21/21
Date Opened: 11/11/21
Row Labels
Averageof New single-family
generalcontractors
Averageof Residential
remodelers
Averageof Industrial
building
Averageof Commercial
building
Jan $27.46 $24.53 $32.37 $32.71
Feb $27.20 $24.71 $32.47 $32.88
Mar $27.26 $24.79 $32.45 $32.89
Apr $26.85 $24.57 $31.91 $32.50
May $26.79 $24.47 $31.85 $32.38
Jun $26.66 $24.23 $31.63 $32.19
Jul $26.94 $24.28 $31.93 $32.36
Aug $26.84 $24.40 $31.91 $32.47
Sep $27.06 $24.55 $32.24 $32.72
Oct $27.26 $24.55 $32.47 $32.65
Nov $27.43 $24.67 $32.58 $32.74
Dec $27.63 $24.84 $32.61 $32.96
GrandTotal $27.12 $24.55 $32.21 $32.63
Row Labels
Averageof New single-family
generalcontractors
Averageof Residential
remodelers
Averageof Industrial
building
Averageof Commercial
building
2011 $22.21 $21.17 $28.56 $29.53
2012 $22.85 $21.29 $29.33 $29.83
2013 $24.29 $22.25 $30.13 $30.07
2014 $25.33 $22.79 $30.74 $31.27
2015 $26.26 $23.95 $31.73 $31.91
2016 $26.81 $25.35 $32.69 $32.54
2017 $28.38 $25.45 $33.09 $33.45
2018 $30.27 $26.94 $33.85 $34.51
2019 $31.25 $27.11 $34.64 $35.28
2020 $32.17 $28.13 $36.17 $36.67
2021 $32.64 $28.98 $36.78 $37.48
GrandTotal $27.12 $24.55 $32.21 $32.63
Main Data
Zaqui Saiyid
Date Created:06/21/21
Date Opened: 11/11/21
Year Month
Newsingle-
family general
contractors
Residential
remodelers
Industrial
building
Commercial
building
2011 Jan $23.83 $21.41 $28.46 $29.36
2011 Feb $22.83 $21.58 $28.55 $29.61
2011 Mar $22.33 $21.49 $28.75 $29.58
2011 Apr $21.92 $21.65 $28.26 $29.55
2011 May $22.17 $21.15 $28.10 $29.31
2011 Jun $21.90 $20.77 $27.86 $29.29
2011 Jul $21.25 $20.98 $28.44 $29.37
2011 Aug $21.31 $20.97 $28.80 $29.53
2011 Sep $21.56 $21.13 $28.99 $29.67
2011 Oct $22.31 $20.89 $29.01 $29.60
2011 Nov $22.45 $21.04 $28.75 $29.64
2011 Dec $22.69 $20.99 $28.80 $29.79
2012 Jan $22.71 $20.94 $28.85 $29.98
2012 Feb $22.37 $21.30 $28.83 $29.99
2012 Mar $22.38 $21.53 $29.11 $30.14
2012 Apr $22.63 $21.54 $28.84 $30.02
2012 May $22.84 $21.34 $29.17 $29.86
2012 Jun $22.60 $21.19 $29.13 $29.55
2012 Jul $22.88 $21.05 $29.40 $29.52
2012 Aug $22.82 $21.18 $29.28 $29.69
2012 Sep $22.89 $21.21 $29.90 $29.87
2012 Oct $23.17 $21.15 $29.59 $29.63
2012 Nov $23.20 $21.42 $29.78 $29.74
2012 Dec $23.75 $21.66 $30.03 $29.94
2013 Jan $23.75 $21.84 $29.71 $30.04
2013 Feb $23.78 $21.78 $29.93 $30.10
2013 Mar $23.81 $22.13 $30.36 $30.16
2013 Apr $24.14 $22.27 $30.44 $30.09
2013 May $23.99 $22.24 $29.84 $30.07
2013 Jun $23.72 $21.88 $29.71 $29.78
2013 Jul $24.53 $22.33 $29.39 $30.01
2013 Aug $24.16 $22.58 $29.62 $30.00
2013 Sep $24.53 $22.61 $30.47 $30.13
2013 Oct $24.79 $22.53 $30.75 $29.92
2013 Nov $25.13 $22.34 $30.71 $29.94
2013 Dec $25.17 $22.50 $30.67 $30.56
2014 Jan $24.63 $22.61 $31.65 $30.95
2014 Feb $25.34 $22.99 $31.02 $31.38
2014 Mar $25.02 $22.81 $30.87 $31.22
2014 Apr $25.12 $22.78 $30.58 $31.04
2014 May $25.11 $22.86 $30.53 $31.28
2014 Jun $25.41 $22.32 $30.23 $31.19
2014 Jul $25.59 $22.63 $30.39 $31.25
2014 Aug $25.09 $22.74 $30.11 $31.12
2014 Sep $25.54 $22.58 $30.41 $31.41
2014 Oct $25.58 $22.94 $30.80 $31.38
Main Data
Zaqui Saiyid
Date Created:06/21/21
Date Opened: 11/11/21
Year Month
Newsingle-
family general
contractors
Residential
remodelers
Industrial
building
Commercial
building
2014 Nov $25.87 $22.99 $31.17 $31.52
2014 Dec $25.67 $23.17 $31.09 $31.55
2015 Jan $26.08 $23.14 $31.50 $31.73
2015 Feb $26.06 $23.55 $31.92 $31.85
2015 Mar $26.43 $23.73 $31.36 $32.02
2015 Apr $26.04 $23.83 $31.80 $32.05
2015 May $26.01 $23.73 $31.52 $31.92
2015 Jun $25.98 $23.80 $31.44 $31.72
2015 Jul $26.26 $23.36 $31.43 $31.72
2015 Aug $26.19 $24.01 $31.47 $31.67
2015 Sep $26.26 $24.47 $31.64 $32.11
2015 Oct $26.46 $24.45 $31.80 $32.00
2015 Nov $26.65 $24.72 $32.68 $32.11
2015 Dec $26.64 $24.57 $32.17 $32.03
2016 Jan $26.80 $25.18 $32.09 $32.06
2016 Feb $26.65 $25.50 $32.17 $32.10
2016 Mar $26.60 $25.43 $32.68 $32.09
2016 Apr $26.61 $25.61 $32.89 $32.33
2016 May $26.27 $25.39 $32.92 $32.46
2016 Jun $26.36 $25.09 $32.19 $32.13
2016 Jul $26.99 $25.39 $32.45 $32.60
2016 Aug $26.90 $25.22 $32.40 $32.79
2016 Sep $26.78 $25.42 $32.76 $32.80
2016 Oct $27.09 $25.43 $33.13 $32.82
2016 Nov $27.23 $25.32 $33.16 $33.00
2016 Dec $27.45 $25.20 $33.42 $33.24
2017 Jan $28.54 $25.35 $33.49 $33.09
2017 Feb $27.60 $25.37 $33.09 $33.05
2017 Mar $28.13 $25.50 $33.12 $33.19
2017 Apr $28.45 $25.42 $32.93 $33.28
2017 May $27.83 $25.68 $32.77 $33.12
2017 Jun $27.91 $25.15 $32.34 $32.97
2017 Jul $28.44 $25.22 $32.55 $33.22
2017 Aug $28.29 $25.39 $32.73 $33.30
2017 Sep $28.69 $25.41 $33.30 $33.94
2017 Oct $28.38 $25.52 $33.68 $33.87
2017 Nov $28.86 $25.32 $33.64 $34.06
2017 Dec $29.47 $26.12 $33.46 $34.30
2018 Jan $30.30 $25.97 $34.06 $34.52
2018 Feb $30.02 $26.12 $34.00 $34.57
2018 Mar $29.88 $26.57 $33.72 $34.44
2018 Apr $30.13 $26.94 $33.71 $34.69
2018 May $30.51 $26.80 $33.33 $34.53
2018 Jun $29.70 $27.43 $33.04 $34.16
2018 Jul $29.90 $27.18 $34.04 $34.18
2018 Aug $29.93 $26.96 $33.12 $34.37
Main Data
Zaqui Saiyid
Date Created:06/21/21
Date Opened: 11/11/21
Year Month
Newsingle-
family general
contractors
Residential
remodelers
Industrial
building
Commercial
building
2018 Sep $30.25 $27.40 $33.65 $34.64
2018 Oct $30.57 $26.95 $34.26 $34.69
2018 Nov $30.74 $27.15 $34.20 $34.49
2018 Dec $31.28 $27.82 $35.06 $34.87
2019 Jan $30.99 $27.01 $34.77 $34.70
2019 Feb $30.93 $27.14 $34.65 $35.07
2019 Mar $30.79 $26.87 $34.43 $34.92
2019 Apr $31.09 $27.47 $34.49 $35.09
2019 May $31.39 $27.21 $34.42 $34.98
2019 Jun $31.38 $26.96 $34.51 $34.86
2019 Jul $31.52 $26.67 $34.52 $35.13
2019 Aug $30.94 $27.05 $34.49 $35.47
2019 Sep $31.26 $27.21 $34.65 $35.65
2019 Oct $31.71 $27.13 $34.95 $35.68
2019 Nov $31.41 $27.21 $34.92 $35.75
2019 Dec $31.56 $27.35 $34.90 $36.03
2020 Jan $31.55 $27.30 $34.93 $35.99
2020 Feb $31.38 $27.52 $35.54 $36.35
2020 Mar $31.71 $27.84 $36.13 $36.63
2020 Apr $32.34 $28.22 $35.19 $36.82
2020 May $31.79 $28.32 $35.92 $36.31
2020 Jun $31.68 $27.72 $35.89 $36.26
2020 Jul $32.05 $27.99 $36.70 $36.62
2020 Aug $32.73 $27.90 $37.10 $36.75
2020 Sep $32.82 $28.08 $36.64 $36.96
2020 Oct $32.53 $28.52 $36.72 $36.90
2020 Nov $32.78 $29.14 $36.81 $37.18
2020 Dec $32.63 $29.06 $36.47 $37.26
2021 Jan $32.86 $29.11 $36.51 $37.44
2021 Feb $32.28 $29.00 $37.44 $37.59
2021 Mar $32.79 $28.83 $36.40 $37.42

More Related Content

What's hot

REBGV January 2020 Statistics Package
REBGV January 2020 Statistics Package REBGV January 2020 Statistics Package
REBGV January 2020 Statistics Package Vicky Aulakh
 
Rebgv stats-pkg-may-2019
Rebgv stats-pkg-may-2019Rebgv stats-pkg-may-2019
Rebgv stats-pkg-may-2019Kathryn Huang
 
Lake Lanier Homes Sales Analysis January 2020
Lake Lanier Homes Sales Analysis January 2020Lake Lanier Homes Sales Analysis January 2020
Lake Lanier Homes Sales Analysis January 2020Arthur Prescott
 
Rebgv Stats Package September 2020
Rebgv Stats Package September 2020Rebgv Stats Package September 2020
Rebgv Stats Package September 2020Vicky Aulakh
 
Metro Vancouver - Stats Centre Reports - August 2021
Metro Vancouver - Stats Centre Reports - August 2021Metro Vancouver - Stats Centre Reports - August 2021
Metro Vancouver - Stats Centre Reports - August 2021Vicky Aulakh
 
December 2018 Greater Boston Real Estate Market Trends
December 2018 Greater Boston Real Estate Market TrendsDecember 2018 Greater Boston Real Estate Market Trends
December 2018 Greater Boston Real Estate Market TrendsJoe Schutt
 
Metro Vancouver Statistics September 2021
Metro Vancouver Statistics September 2021 Metro Vancouver Statistics September 2021
Metro Vancouver Statistics September 2021 VickyAulakh1
 
Rebgv stats-pkg-august-2019
Rebgv stats-pkg-august-2019Rebgv stats-pkg-august-2019
Rebgv stats-pkg-august-2019Vicky Aulakh
 
City council july 2, 2013 dsa 1st quarter report 2013
City council july 2, 2013   dsa 1st quarter report 2013City council july 2, 2013   dsa 1st quarter report 2013
City council july 2, 2013 dsa 1st quarter report 2013City of San Angelo Texas
 
February 2022 Okanagan Real Estate Board Statistics Package With Charts & Graphs
February 2022 Okanagan Real Estate Board Statistics Package With Charts & GraphsFebruary 2022 Okanagan Real Estate Board Statistics Package With Charts & Graphs
February 2022 Okanagan Real Estate Board Statistics Package With Charts & GraphsVicky Aulakh
 
Rebgv stats-pkg-february-2018
Rebgv stats-pkg-february-2018Rebgv stats-pkg-february-2018
Rebgv stats-pkg-february-2018Kathryn Huang
 
Real Estate Board of Greater Vancouver Statistics Package March 2021
Real Estate Board of Greater Vancouver Statistics Package March 2021Real Estate Board of Greater Vancouver Statistics Package March 2021
Real Estate Board of Greater Vancouver Statistics Package March 2021Vicky Aulakh
 

What's hot (12)

REBGV January 2020 Statistics Package
REBGV January 2020 Statistics Package REBGV January 2020 Statistics Package
REBGV January 2020 Statistics Package
 
Rebgv stats-pkg-may-2019
Rebgv stats-pkg-may-2019Rebgv stats-pkg-may-2019
Rebgv stats-pkg-may-2019
 
Lake Lanier Homes Sales Analysis January 2020
Lake Lanier Homes Sales Analysis January 2020Lake Lanier Homes Sales Analysis January 2020
Lake Lanier Homes Sales Analysis January 2020
 
Rebgv Stats Package September 2020
Rebgv Stats Package September 2020Rebgv Stats Package September 2020
Rebgv Stats Package September 2020
 
Metro Vancouver - Stats Centre Reports - August 2021
Metro Vancouver - Stats Centre Reports - August 2021Metro Vancouver - Stats Centre Reports - August 2021
Metro Vancouver - Stats Centre Reports - August 2021
 
December 2018 Greater Boston Real Estate Market Trends
December 2018 Greater Boston Real Estate Market TrendsDecember 2018 Greater Boston Real Estate Market Trends
December 2018 Greater Boston Real Estate Market Trends
 
Metro Vancouver Statistics September 2021
Metro Vancouver Statistics September 2021 Metro Vancouver Statistics September 2021
Metro Vancouver Statistics September 2021
 
Rebgv stats-pkg-august-2019
Rebgv stats-pkg-august-2019Rebgv stats-pkg-august-2019
Rebgv stats-pkg-august-2019
 
City council july 2, 2013 dsa 1st quarter report 2013
City council july 2, 2013   dsa 1st quarter report 2013City council july 2, 2013   dsa 1st quarter report 2013
City council july 2, 2013 dsa 1st quarter report 2013
 
February 2022 Okanagan Real Estate Board Statistics Package With Charts & Graphs
February 2022 Okanagan Real Estate Board Statistics Package With Charts & GraphsFebruary 2022 Okanagan Real Estate Board Statistics Package With Charts & Graphs
February 2022 Okanagan Real Estate Board Statistics Package With Charts & Graphs
 
Rebgv stats-pkg-february-2018
Rebgv stats-pkg-february-2018Rebgv stats-pkg-february-2018
Rebgv stats-pkg-february-2018
 
Real Estate Board of Greater Vancouver Statistics Package March 2021
Real Estate Board of Greater Vancouver Statistics Package March 2021Real Estate Board of Greater Vancouver Statistics Package March 2021
Real Estate Board of Greater Vancouver Statistics Package March 2021
 

Similar to Assignment4 zaqui saiyed Portfolio

Visualizing Data
Visualizing DataVisualizing Data
Visualizing DataMarc Tejeda
 
Data Analysis and Reporting spreadsheet
Data Analysis and Reporting spreadsheet Data Analysis and Reporting spreadsheet
Data Analysis and Reporting spreadsheet AlexLeite33
 
Levi Leitma Hourly Wage Comparisons in the Music Industry
Levi Leitma Hourly Wage Comparisons in the Music IndustryLevi Leitma Hourly Wage Comparisons in the Music Industry
Levi Leitma Hourly Wage Comparisons in the Music IndustryLeviLeitma
 
Industry Summary Report
Industry Summary ReportIndustry Summary Report
Industry Summary ReportChaseTodaro1
 
Data Visualization
Data VisualizationData Visualization
Data VisualizationLuisMarciaga
 
Assignment4 laurenandrews
Assignment4 laurenandrewsAssignment4 laurenandrews
Assignment4 laurenandrewsLaurenAndrews36
 
Edward tangel 4.4assignment4
Edward tangel 4.4assignment4Edward tangel 4.4assignment4
Edward tangel 4.4assignment4EdwardTangel
 
A4 yolandawardanalysis
A4 yolandawardanalysisA4 yolandawardanalysis
A4 yolandawardanalysisYolandaWard2
 
San Francisco Market Report October 2022.pdf
San Francisco Market Report October 2022.pdfSan Francisco Market Report October 2022.pdf
San Francisco Market Report October 2022.pdfRonny Budiutama
 
Data Analysis and Reporting
Data Analysis and ReportingData Analysis and Reporting
Data Analysis and ReportingKeila Olea
 
Assignment 4 dar gilberto pena
Assignment 4 dar gilberto penaAssignment 4 dar gilberto pena
Assignment 4 dar gilberto penagilbertoPena2
 

Similar to Assignment4 zaqui saiyed Portfolio (20)

Data Analysis A4
Data Analysis A4Data Analysis A4
Data Analysis A4
 
Visualizing Data
Visualizing DataVisualizing Data
Visualizing Data
 
Data Analysis and Reporting spreadsheet
Data Analysis and Reporting spreadsheet Data Analysis and Reporting spreadsheet
Data Analysis and Reporting spreadsheet
 
Levi Leitma Hourly Wage Comparisons in the Music Industry
Levi Leitma Hourly Wage Comparisons in the Music IndustryLevi Leitma Hourly Wage Comparisons in the Music Industry
Levi Leitma Hourly Wage Comparisons in the Music Industry
 
A4SalomeSa.pdf
A4SalomeSa.pdfA4SalomeSa.pdf
A4SalomeSa.pdf
 
A4SalomeS.pdf
A4SalomeS.pdfA4SalomeS.pdf
A4SalomeS.pdf
 
A4SalomeS.pdf
A4SalomeS.pdfA4SalomeS.pdf
A4SalomeS.pdf
 
Industry Summary Report
Industry Summary ReportIndustry Summary Report
Industry Summary Report
 
Data Visualization
Data VisualizationData Visualization
Data Visualization
 
Assignment4 laurenandrews
Assignment4 laurenandrewsAssignment4 laurenandrews
Assignment4 laurenandrews
 
Edward tangel 4.4assignment4
Edward tangel 4.4assignment4Edward tangel 4.4assignment4
Edward tangel 4.4assignment4
 
A4 yolandawardanalysis
A4 yolandawardanalysisA4 yolandawardanalysis
A4 yolandawardanalysis
 
A4 yolandawardzip
A4 yolandawardzipA4 yolandawardzip
A4 yolandawardzip
 
Visualizing data
Visualizing dataVisualizing data
Visualizing data
 
Market Analysis
Market AnalysisMarket Analysis
Market Analysis
 
San Francisco Market Report October 2022.pdf
San Francisco Market Report October 2022.pdfSan Francisco Market Report October 2022.pdf
San Francisco Market Report October 2022.pdf
 
Data Analysis and Reporting
Data Analysis and ReportingData Analysis and Reporting
Data Analysis and Reporting
 
A4 kayla
A4 kaylaA4 kayla
A4 kayla
 
Data Analysis Report
Data Analysis ReportData Analysis Report
Data Analysis Report
 
Assignment 4 dar gilberto pena
Assignment 4 dar gilberto penaAssignment 4 dar gilberto pena
Assignment 4 dar gilberto pena
 

Recently uploaded

Monthly Social Media Update April 2024 pptx.pptx
Monthly Social Media Update April 2024 pptx.pptxMonthly Social Media Update April 2024 pptx.pptx
Monthly Social Media Update April 2024 pptx.pptxAndy Lambert
 
Pharma Works Profile of Karan Communications
Pharma Works Profile of Karan CommunicationsPharma Works Profile of Karan Communications
Pharma Works Profile of Karan Communicationskarancommunications
 
Value Proposition canvas- Customer needs and pains
Value Proposition canvas- Customer needs and painsValue Proposition canvas- Customer needs and pains
Value Proposition canvas- Customer needs and painsP&CO
 
Call Girls in Gomti Nagar - 7388211116 - With room Service
Call Girls in Gomti Nagar - 7388211116  - With room ServiceCall Girls in Gomti Nagar - 7388211116  - With room Service
Call Girls in Gomti Nagar - 7388211116 - With room Servicediscovermytutordmt
 
0183760ssssssssssssssssssssssssssss00101011 (27).pdf
0183760ssssssssssssssssssssssssssss00101011 (27).pdf0183760ssssssssssssssssssssssssssss00101011 (27).pdf
0183760ssssssssssssssssssssssssssss00101011 (27).pdfRenandantas16
 
Dr. Admir Softic_ presentation_Green Club_ENG.pdf
Dr. Admir Softic_ presentation_Green Club_ENG.pdfDr. Admir Softic_ presentation_Green Club_ENG.pdf
Dr. Admir Softic_ presentation_Green Club_ENG.pdfAdmir Softic
 
Insurers' journeys to build a mastery in the IoT usage
Insurers' journeys to build a mastery in the IoT usageInsurers' journeys to build a mastery in the IoT usage
Insurers' journeys to build a mastery in the IoT usageMatteo Carbone
 
Monte Carlo simulation : Simulation using MCSM
Monte Carlo simulation : Simulation using MCSMMonte Carlo simulation : Simulation using MCSM
Monte Carlo simulation : Simulation using MCSMRavindra Nath Shukla
 
FULL ENJOY Call Girls In Majnu Ka Tilla, Delhi Contact Us 8377877756
FULL ENJOY Call Girls In Majnu Ka Tilla, Delhi Contact Us 8377877756FULL ENJOY Call Girls In Majnu Ka Tilla, Delhi Contact Us 8377877756
FULL ENJOY Call Girls In Majnu Ka Tilla, Delhi Contact Us 8377877756dollysharma2066
 
The Coffee Bean & Tea Leaf(CBTL), Business strategy case study
The Coffee Bean & Tea Leaf(CBTL), Business strategy case studyThe Coffee Bean & Tea Leaf(CBTL), Business strategy case study
The Coffee Bean & Tea Leaf(CBTL), Business strategy case studyEthan lee
 
Organizational Transformation Lead with Culture
Organizational Transformation Lead with CultureOrganizational Transformation Lead with Culture
Organizational Transformation Lead with CultureSeta Wicaksana
 
A DAY IN THE LIFE OF A SALESMAN / WOMAN
A DAY IN THE LIFE OF A  SALESMAN / WOMANA DAY IN THE LIFE OF A  SALESMAN / WOMAN
A DAY IN THE LIFE OF A SALESMAN / WOMANIlamathiKannappan
 
Call Girls Jp Nagar Just Call 👗 7737669865 👗 Top Class Call Girl Service Bang...
Call Girls Jp Nagar Just Call 👗 7737669865 👗 Top Class Call Girl Service Bang...Call Girls Jp Nagar Just Call 👗 7737669865 👗 Top Class Call Girl Service Bang...
Call Girls Jp Nagar Just Call 👗 7737669865 👗 Top Class Call Girl Service Bang...amitlee9823
 
Grateful 7 speech thanking everyone that has helped.pdf
Grateful 7 speech thanking everyone that has helped.pdfGrateful 7 speech thanking everyone that has helped.pdf
Grateful 7 speech thanking everyone that has helped.pdfPaul Menig
 
VIP Call Girls In Saharaganj ( Lucknow ) 🔝 8923113531 🔝 Cash Payment (COD) 👒
VIP Call Girls In Saharaganj ( Lucknow  ) 🔝 8923113531 🔝  Cash Payment (COD) 👒VIP Call Girls In Saharaganj ( Lucknow  ) 🔝 8923113531 🔝  Cash Payment (COD) 👒
VIP Call Girls In Saharaganj ( Lucknow ) 🔝 8923113531 🔝 Cash Payment (COD) 👒anilsa9823
 
KYC-Verified Accounts: Helping Companies Handle Challenging Regulatory Enviro...
KYC-Verified Accounts: Helping Companies Handle Challenging Regulatory Enviro...KYC-Verified Accounts: Helping Companies Handle Challenging Regulatory Enviro...
KYC-Verified Accounts: Helping Companies Handle Challenging Regulatory Enviro...Any kyc Account
 
Russian Call Girls In Gurgaon ❤️8448577510 ⊹Best Escorts Service In 24/7 Delh...
Russian Call Girls In Gurgaon ❤️8448577510 ⊹Best Escorts Service In 24/7 Delh...Russian Call Girls In Gurgaon ❤️8448577510 ⊹Best Escorts Service In 24/7 Delh...
Russian Call Girls In Gurgaon ❤️8448577510 ⊹Best Escorts Service In 24/7 Delh...lizamodels9
 
The Path to Product Excellence: Avoiding Common Pitfalls and Enhancing Commun...
The Path to Product Excellence: Avoiding Common Pitfalls and Enhancing Commun...The Path to Product Excellence: Avoiding Common Pitfalls and Enhancing Commun...
The Path to Product Excellence: Avoiding Common Pitfalls and Enhancing Commun...Aggregage
 

Recently uploaded (20)

Monthly Social Media Update April 2024 pptx.pptx
Monthly Social Media Update April 2024 pptx.pptxMonthly Social Media Update April 2024 pptx.pptx
Monthly Social Media Update April 2024 pptx.pptx
 
Pharma Works Profile of Karan Communications
Pharma Works Profile of Karan CommunicationsPharma Works Profile of Karan Communications
Pharma Works Profile of Karan Communications
 
Value Proposition canvas- Customer needs and pains
Value Proposition canvas- Customer needs and painsValue Proposition canvas- Customer needs and pains
Value Proposition canvas- Customer needs and pains
 
Call Girls in Gomti Nagar - 7388211116 - With room Service
Call Girls in Gomti Nagar - 7388211116  - With room ServiceCall Girls in Gomti Nagar - 7388211116  - With room Service
Call Girls in Gomti Nagar - 7388211116 - With room Service
 
0183760ssssssssssssssssssssssssssss00101011 (27).pdf
0183760ssssssssssssssssssssssssssss00101011 (27).pdf0183760ssssssssssssssssssssssssssss00101011 (27).pdf
0183760ssssssssssssssssssssssssssss00101011 (27).pdf
 
Dr. Admir Softic_ presentation_Green Club_ENG.pdf
Dr. Admir Softic_ presentation_Green Club_ENG.pdfDr. Admir Softic_ presentation_Green Club_ENG.pdf
Dr. Admir Softic_ presentation_Green Club_ENG.pdf
 
Insurers' journeys to build a mastery in the IoT usage
Insurers' journeys to build a mastery in the IoT usageInsurers' journeys to build a mastery in the IoT usage
Insurers' journeys to build a mastery in the IoT usage
 
Monte Carlo simulation : Simulation using MCSM
Monte Carlo simulation : Simulation using MCSMMonte Carlo simulation : Simulation using MCSM
Monte Carlo simulation : Simulation using MCSM
 
FULL ENJOY Call Girls In Majnu Ka Tilla, Delhi Contact Us 8377877756
FULL ENJOY Call Girls In Majnu Ka Tilla, Delhi Contact Us 8377877756FULL ENJOY Call Girls In Majnu Ka Tilla, Delhi Contact Us 8377877756
FULL ENJOY Call Girls In Majnu Ka Tilla, Delhi Contact Us 8377877756
 
The Coffee Bean & Tea Leaf(CBTL), Business strategy case study
The Coffee Bean & Tea Leaf(CBTL), Business strategy case studyThe Coffee Bean & Tea Leaf(CBTL), Business strategy case study
The Coffee Bean & Tea Leaf(CBTL), Business strategy case study
 
VVVIP Call Girls In Greater Kailash ➡️ Delhi ➡️ 9999965857 🚀 No Advance 24HRS...
VVVIP Call Girls In Greater Kailash ➡️ Delhi ➡️ 9999965857 🚀 No Advance 24HRS...VVVIP Call Girls In Greater Kailash ➡️ Delhi ➡️ 9999965857 🚀 No Advance 24HRS...
VVVIP Call Girls In Greater Kailash ➡️ Delhi ➡️ 9999965857 🚀 No Advance 24HRS...
 
Organizational Transformation Lead with Culture
Organizational Transformation Lead with CultureOrganizational Transformation Lead with Culture
Organizational Transformation Lead with Culture
 
A DAY IN THE LIFE OF A SALESMAN / WOMAN
A DAY IN THE LIFE OF A  SALESMAN / WOMANA DAY IN THE LIFE OF A  SALESMAN / WOMAN
A DAY IN THE LIFE OF A SALESMAN / WOMAN
 
Call Girls Jp Nagar Just Call 👗 7737669865 👗 Top Class Call Girl Service Bang...
Call Girls Jp Nagar Just Call 👗 7737669865 👗 Top Class Call Girl Service Bang...Call Girls Jp Nagar Just Call 👗 7737669865 👗 Top Class Call Girl Service Bang...
Call Girls Jp Nagar Just Call 👗 7737669865 👗 Top Class Call Girl Service Bang...
 
Grateful 7 speech thanking everyone that has helped.pdf
Grateful 7 speech thanking everyone that has helped.pdfGrateful 7 speech thanking everyone that has helped.pdf
Grateful 7 speech thanking everyone that has helped.pdf
 
VIP Call Girls In Saharaganj ( Lucknow ) 🔝 8923113531 🔝 Cash Payment (COD) 👒
VIP Call Girls In Saharaganj ( Lucknow  ) 🔝 8923113531 🔝  Cash Payment (COD) 👒VIP Call Girls In Saharaganj ( Lucknow  ) 🔝 8923113531 🔝  Cash Payment (COD) 👒
VIP Call Girls In Saharaganj ( Lucknow ) 🔝 8923113531 🔝 Cash Payment (COD) 👒
 
Forklift Operations: Safety through Cartoons
Forklift Operations: Safety through CartoonsForklift Operations: Safety through Cartoons
Forklift Operations: Safety through Cartoons
 
KYC-Verified Accounts: Helping Companies Handle Challenging Regulatory Enviro...
KYC-Verified Accounts: Helping Companies Handle Challenging Regulatory Enviro...KYC-Verified Accounts: Helping Companies Handle Challenging Regulatory Enviro...
KYC-Verified Accounts: Helping Companies Handle Challenging Regulatory Enviro...
 
Russian Call Girls In Gurgaon ❤️8448577510 ⊹Best Escorts Service In 24/7 Delh...
Russian Call Girls In Gurgaon ❤️8448577510 ⊹Best Escorts Service In 24/7 Delh...Russian Call Girls In Gurgaon ❤️8448577510 ⊹Best Escorts Service In 24/7 Delh...
Russian Call Girls In Gurgaon ❤️8448577510 ⊹Best Escorts Service In 24/7 Delh...
 
The Path to Product Excellence: Avoiding Common Pitfalls and Enhancing Commun...
The Path to Product Excellence: Avoiding Common Pitfalls and Enhancing Commun...The Path to Product Excellence: Avoiding Common Pitfalls and Enhancing Commun...
The Path to Product Excellence: Avoiding Common Pitfalls and Enhancing Commun...
 

Assignment4 zaqui saiyed Portfolio

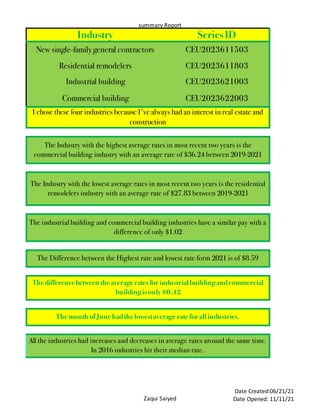
  • 1. summary Report Zaqui Saiyed Date Created:06/21/21 Date Opened: 11/11/21 Industry SeriesID New single-family general contractors CEU2023611503 Residential remodelers CEU2023611803 Industrial building CEU2023621003 Commercial building CEU2023622003 All the industries had increases and decreases in average rates around the same time. In 2016 industries hit their median rate. Themonth ofJunehadthelowestaverageratefor allindustries. I chose these four industries because I've always had an interest in real estate and construction The Industry with the highest average rates in most recent two years is the commercial building industry with an average rate of $36.24 between 2019-2021 The Industry with the lowest average rates in most recent two years is the residential remodelers industry with an average rate of $27.83 between 2019-2021 The industrial building and commercial building industries have a similar pay with a difference of only $1.02 The Difference between the Highest rate and lowest rate form 2021 is of $8.59 Thedifferencebetween theaverageratesfor industrialbuildingandcommercial buildingisonly $0.42
  • 2. Pivot Tables Zaqui Saiyed Date Created:06/21/21 Date Opened: 11/11/21 Row Labels Averageof New single-family generalcontractors Averageof Residential remodelers Averageof Industrial building Averageof Commercial building Jan $27.46 $24.53 $32.37 $32.71 Feb $27.20 $24.71 $32.47 $32.88 Mar $27.26 $24.79 $32.45 $32.89 Apr $26.85 $24.57 $31.91 $32.50 May $26.79 $24.47 $31.85 $32.38 Jun $26.66 $24.23 $31.63 $32.19 Jul $26.94 $24.28 $31.93 $32.36 Aug $26.84 $24.40 $31.91 $32.47 Sep $27.06 $24.55 $32.24 $32.72 Oct $27.26 $24.55 $32.47 $32.65 Nov $27.43 $24.67 $32.58 $32.74 Dec $27.63 $24.84 $32.61 $32.96 GrandTotal $27.12 $24.55 $32.21 $32.63 Row Labels Averageof New single-family generalcontractors Averageof Residential remodelers Averageof Industrial building Averageof Commercial building 2011 $22.21 $21.17 $28.56 $29.53 2012 $22.85 $21.29 $29.33 $29.83 2013 $24.29 $22.25 $30.13 $30.07 2014 $25.33 $22.79 $30.74 $31.27 2015 $26.26 $23.95 $31.73 $31.91 2016 $26.81 $25.35 $32.69 $32.54 2017 $28.38 $25.45 $33.09 $33.45 2018 $30.27 $26.94 $33.85 $34.51 2019 $31.25 $27.11 $34.64 $35.28 2020 $32.17 $28.13 $36.17 $36.67 2021 $32.64 $28.98 $36.78 $37.48 GrandTotal $27.12 $24.55 $32.21 $32.63
  • 3. Main Data Zaqui Saiyid Date Created:06/21/21 Date Opened: 11/11/21 Year Month Newsingle- family general contractors Residential remodelers Industrial building Commercial building 2011 Jan $23.83 $21.41 $28.46 $29.36 2011 Feb $22.83 $21.58 $28.55 $29.61 2011 Mar $22.33 $21.49 $28.75 $29.58 2011 Apr $21.92 $21.65 $28.26 $29.55 2011 May $22.17 $21.15 $28.10 $29.31 2011 Jun $21.90 $20.77 $27.86 $29.29 2011 Jul $21.25 $20.98 $28.44 $29.37 2011 Aug $21.31 $20.97 $28.80 $29.53 2011 Sep $21.56 $21.13 $28.99 $29.67 2011 Oct $22.31 $20.89 $29.01 $29.60 2011 Nov $22.45 $21.04 $28.75 $29.64 2011 Dec $22.69 $20.99 $28.80 $29.79 2012 Jan $22.71 $20.94 $28.85 $29.98 2012 Feb $22.37 $21.30 $28.83 $29.99 2012 Mar $22.38 $21.53 $29.11 $30.14 2012 Apr $22.63 $21.54 $28.84 $30.02 2012 May $22.84 $21.34 $29.17 $29.86 2012 Jun $22.60 $21.19 $29.13 $29.55 2012 Jul $22.88 $21.05 $29.40 $29.52 2012 Aug $22.82 $21.18 $29.28 $29.69 2012 Sep $22.89 $21.21 $29.90 $29.87 2012 Oct $23.17 $21.15 $29.59 $29.63 2012 Nov $23.20 $21.42 $29.78 $29.74 2012 Dec $23.75 $21.66 $30.03 $29.94 2013 Jan $23.75 $21.84 $29.71 $30.04 2013 Feb $23.78 $21.78 $29.93 $30.10 2013 Mar $23.81 $22.13 $30.36 $30.16 2013 Apr $24.14 $22.27 $30.44 $30.09 2013 May $23.99 $22.24 $29.84 $30.07 2013 Jun $23.72 $21.88 $29.71 $29.78 2013 Jul $24.53 $22.33 $29.39 $30.01 2013 Aug $24.16 $22.58 $29.62 $30.00 2013 Sep $24.53 $22.61 $30.47 $30.13 2013 Oct $24.79 $22.53 $30.75 $29.92 2013 Nov $25.13 $22.34 $30.71 $29.94 2013 Dec $25.17 $22.50 $30.67 $30.56 2014 Jan $24.63 $22.61 $31.65 $30.95 2014 Feb $25.34 $22.99 $31.02 $31.38 2014 Mar $25.02 $22.81 $30.87 $31.22 2014 Apr $25.12 $22.78 $30.58 $31.04 2014 May $25.11 $22.86 $30.53 $31.28 2014 Jun $25.41 $22.32 $30.23 $31.19 2014 Jul $25.59 $22.63 $30.39 $31.25 2014 Aug $25.09 $22.74 $30.11 $31.12 2014 Sep $25.54 $22.58 $30.41 $31.41 2014 Oct $25.58 $22.94 $30.80 $31.38
  • 4. Main Data Zaqui Saiyid Date Created:06/21/21 Date Opened: 11/11/21 Year Month Newsingle- family general contractors Residential remodelers Industrial building Commercial building 2014 Nov $25.87 $22.99 $31.17 $31.52 2014 Dec $25.67 $23.17 $31.09 $31.55 2015 Jan $26.08 $23.14 $31.50 $31.73 2015 Feb $26.06 $23.55 $31.92 $31.85 2015 Mar $26.43 $23.73 $31.36 $32.02 2015 Apr $26.04 $23.83 $31.80 $32.05 2015 May $26.01 $23.73 $31.52 $31.92 2015 Jun $25.98 $23.80 $31.44 $31.72 2015 Jul $26.26 $23.36 $31.43 $31.72 2015 Aug $26.19 $24.01 $31.47 $31.67 2015 Sep $26.26 $24.47 $31.64 $32.11 2015 Oct $26.46 $24.45 $31.80 $32.00 2015 Nov $26.65 $24.72 $32.68 $32.11 2015 Dec $26.64 $24.57 $32.17 $32.03 2016 Jan $26.80 $25.18 $32.09 $32.06 2016 Feb $26.65 $25.50 $32.17 $32.10 2016 Mar $26.60 $25.43 $32.68 $32.09 2016 Apr $26.61 $25.61 $32.89 $32.33 2016 May $26.27 $25.39 $32.92 $32.46 2016 Jun $26.36 $25.09 $32.19 $32.13 2016 Jul $26.99 $25.39 $32.45 $32.60 2016 Aug $26.90 $25.22 $32.40 $32.79 2016 Sep $26.78 $25.42 $32.76 $32.80 2016 Oct $27.09 $25.43 $33.13 $32.82 2016 Nov $27.23 $25.32 $33.16 $33.00 2016 Dec $27.45 $25.20 $33.42 $33.24 2017 Jan $28.54 $25.35 $33.49 $33.09 2017 Feb $27.60 $25.37 $33.09 $33.05 2017 Mar $28.13 $25.50 $33.12 $33.19 2017 Apr $28.45 $25.42 $32.93 $33.28 2017 May $27.83 $25.68 $32.77 $33.12 2017 Jun $27.91 $25.15 $32.34 $32.97 2017 Jul $28.44 $25.22 $32.55 $33.22 2017 Aug $28.29 $25.39 $32.73 $33.30 2017 Sep $28.69 $25.41 $33.30 $33.94 2017 Oct $28.38 $25.52 $33.68 $33.87 2017 Nov $28.86 $25.32 $33.64 $34.06 2017 Dec $29.47 $26.12 $33.46 $34.30 2018 Jan $30.30 $25.97 $34.06 $34.52 2018 Feb $30.02 $26.12 $34.00 $34.57 2018 Mar $29.88 $26.57 $33.72 $34.44 2018 Apr $30.13 $26.94 $33.71 $34.69 2018 May $30.51 $26.80 $33.33 $34.53 2018 Jun $29.70 $27.43 $33.04 $34.16 2018 Jul $29.90 $27.18 $34.04 $34.18 2018 Aug $29.93 $26.96 $33.12 $34.37
  • 5. Main Data Zaqui Saiyid Date Created:06/21/21 Date Opened: 11/11/21 Year Month Newsingle- family general contractors Residential remodelers Industrial building Commercial building 2018 Sep $30.25 $27.40 $33.65 $34.64 2018 Oct $30.57 $26.95 $34.26 $34.69 2018 Nov $30.74 $27.15 $34.20 $34.49 2018 Dec $31.28 $27.82 $35.06 $34.87 2019 Jan $30.99 $27.01 $34.77 $34.70 2019 Feb $30.93 $27.14 $34.65 $35.07 2019 Mar $30.79 $26.87 $34.43 $34.92 2019 Apr $31.09 $27.47 $34.49 $35.09 2019 May $31.39 $27.21 $34.42 $34.98 2019 Jun $31.38 $26.96 $34.51 $34.86 2019 Jul $31.52 $26.67 $34.52 $35.13 2019 Aug $30.94 $27.05 $34.49 $35.47 2019 Sep $31.26 $27.21 $34.65 $35.65 2019 Oct $31.71 $27.13 $34.95 $35.68 2019 Nov $31.41 $27.21 $34.92 $35.75 2019 Dec $31.56 $27.35 $34.90 $36.03 2020 Jan $31.55 $27.30 $34.93 $35.99 2020 Feb $31.38 $27.52 $35.54 $36.35 2020 Mar $31.71 $27.84 $36.13 $36.63 2020 Apr $32.34 $28.22 $35.19 $36.82 2020 May $31.79 $28.32 $35.92 $36.31 2020 Jun $31.68 $27.72 $35.89 $36.26 2020 Jul $32.05 $27.99 $36.70 $36.62 2020 Aug $32.73 $27.90 $37.10 $36.75 2020 Sep $32.82 $28.08 $36.64 $36.96 2020 Oct $32.53 $28.52 $36.72 $36.90 2020 Nov $32.78 $29.14 $36.81 $37.18 2020 Dec $32.63 $29.06 $36.47 $37.26 2021 Jan $32.86 $29.11 $36.51 $37.44 2021 Feb $32.28 $29.00 $37.44 $37.59 2021 Mar $32.79 $28.83 $36.40 $37.42