
Recommended
More Related Content
Similar to Visualizing data
Similar to Visualizing data (20)
More from AliDavid1998
Recently uploaded
Recently uploaded (20)
Visualizing data
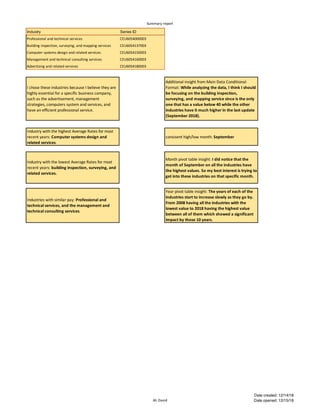
- 1. Summary report Ali David Date created: 12/14/18 Date opened: 12/15/18 Industry Series ID Professional and technical services CEU6054000003 Building inspection, surveying, and mapping services CEU6054137003 Computer systems design and related services CEU6054150003 Management and technical consulting services CEU6054160003 Advertising and related services CEU6054180003 I chose these industries because I believe they are highly essential for a specific business company, such as the advertisement, management strategies, computers system and services, and have an efficient professional service. Additional insight from Main Data Conditional Format: While analyzing the data, I think I should be focusing on the building inspection, surveying, and mapping service since is the only one that has a value below 40 while the other industries have it much higher in the last update (September 2018). Industry with the highest Average Rates for most recent years: Computer systems design and related services. consisent high/low month: September Industry with the lowest Average Rates for most recent years: building inspection, surveying, and related services. Month pivot table insight: I did notice that the month of September on all the industries have the highest values. So my best interest is trying to get into these industries on that specific month. Industries with similar pay: Professional and technical services, and the management and technical consulting services. Year pivot table insight: The years of each of the industries start to increase slowly as they go by. From 2008 having all the industries with the lowest value to 2018 having the highest value between all of them which showed a significant impact by those 10 years.
- 2. Pivot tables Ali David Date created: 12/14/18 Date opened: 12/15/18 Row Labels Average of Professional and technical services Average of Building inspection, surveying, and mapping services Average of Computer systems design and related services Average of Management and technical consulting services Average of Advertising and related services Jan 36.67 27.36 42.54 36.84 35.18 Feb 36.59 27.64 42.65 36.95 35.30 Mar 36.60 27.44 42.57 37.00 35.16 Apr 36.72 27.51 42.72 37.13 35.39 May 37.05 27.32 42.65 37.11 35.53 Jun 36.90 27.20 42.48 36.94 35.25 Jul 37.08 27.42 42.75 36.96 35.47 Aug 37.03 27.51 42.68 36.96 35.48 Sep 37.27 27.68 42.86 37.23 35.78 Oct 36.92 27.38 42.53 36.82 35.42 Nov 37.04 27.50 42.69 36.98 35.59 Dec 37.09 27.58 42.66 36.96 35.68 Grand Total 36.91 27.46 42.65 36.99 35.43 Row Labels Average of Professional and technical services Average of Building inspection, surveying, and mapping services Average of Computer systems design and related services Average of Management and technical consulting services Average of Advertising and related services 2008 33.21 24.70 40.23 32.71 29.78 2009 34.09 26.20 40.39 33.41 30.50 2010 34.64 26.04 40.17 34.58 31.89 2011 35.21 25.64 40.62 35.85 33.83 2012 35.95 26.59 41.18 36.39 34.94 2013 36.57 26.41 41.91 37.07 35.88 2014 37.54 26.64 42.71 38.13 37.08 2015 38.67 27.64 44.07 38.65 38.21 2016 39.50 30.75 45.21 39.33 39.19 2017 40.45 30.77 46.26 40.96 39.36 2018 41.29 31.76 47.62 40.80 40.32 Grand Total 36.91 27.46 42.65 36.99 35.43
- 3. Main data Ali David Date created: 12/14/18 Date opened: 12/15/18 Year Month Professional and technical services Building inspection, surveying, and mapping services Computer systems design and related services Management and technical consulting services Advertising and related services 2008 Jan $32.46 $24.21 $39.89 $32.22 $29.44 2008 Feb $32.41 $24.56 $39.65 $32.12 $29.42 2008 Mar $32.84 $24.26 $40.26 $32.50 $29.77 2008 Apr $32.60 $24.37 $39.96 $32.43 $29.27 2008 May $33.00 $24.30 $39.88 $32.26 $29.45 2008 Jun $33.39 $24.19 $40.59 $32.83 $29.80 2008 Jul $33.15 $24.58 $40.19 $32.38 $29.82 2008 Aug $33.26 $25.03 $40.14 $32.78 $29.84 2008 Sep $33.54 $24.91 $40.17 $33.47 $29.91 2008 Oct $33.61 $25.17 $40.27 $32.84 $30.32 2008 Nov $34.25 $25.29 $41.17 $33.28 $30.30 2008 Dec $34.06 $25.57 $40.56 $33.36 $30.05 2009 Jan $33.78 $26.16 $40.50 $33.66 $30.23 2009 Feb $34.06 $26.45 $40.96 $33.80 $31.17 2009 Mar $34.06 $25.86 $40.77 $33.43 $30.65 2009 Apr $33.71 $25.87 $40.17 $33.46 $30.07 2009 May $33.97 $25.83 $39.96 $33.58 $29.96 2009 Jun $33.84 $25.59 $39.79 $33.21 $29.93 2009 Jul $34.01 $26.19 $40.05 $33.05 $30.48 2009 Aug $34.32 $26.35 $40.49 $33.44 $30.70 2009 Sep $34.11 $26.23 $40.26 $33.35 $30.33 2009 Oct $34.21 $26.25 $40.41 $33.23 $30.52 2009 Nov $34.69 $27.04 $40.89 $33.70 $31.24 2009 Dec $34.31 $26.54 $40.41 $33.05 $30.72 2010 Jan $34.16 $26.07 $40.48 $33.91 $30.36 2010 Feb $34.18 $26.51 $40.25 $34.36 $30.66 2010 Mar $34.02 $26.56 $39.92 $33.93 $30.44 2010 Apr $34.23 $26.22 $39.99 $34.47 $31.21 2010 May $35.16 $25.76 $40.37 $34.92 $32.59 2010 Jun $34.58 $25.97 $39.86 $34.56 $31.35 2010 Jul $34.66 $25.70 $40.02 $34.33 $32.13 2010 Aug $35.00 $25.48 $40.40 $34.71 $32.63 2010 Sep $34.76 $26.04 $40.04 $34.48 $32.26 2010 Oct $34.97 $26.22 $40.15 $35.02 $32.77 2010 Nov $34.91 $25.95 $40.22 $35.11 $32.96 2010 Dec $35.02 $26.02 $40.29 $35.12 $33.31 2011 Jan $35.34 $25.20 $40.94 $35.76 $33.67 2011 Feb $34.82 $25.55 $40.60 $35.60 $32.97 2011 Mar $34.61 $25.36 $40.30 $35.44 $32.78 2011 Apr $34.79 $25.54 $40.40 $35.75 $33.15 2011 May $35.44 $25.44 $40.80 $36.17 $34.18 2011 Jun $34.92 $25.24 $40.10 $35.63 $32.90 2011 Jul $35.23 $26.03 $40.62 $35.92 $33.41 2011 Aug $35.08 $25.88 $40.28 $35.70 $33.76 2011 Sep $35.36 $25.54 $40.64 $35.91 $34.60 2011 Oct $35.91 $25.78 $41.24 $36.26 $35.07 2011 Nov $35.45 $25.98 $40.78 $35.84 $34.26 2011 Dec $35.62 $26.09 $40.76 $36.20 $35.24 2012 Jan $35.98 $26.47 $41.39 $36.80 $35.64 2012 Feb $35.46 $26.51 $41.09 $36.65 $34.78 2012 Mar $35.37 $26.64 $40.77 $36.36 $34.47 2012 Apr $35.88 $26.65 $41.46 $36.52 $35.45 2012 May $35.78 $26.52 $40.97 $35.83 $34.99 2012 Jun $35.71 $26.47 $40.73 $36.01 $34.00 2012 Jul $36.24 $26.46 $41.37 $36.33 $35.16 2012 Aug $35.71 $26.50 $40.79 $35.72 $34.55 2012 Sep $36.46 $26.66 $41.48 $36.87 $35.28 2012 Oct $36.00 $26.83 $41.00 $36.37 $34.42 2012 Nov $36.08 $26.52 $41.23 $36.37 $34.84 2012 Dec $36.67 $26.88 $41.92 $36.89 $35.72 2013 Jan $36.25 $26.72 $41.49 $36.86 $35.20 2013 Feb $36.22 $26.71 $41.79 $36.98 $35.70 2013 Mar $36.14 $26.32 $41.65 $36.74 $35.65 2013 Apr $36.29 $26.12 $42.00 $36.82 $35.75 2013 May $36.50 $25.93 $41.87 $36.79 $35.75 2013 Jun $36.84 $25.96 $42.14 $37.32 $36.47 2013 Jul $36.46 $26.54 $41.81 $36.84 $35.62 2013 Aug $36.43 $26.67 $41.70 $37.06 $35.73 2013 Sep $37.03 $26.48 $42.24 $37.63 $36.66 2013 Oct $36.61 $26.39 $41.85 $37.03 $35.61 2013 Nov $36.73 $26.37 $41.90 $37.17 $35.85 2013 Dec $37.28 $26.76 $42.46 $37.61 $36.53 2014 Jan $36.86 $26.78 $42.02 $37.45 $36.07 2014 Feb $37.21 $27.15 $42.77 $38.22 $36.86
- 4. Main data Ali David Date created: 12/14/18 Date opened: 12/15/18 Year Month Professional and technical services Building inspection, surveying, and mapping services Computer systems design and related services Management and technical consulting services Advertising and related services 2014 Mar $37.31 $27.08 $42.74 $38.36 $37.27 2014 Apr $37.02 $26.92 $42.60 $37.94 $36.91 2014 May $37.47 $26.20 $42.51 $38.23 $36.60 2014 Jun $37.80 $26.57 $43.00 $38.15 $37.71 2014 Jul $37.51 $26.48 $42.66 $37.96 $36.76 2014 Aug $37.49 $26.26 $42.46 $37.94 $36.77 2014 Sep $37.70 $26.46 $42.56 $38.31 $36.94 2014 Oct $37.72 $26.54 $42.70 $38.11 $37.16 2014 Nov $38.40 $26.55 $43.53 $38.74 $38.40 2014 Dec $38.02 $26.68 $43.02 $38.11 $37.49 2015 Jan $38.18 $27.20 $43.23 $38.54 $37.74 2015 Feb $38.53 $27.35 $44.00 $39.17 $38.46 2015 Mar $38.56 $27.21 $43.96 $39.31 $38.51 2015 Apr $38.28 $27.33 $43.57 $38.82 $37.94 2015 May $38.60 $27.13 $43.67 $38.82 $38.04 2015 Jun $38.35 $26.86 $43.48 $38.49 $37.81 2015 Jul $38.52 $26.94 $43.89 $38.45 $37.55 2015 Aug $38.95 $27.41 $44.61 $38.52 $38.31 2015 Sep $38.66 $27.86 $44.13 $37.92 $37.86 2015 Oct $38.89 $28.34 $44.51 $38.13 $38.28 2015 Nov $39.47 $28.95 $45.21 $39.03 $39.40 2015 Dec $39.03 $29.12 $44.62 $38.61 $38.60 2016 Jan $39.15 $30.46 $45.04 $39.06 $38.79 2016 Feb $38.97 $30.84 $44.96 $39.11 $38.83 2016 Mar $38.89 $30.52 $44.72 $38.89 $38.45 2016 Apr $39.14 $30.96 $45.10 $39.13 $38.83 2016 May $39.97 $31.24 $45.71 $39.68 $39.98 2016 Jun $39.30 $30.65 $44.91 $38.84 $38.85 2016 Jul $39.52 $30.14 $45.16 $39.14 $38.86 2016 Aug $39.35 $30.52 $44.89 $39.13 $39.03 2016 Sep $39.67 $30.72 $45.17 $39.33 $39.69 2016 Oct $40.23 $31.02 $45.99 $39.91 $40.28 2016 Nov $39.78 $30.86 $45.37 $39.71 $39.38 2016 Dec $39.99 $31.07 $45.50 $39.97 $39.33 2017 Jan $40.33 $30.60 $46.08 $40.48 $39.91 2017 Feb $39.85 $31.08 $45.77 $39.96 $39.44 2017 Mar $39.99 $30.55 $45.92 $41.39 $38.98 2017 Apr $40.52 $31.03 $46.45 $41.90 $39.94 2017 May $40.35 $30.31 $45.83 $41.07 $39.16 2017 Jun $40.07 $29.87 $45.38 $40.76 $38.69 2017 Jul $40.74 $30.53 $46.39 $41.30 $39.44 2017 Aug $40.26 $30.37 $46.01 $40.64 $38.85 2017 Sep $40.66 $31.11 $46.52 $41.18 $39.06 2017 Oct $41.05 $31.28 $47.14 $41.30 $39.81 2017 Nov $40.65 $31.45 $46.61 $40.81 $39.23 2017 Dec $40.87 $31.10 $47.01 $40.69 $39.77 2018 Jan $40.83 $31.07 $46.92 $40.54 $39.90 2018 Feb $40.75 $31.38 $47.36 $40.50 $40.04 2018 Mar $40.82 $31.49 $47.21 $40.67 $39.81 2018 Apr $41.45 $31.59 $48.19 $41.16 $40.79 2018 May $41.32 $31.83 $47.57 $40.87 $40.08 2018 Jun $41.15 $31.84 $47.30 $40.55 $40.20 2018 Jul $41.83 $32.03 $48.11 $40.90 $40.98 2018 Aug $41.43 $32.14 $47.70 $40.93 $40.16 2018 Sep $42.01 $32.48 $48.24 $41.08 $40.95