1. Course 3, Lesson 4-4
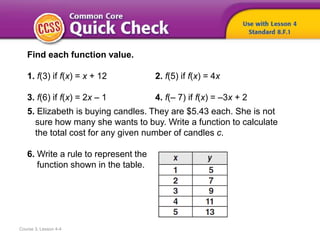
Find each function value.
1. f(3) if f(x) = x + 12 2. f(5) if f(x) = 4x
3. f(6) if f(x) = 2x – 1 4. f(– 7) if f(x) = –3x + 2
5. Elizabeth is buying candles. They are $5.43 each. She is not
sure how many she wants to buy. Write a function to calculate
the total cost for any given number of candles c.
6. Write a rule to represent the
function shown in the table.
6. To represent a function by
• writing an equation,
• completing a table,
• graphing the function on
the coordinate plane
Course 3, Lesson 4-4
Functions
7. • linear function
• continuous data
• discrete data
Course 3, Lesson 4-4
Functions
8. 1
Need Another Example?
2
3
Step-by-Step Example
1. The school store sells book covers for $2 each and notebooks
for $1. Toni has $5 to spend. The function y = 5 – 2x represents
the number of book covers x and notebooks y she can buy.
Graph the function. Interpret the points graphed.
Choose values for x and substitute
them in the function to find y.
Graph the ordered pairs (x, y).
She cannot buy negative amounts. So
she can buy 0 covers and 5 notebooks,
1 cover and 3 notebooks, or 2 covers
and 1 notebook.
9. Answer
Need Another Example?
During a clearance sale, a store is selling DVDs for $3
and CDs for $1. Graph the equation y = 6 – 3x to find
all possible values of DVDs x and CDs y Bill can buy
with $6.
0 DVDs and 6 CDs;
1 DVD and 3 CDs;
2 DVDs and 0 CDs
10. 1
Need Another Example?
2
3
4
Step-by-Step Example
2. Graph y = x + 2.
Make a function table. Select any four
values for the domain x. Substitute these
values for x to find the value of y, and
write the corresponding ordered pairs.
Graph each ordered pair. Draw a
line that passes through each point.
The line is the complete graph
of the function. The ordered
pair corresponding to any point
on the line is a solution of the
equation y = x + 2.
Check It appears that (–2, 0) is also a
solution. Check this by substitution.
y = x + 2
0 = –2 + 2
0 = 0
Write the function.
Replace x with –2 and y with 0.
Simplify.
?
12. Course 3, Lesson 4-4
Functions
Words The value of y is one less than the corresponding value of x.
Equation y = x – 1
Ordered Pairs (0, –1), (1, 0), (2, 1), (3, 2)
Table Graph
13. 1
Need Another Example?
Step-by-Step Example
3. Each person that enters a store receives a coupon for $5 off
his or her entire purchase.
Let y represent the total value of the coupons and x
represent the number of people. The function is y = 5x.
Write a function to represent the total value of the coupons
given out.
14. Answer
Need Another Example?
Each member of a health club receives
two free guest passes. Write a function
to represent the situation.
y = 2x
15. 1
Need Another Example?
Step-by-Step Example
4. Each person that enters a store receives a coupon for
$5 off his or her entire purchase. Make a function table
to find the total value of the coupons given out to 5, 10,
15, and 20 customers.
16. Answer
Need Another Example?
Each member of a health club receives two free
guest passes. Make a function table to show the
number of guest passes given out to 10, 20, 30,
and 40 members.
17. 1
Need Another Example?
2
Step-by-Step Example
5. Each person that enters a store receives a coupon for $5 off
his or her entire purchase. Graph the function. Is the function
continuous or discrete? Explain.
Use the ordered pairs from the function table to
graph the function.
There can only be a whole number amount of
customers. The function is discrete. So, the
points are not connected.
18. Answer
Need Another Example?
Each member of a health club receives two free guest
passes. Graph the function. Is the function continuous
or discrete? Explain.
The function is discrete. The number
of healthclub members can only be
represented by whole numbers.
19. How did what you learned
today help you answer the
HOW can we model relationships
between quantities?
Course 3, Lesson 4-4
Functions
20. How did what you learned
today help you answer the
HOW can we model relationships
between quantities?
Course 3, Lesson 4-4
Functions
Sample answers:
• You can represent an equation for a function like y = 5x
using function notation, f(x) = 5x.
• To graph a function, create a function table to find input
and output values, then graph the ordered pairs on the
coordinate plane.
• A function where the graph is a straight line is a linear
function.
21. Write how what you learned in
the previous lesson about
functions help you understand
today’s topic of representing
functions with tables, graphs,
and equations.
Ratios and Proportional RelationshipsFunctions
Course 3, Lesson 4-4