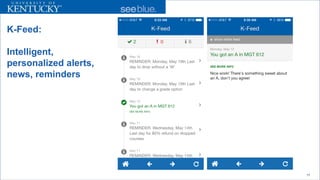
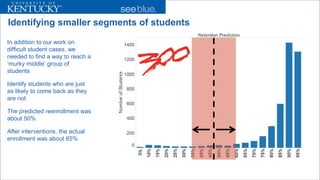
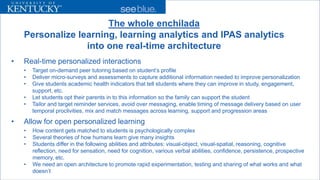
Download as PDF, PPTX
![We are competitive animals
Information becomes a [tool, weapon]
We instinctually manage information to enhance our competitiveness
Competition relies on information hiding
IT tools become part of our body
How we personally utilize information is part of our biological heritage. This is hardto change, if at all
4](https://image.slidesharecdn.com/vkellenorganizinganalytics-141005132713-conversion-gate02/85/Organizing-to-Get-Analytics-Right-4-320.jpg)
![Top-down versus bottom-up
Doing this top down is like pushing water uphill. Its harder than pushing a rock uphill
The great leader is one who the people say “We did this ourselves”
Consider analytics to be a process of self discovery. Each person has to go through the stages of maturity
Paradoxically, this also requires strong top-down commitment and action! Organizational maneuvers like reorganizations are [normally] required
21](https://image.slidesharecdn.com/vkellenorganizinganalytics-141005132713-conversion-gate02/85/Organizing-to-Get-Analytics-Right-21-320.jpg)


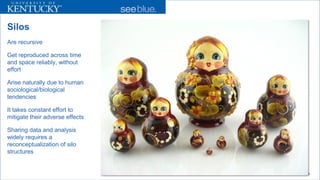
The document discusses the challenges of data analytics in organizations, emphasizing the need to overcome silo structures and cultivate a culture of data sharing and collaboration. It outlines strategies for improving analytics maturity, such as merging departments, enhancing transparency, and fostering a community of practice. The proposed infrastructure aims to personalize learning experiences and support student success through advanced analytics and real-time interactions.


![[Extended] Bottom-up growth of learning analytics at two Australian universit...](https://cdn.slidesharecdn.com/ss_thumbnails/bottom-upgrowthofla-160416081432-thumbnail.jpg?width=640&height=640&fit=bounds)


