Testing Value Proposition
•
0 likes•308 views

Venture Lab 2012, Testing value proposition, Stanford University

Recommended
Recommended
More Related Content
Viewers also liked
Viewers also liked (11)
Similar to Testing Value Proposition
Similar to Testing Value Proposition (20)
Recently uploaded
Recently uploaded (20)
Testing Value Proposition
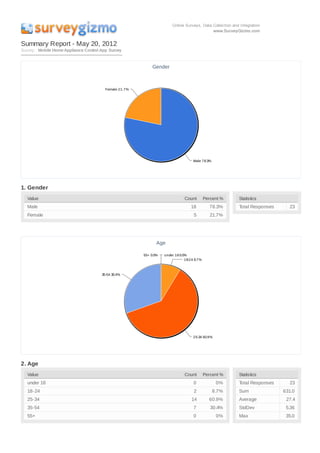
- 1. Summary Report - May 20, 2012 Survey: Mobile Home Appliance Control App Survey Gender Female 21.7% Male 78.3% 1. Gender Value Count Percent % Statistics Male 18 78.3% Total Responses 23 Female 5 21.7% Age 55+ 0.0% under 18 0.0% 18-24 8.7% 35-54 30.4% 25-34 60.9% 2. Age Value Count Percent % Statistics under 18 0 0% Total Responses 23 18-24 2 8.7% Sum 631.0 25-34 14 60.9% Average 27.4 35-54 7 30.4% StdDev 5.36 55+ 0 0% Max 35.0
- 2. Status Single 34.8% Married 65.2% 3. Status Value Count Percent % Statistics Married 15 65.2% Total Responses 23 Single 8 34.8% On average, how many devices do you have in your home? > 11 21.7% 5 - 7 47.8% 9 - 11 13.0% 7 - 9 17.4% 4. On average, how many devices do you have in your home? Value Count Percent % Statistics 5- 7 11 47.8% Total Responses 23 7-9 4 17.4% Sum 110.0 9 - 11 3 13% Average 6.1 > 11 5 21.7% StdDev 1.52 Max 9.0
- 3. On average, how many hours do you spend at home per day? > 16 0.0% 12 - 16 21.7% 6 - 10 47.8% 10 - 12 30.4% 5. On average, how many hours do you spend at home per day? Value Count Percent % Statistics 6 - 10 11 47.8% Total Responses 23 10 - 12 7 30.4% Sum 196.0 12 - 16 5 21.7% Average 8.5 > 16 0 0% StdDev 2.52 Max 12.0 How many devices do you have running when you are home? > 11 0.0% 9 - 11 4.5% 7 - 9 9.1% 5 - 7 27.3% 0 - 5 59.1% 6. How many devices do you have running when you are home? Value Count Percent % Statistics 0-5 13 59.1% Total Responses 22 5- 7 6 27.3% Sum 53.0 7-9 2 9.1% Average 5.9 9 - 11 1 4.5% StdDev 1.37 > 11 0 0% Max 9.0
- 4. How often have you forgotten to turn off an appliance or device? Always 0.0% Often 17.4% Never 17.4% Sometimes 21.7% Rarely 43.5% 7. How often have you forgotten to turn off an appliance or device? Value Count Percent % Statistics Never 4 17.4% Total Responses 23 Rarely 10 43.5% Sometimes 5 21.7% Often 4 17.4% Always 0 0% 8. What do you do when you realize that you left an appliance or device running? Count Response 1 Call home and ask someone to check if it is still on 1 Call home to see if someone can turn it off 1 Go and switch it off 1 Go back if possible...else sop worrying about it! 1 I keep it on, on purpose not mistake. 1 I'm sorry and I regret it 1 Never 1 Normally immediately 1 Switch off the power plug 1 Turn if off if I am close to that device 1 call husband to turn off 1 call neighbors 1 get up switch it off 2 nothing 1 rush to turn off 1 shutting down 1 switch it off 2 turn it off 9. How do you monitor the amount of electricity that you use in a give day/week/month? Count Response
- 5. 1 Do not monitor 1 Don't have devices, only way is to check electric bill 1 Electricity Bill Only! 1 I don't 1 I look at electricity bill 1 N/A 1 NA 1 Never 1 No 1 Use only when necessity 1 Who has the time ! :-) 1 do not monitor this 1 i check the bills and compare with the other months 1 in electricity bill 1 monthly bill 1 monthly bills 1 no monitoring 1 no way 1 not check 1 through the monthly bill How often have you not had enough of or run out of milk, juice or other items in your refrigerator? Always 0.0% Never 8.7% Often 17.4% Rarely 39.1% Sometimes 34.8% 10. How often have you not had enough of or run out of milk, juice or other items in your refrigerator? Value Count Percent % Statistics Never 2 8.7% Total Responses 23 Rarely 9 39.1% Sometimes 8 34.8% Often 4 17.4% Always 0 0%
- 6. What do you generally do when this happens? Go to the store immediately 9.1% Wait until the next time you go grocery shopping 27.3% Wait until the next day 63.6% 11. What do you generally do when this happens? Value Count Percent % Statistics Go to the store immediately 2 9.1% Total Responses 22 Wait until the next day 14 63.6% Wait until the next time you go grocery shopping 6 27.3% 12. How do you feel about a system that keeps track of the levels of your refrigerator items for you? Count Response 1 Cost ? :-) 1 Feel good, but do not believe outcome will justify the investments 1 Good idea 1 Good. Although Sun Microsystem's Jini in 2001 failed 1 I'm feel good 1 Might be good 1 Okay 1 T much technology oo 1 Wow, could be useful 1 absolutelly negative 1 doesn't seem possible 1 good 1 good to have but not must have 1 great 1 it will be good to have but not a mandate. 1 may be helpful 1 no, makes my life more robotic 1 not useful for me 1 It would be nice, but do not want any additional maintenance/inputs to that device. Also it should not cost any additional cost, if inbuilt in fridge would be nice. 13. What are your thoughts on a system that orders the products for you and has them delivered to your home before you run out?
- 7. Count Response 1 Cool 1 Cost ? :-) 1 I like to have all orders under own control 1 I want the control on it 1 Intrusive. Should allow me to order through the system 1 It's really interesting, it could save my time 1 T much of a giving away the control oo 1 brilliant 1 extremelly negative for my life style 1 good idea 1 good idea if it delivers what I need 1 great to have but to be strongly validated to avoid any unexpected expense 1 i'm not interested on it 1 not a good idea. What if I don't need it again? 1 sounds cool 1 sounds good 1 wonderful concept - how expensive? 1 I don't think it be a big deal if I run out of anything. Definitely, I don't need this kind of system 1 Would be a nice one, but then how to collect them at home within office hours or there will be service also after office hours. Also should be able to track my orders (month wise, etc...) 1 At this point, I'm single and don't keep much in the fridge, so I'm ok with going to the store myself Does your house require 24 hour surveillance? Yes 0.0% No 100.0% 14. Does your house require 24 hour surveillance? Value Count Percent % Statistics Yes 0 0% Total Responses 23 No 23 100%
- 8. Would you like to see what is happening in and around your house? i.e. What is your family doing or what is your pet doing etc... Yes 8.3% No 33.3% Maybe 58.3% 15. Would you like to see what is happening in and around your house? i.e. What is your family doing or what is your pet doing etc... Value Count Percent % Statistics Yes 1 8.3% Total Responses 12 No 4 33.3% Maybe 7 58.3% How would you like to monitor the activity in or around your house remotely? Mobile app 36.4% Both 45.5% Web application 18.2% 16. How would you like to monitor the activity in or around your house remotely? Value Count Percent % Statistics Mobile app 8 36.4% Total Responses 22 Web application 4 18.2% Both 10 45.5%
- 9. How often are you in a rush and need to turn on/off appliances and devices quickly (i.e rushing home from work and you need to cook, running late for work in the morning)? Always 13.0% Often 0.0% Never 26.1% Sometimes 8.7% Rarely 52.2% 17. How often are you in a rush and need to turn on/off appliances and devices quickly (i.e rushing home from work and you need to cook, running late for work in the morning)? Value Count Percent % Statistics Never 6 26.1% Total Responses 23 Rarely 12 52.2% Sometimes 2 8.7% Often 0 0% Always 3 13% How likely are you use an integrated system of the devices in your home to control them remotely? Always 4.5% Never 27.3% Often 22.7% Sometimes 18.2% Rarely 27.3% 18. How likely are you use an integrated system of the devices in your home to control them remotely? Value Count Percent % Statistics Never 6 27.3% Total Responses 22 Rarely 6 27.3% Sometimes 4 18.2% Often 5 22.7% Always 1 4.5%
- 10. What services would you most need to use in your everyday life? 100 75 63.6% 54.5% 50 45.5% 45.5% 40.9% 36.4% 25 18.2% 0 Intelligent Grocery order and Electricity usage Water usage Remote property Remote property Other refrigerator that delivery monitoring monitoring lock/unlock surveillance monitors the levels of the contents it contains 19. What services would you most need to use in your everyday life? Value Count Percent % Statistics Intelligent refrigerator that monitors the levels of the contents it contains 9 40.9% Total Responses 22 Grocery order and delivery 8 36.4% Electricity usage monitoring 14 63.6% Water usage monitoring 10 45.5% Remote property lock/unlock 12 54.5% Remote property surveillance 10 45.5% Other 4 18.2%