Beyond Boundaries: Leveraging No-Code Solutions for Industry Innovation
Soil Nutrients Lab (Natural Science)
1. Ty Kraichok
IB Environmental System and Society (Period 1)
October 5, 2011
The Relationship Between Plants Productivity and The Nutrients (Nitrogen,
Potassium, Phosphorus) in the Soil
Introduction
Plants productivity or Primary Productivity is the level of biomass in an
ecosystem per unit time. The biomass is the mass of carbon that has been generated
in plants. The process of primary productivity is base on the synthesis of new organic
materials through the use of light from photosynthesis to inorganic molecules, such
as, H2O and CO2 . There are several environmental factors that can affect primary
productivity, for example, temperature, geographic location and soil. Soil is one of
the most significant factors that affect primary productivity due to the nutrients
within the soil that produces chemical that plants need to live and grow. The
nutrients help build and repair tissue, regulate body processes and are converted to
use as energy, which all of these main processes help plants to grow effectively.
In this lab, it focuses on 3 main types of nutrients in the soil, which are
Nitrogen (N), Phosphorus (P) and Potassium (K), and also the level of pH. These
nutrients and pH will help determines the level of primary productivity.
Nitrogen (N) is located in the upper soil layer. It is a natural element that
supports plant’s growth. Nitrogen mostly found in the upper soil layer and the
atmosphere. It takes raw materials for amino acid synthesis to in order to synthesis
proteins. Nitrogen mainly affects plant’s leaves and new shoots’ growth. Leaves will
turn into pale yellow color with the lack of nitrogen.
Phosphorus (P) is also another important mineral that mainly affect the
strength of plant’s stem, fruiting, rooting and also seed making. The lack of
phosphorus in the soil may result with no flower. Plants basically respond to the lack
of phosphorus by turning yellow.
Potassium (K) is in the upper soil layer. It is a chemical element that is
necessary for strong root system and for forming starch, protein and sugar in order
to increase plant’s productivity. The lack of Potassium will result in undersized fruits,
leaves showing marginal and interval yellowing. Leaves also turn brown and roll
upwards and at the same time, blossoms will become small and distorted when
plants do not have enough Potassium.
The level of pH (1-14) is also a significant in this lab because it helps identify
the kind of plants that can grow in each specific type of soil. In this lab, the levels of
pH in the soil from the two locations that are selected to investigate do not have
relatively different level of pH since the plants that grow in these two places is the
2. same kind. Textural triangle is also another tool that helps identify the texture of the
soil. Based on this lab, the soil has 15% clay, 65% sand and 20% silt. According to this
information, it can be conclude that the soil has a clay texture.
The two locations that are select to be investigated in this lab are in
International School Bangkok (ISB). The soil characteristics of these two locations
are different due Soil 1 is located on a flat surface, while Soil 2 is located on a slope
surface. These two soils are characterized base on their horizon number, top depth,
bottom depth, moisture status, structure, main color, second color, consistence,
texture, rocks, roots and carbonates. These are the results from soil characteristics
experiment:
Characteristics Soil 1 Soil 2
Horizon Number 1 2
Top Depth (cm) 0.00 8.50
Bottom Depth (cm) 8.50 14.0
Moisture Status (wet, dry, moist) Wet Dry
Structure (granular, blocky, platy,
prismatic, columnar, single, Granular Granular
grained, massive)
Main Color (code from color 10 YR (4/3) 10 YR (5/3)
book)
Second Color (code from color 2.5 YR (4/8) 2.5 YR (5/8)
book)
Consistence (loose, friable, firm, Friable Firm
extremely firm)
Texture (sand, loamy sand, sandy
loam, sandy clay loam, sandy
clay, silt, silt loam, silty clay loam, Clay Clay
silty clay loam, clay loam, clay)
Rocks (none, few, many) Few Many
Roots (none, few, many) Few Few
Carbonates (none, slight, strong) None Slight
Primary productivity in this lab is measures by the cutting the grasses in the
two selected locations and heat the grasses in the over in order to get the biomass
of the grasses. This lab uses quadrant to get the sampling grasses in order to
estimate the total biomass of the whole area. Primary productivity can be found by
using this equation:
Primary Productivity: Dry Weight (gram)/Area (m2) x Day (d)
The level of hydrogen can be measure by using the nitrate developer solution
and nitrate developer powder and it will result in color solution, which can be
compare with the code from color book and be able to identify the level of nitrogen
in the soil. Phosphorus can be measure by using phosphorus developer and
phosphorus solution in order to determine the level of phosphorus in the soil.
3. Potassium level can be also measure by potassium developer and potassium solution
(Takeda, et al 1991).
Planning
There are two independent variables in this lab, which are the location and
the level of nutrients (N, P, K). The dependent variable in this lab is the level of
primary productivity. The controlled variable in this lab are the time that grasses are
heated, the heating temperature, the room temperature, the time that soil dissolve
completely, the amount of solution developer and solution powder in each trial, the
waiting of the reaction between the developer and soil solution and distance
between the soil surface and where in the grass’s shooter that the experimenter cut.
Controlled Variables How is it measured? How will it be controlled?
Time that grasses are Use watch to detect the 30 minute in every trail
heated same and make sure the
time is equal in every trail
The heating temperature Use the same level of 70 oC
(during biomass temperature (o C) in every
measurement process) trail
Room temperature Make sure that the room 25 oC
(during laboratory temperature is stable
experiment) through out the
experiment
Time that the soil dissolve Make sure that the time Depend on the soil texture
in each solution that soil dissolve in the
completely solution is the same
(including the times that
the experimenter
shaking/stir the solution)
The amount of solution Use the dropper to make Use the dropper in every
developer and solution sure that the size of the trail
powder in each trial dropping solution is the
same
The waiting time of the Use stop watch to make 2 minutes
reaction between the sure that the time that the
developer and soil experimenter wait for the
solution reaction between the
developer and soil
solution is the same
through out every trail
The distance between the Use ruler to measure the 1 cm above the soil
soil surface and where in distance between the soil surface
the grass’s shoot that the surface and where in the
experimenter cut grass’s shoot that the
experimenter will cut
4. Materials
Soil (sample 1 and sample 2) Balance (1)
Distilled Water (2 liters) Soil Extracting Solution (1 bottle)
250 ml beakers (4) Ammonium Developer Powder (1 bottle)
Empty plastic bottle (2) Ammonium Developer Solution (1 bottle)
Hydrometer (1) Nitrate Developer Solution (1 bottle)
Thermometer (1) Nitrate Developer Powder (1 bottle)
Plastic Wrap (1 pack) Phosphorus Developer Solution (1 bottle)
100 ml Graduated Cylinder (1) Phosphorus Developer Powder (1 bottle)
Soil dispersing reagent (1) Potassium Developer Solution (1 bottle)
Clear 500ml Cylinder (1) Potassium Developer Solution (Red Pieces) (1 bottle)
Meter stick (1) Pottasium Developer Solution (Clear) (1 bottle)
Scissor (1) pH Indicator (3.0-8.5) (1 bottle)
Oven 50 gram of Hexametaphosphate
Meter Stick (1) Stirring Spoon (1)
Test Tube (3) Nitrogen Standard Color Chart (1)
Phosphorus Standard Color Chart Potassium Standard Color Chart (1)
(1)
Procedure
Cutting the Soil and Measure Biomass
1. Select two locations that will get measure the soil nutrients (in this case: flat
surface and slope surface)
2. Use scissor to cut off the grasses within the quadrant area
3. Collect the grasses from two locations in separate 250 ml beakers
4. Heat 2 sampling grasses in an oven for 30 minutes
5. Measure the weight of the dry grasses from the two location with the
Balance
Soil Particle Size Distribution Procedure
1. Prepare the dispersing solution by mixing 50 g of Sodium
Hexametephosphate in 1 liter of distill water.
2. Stir and shake the solution until dispersing agent has completely dissolved
3. Weight 25 gram of dried, sieved soil by using balance
4. Pour 25 gram soil into 250ml beaker
5. Add 100 ml of dispersing solution and 50ml of distilled water to the beaker
and stir with a spoon (make sure that the mixtures do not stick to the bottom
of the beaker).
6. Measure the distance between the base and 500ml mark of the 500ml
cylinder by using meter stick
7. Wait for 24 hours or 1 day
5. 8. Pour the solution into a 500ml cylinder and use the squirt bottle to rinse all
soil out of the container and into he cylinder
9. Add enough distilled water to make the solution reach 500ml mark on the
cylinder
10. Use plastic cover to cover the top part of the cylinder
11. Shake the cylinder for at least 10 times (make sure that the solution does not
leak out of the cylinder while shaking)
12. Record the time that the cylinder set don to the second: after 1 minutes and
30 seconds has passed, carefully lower the hydrometer into the cylinder and
let it float in the soil suspension.
13. At exactly 2 minutes after the cylinder was set down, read the line on the
hydrometer that is closet to the surface of the soil suspension and record the
number
14. Suspend the thermometer in the suspension for a minute
15. At the end of the minute, see the result on the thermometer
Nutrients Test Procedure
Identifications of the solutions that are needed for Nitrogen,
Phosphorus and Potassium test
Soil
Solution 1: Soil Extracting Solution Ext
Solution 2: Ammonium Developer Powder rac
Solution 3: ammonium Developer Solution tio
Solution 4: Nitrate Developer Solution n
Solution 5: Nitrate Developer Powder 1. G
Solution 6: Phosphate Developer Solution rin
Solution 7: Phosphate Developer Powder din
Solution 8: Potassium Developer Solution g
Solution 9: Potassium Developer Solution (Red Pieces) soil
Solution 9A: Pottasium Developer Solution (Clear)
unt
il
powdery
2. Take 1 spoon of powdery soil to plastic bottle
3. Add 20ml of Solution 1
4. Shaking the bottle for 5 minutes
5. Filter the mixture to separate debris and clear soil extracted solution
Nitrogen Test
1. Take 2.2 ml of soil extracted solution to test tube
2. Add 0.5 ml of Solution 4
3. Add 5 small spoon of Powder 5
4. Shaking the test tube and incubate at room temperature for 5 minutes
5. Compare the color of the solution (result) with the Nitrogen Standard Color
Chart (figure 3)
Phosphorus Test
1. Take 2.5 ml of soil extraction solution to test tube
6. 2. Add 0.5 ml of Solution 6 into the test tube
3. Add 5 small spoon of Powder 7
4. Shaking the test tube and incubate at room temperature for 5 minutes
5. Compare the result solution color with the color scale on the Phosphorus
Standard Color Chart (figure 1)
Potassium Test
1. Add 3 ml of distilled water to bottle which contains Powder 9
2. Shake the bottle for 5 minutes or until the powder is completely mixed with
the distill water
3. Take 0.8 ml of soil extracted solution to test tube
4. Add 2.0 ml of Solution 8
5. Ass 1 drop of Solution A9
6. Add 2 drop of Solution 9
7. Shake and read the result after 1 minute
8. Compare the color result of the solution with the Potassium Standard Color
Chart (figure 2)
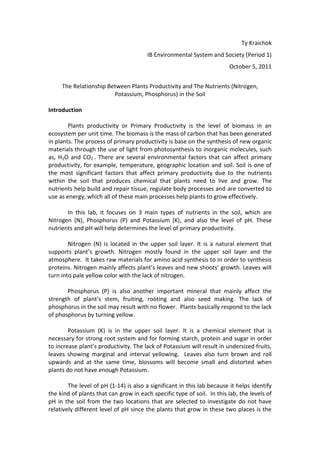
Figure 2: The standard color chart of Potassium that
represents in different tone of orange color. H: high,
M: medium and L: low (level of Potassium)
Figure 1: The Standard color chart of
phosphorus that represents in
different tone of blue color (VL: very
low), L: low, M: medium, H: high and
VH: very high (level of Phosphorus)
Figure 3: The standard color chart for Nitrate that presents
in different tone of pink solution and each tone represents
different level of Nitrogen or Nitrate
7. Data Collection
Soil Primary Nitrogen Phosphorus Potassium
Productivity (N) (P) (K)
(g/ m2 d)
Soil Sample 1 12.55 Low Medium Low
(Flat Surface)
Soil Sample 2 10.63 Very Low Low Low
(Slope Surface)
Table 1: This table compares the level of nutrients (N, P, K) concentration in the each
soil sample (flat surface and slope surface). The level of Nitrogen, Phosphorus and
Potassium are measure by comparing the color from the result solution with the
color chart of each element in the figure above (figure 1,2 and 3). The result shows
that Soil Sample 1, which primary productivity is 12.55 has a higher level or nitrogen
and phosphorus than soil sample 2. The two soil samples (flat surface and slope
surface) have the same level of potassium.
Graph 1
Primary Productivity (g/ m2 d)
Soil Sample 2 Primary Productivity (g/
m2 d)
Soil Sample 1
9.5 10 10.5 11 11.5 12 12.5 13
Graph 1: This graph shows compare the level of primary productivity from Soil
Sample 1 (flat surface) and Soil Sample 2 (slope surface). Each Soil Sample has
different level of nutrients. Therefore, they have different primary productivity
outcome.
Conclusion
The result shows that Soil Sample 1, which has 12.55 g/m2, has a higher
primary productivity than Soil Sample 2, which has a primary productivity of 10.63
g/m2. Table 1 shows that the level of nitrogen and phosphorus in Soil Sample 1 is
higher than Soil level 2. Soil Sample 1 has a Low nitrogen level while Soil Sample 2
has a very Low nitrogen level. Soil Sample 1 has a Medium level of phosphorus while
8. Soil Sample 2 has a Low level of phosphorus. Soil Sample 1 and Soil Sample 2 have
the same level of Potassium, which is Low. The result shows that as the level of
nutrient (nitrogen, Phosphorus and Potassium) increases, the level of primary
productivity also increases.
Discussion
Based on Roel Reighman’s experiment in 1991. Reighman did an experiment
about the relationship between primary productivity and nutrients in Phytoplankton.
Similar to this lab, Reighman measures the daily primary productivity of the species.
In contrast, Reighman measures the whole Phytoplankton but these lab only
measures the 1cm above soil surface grasses discard the roots of the grasses. If the
roots are added in the experiment, the result of this lab may be slightly different due
to effect of the nutrients on the roots’ growth. He also used Nitrogen, Phosphorus
and Potassium’s developer and power to measure the level of each nutrient in the
Phytoplankton in the environment that he selected. He discover that the area that
has higher nitrogen, phosphorus and potassium level, there is higher daily primary
productivity in Phytoplankton. Since the subject that was tested in Reighman’s
experiment is Phytoplankton, which is very small specie, it is hard to compare with
the level of primary productivity that found in grasses in this lab report due to the
huge size different of the subjects. However, the result of Reighmen’s experiment
confirms this lab report result since both labs agrees that there is a strong
relationship between nutrients in the soil and primary productivity. When the level
of nutrients in the soil increases, the level of primary productivity also increases.
Evaluation
There are several aspects that can be improved in this experiment. There
might be a slightly different time that is used to heat the grasses between during the
heating processes (time and temperature) of Soil Sample 1 and Soil Sample 2. If this
occurs, the Soil Sample that has less time to heat in the over will still contain some
water in it and increase its level of primary productivity. After the dropped either
nutrients’ developer or powder inside the soil solution, if it is not accurately 2
minutes, the color may not be completely develop into the final color. For example,
the color might appear as light yellow when the time reaches 1 minute, but without
waiting until exact 2 minutes, the color might still remain yellow when it is suppose
to change into light orange at the time of 2 minutes. If this lab includes the root of
the grasses rather than just the grasses that are 1cm above the ground, the result
might be slightly different because the roots are also a part of the grass that can be
affected by the level of nutrients. During the process of cutting the grasses, it is
impossible for the experimenter to cut exactly 1cm above the ground for the whole
cutting process. This may affect the result of the lab due to the inaccurate in biomass
of the grasses. In order to future improve this experiment for future experiment, the
two locations should be reasonably far away from each other since the locations that
are near each other have a high possibility that the level nutrients are not
significantly different. Also, the subjects of the lab can be different type of plants in
order to give a wider perspective of how the nutrients affect the primary
productivity in for different type of plants.