Enzyme And Root Activities In Surface Flow Constructed Wetlands
1. Chemosphere 76 (2009) 601–608
Contents lists available at ScienceDirect
Chemosphere
journal homepage: www.elsevier.com/locate/chemosphere
Enzyme and root activities in surface-flow constructed wetlands
Ling Kong, Yu-Bin Wang, Li-Na Zhao, Zhang-He Chen *
Key Laboratory of Ecology and Environmental Science in Guangdong Higher Education, College of Life Science, South China Normal University, 510631 Guangzhou, PR China
Guangdong Provincial Key Lab of Biotechnology for Plant Development, College of Life Science, South China Normal University, 510631 Guangzhou, PR China
a r t i c l e i n f o a b s t r a c t
Article history: Sixteen small-scale wetlands planted with four plant species were constructed for domestic wastewater
Received 12 December 2008 purification. The objective of this study was to determine the correlations between contaminant removal
Received in revised form 23 April 2009 and soil enzyme activity, root activity, and growth in the constructed wetlands. The results indicated that
Accepted 24 April 2009
correlations between contaminant removal efficiency and enzyme activity varied depending on the con-
Available online 3 June 2009
taminants. The removal efficiency of NHþ was significantly correlated with both urease and protease
4
activity in all wetlands, and the removal of total phosphorus and soluble reactive phosphorus was signif-
Keywords:
icantly correlated with phosphatase activity in most wetlands, while the removal of total nitrogen, NOÀ , 3
Enzyme activity
Root activity
and chemical oxygen demand (COD) was significantly correlated with enzyme activity only in a few
Contaminant removal instances. Correlations between soil enzyme activity and root activity varied among species. Activities
Constructed wetlands of all enzymes were significantly correlated with root activity in Vetiveria zizanioides and Phragmites aus-
tralis wetlands, but not in Hymenocallis littoralis wetlands. Significant correlations between enzyme activ-
ity and root biomass and between enzyme activity and root growth were found mainly in Cyperus
flabelliformis wetlands. Root activity was significantly correlated with removal efficiencies of all contam-
inants except NOÀ and COD in V. zizanioides wetlands. Enzyme activities and root activity showed single-
3
peak seasonal patterns. Activities of phosphatase, urease, and cellulase were significantly higher in the
top layer of the substrate than in the deeper layers, and there were generally no significant differences
between the deeper layers (deeper than 15 cm).
Ó 2009 Elsevier Ltd. All rights reserved.
1. Introduction supplement to constructed wetlands could enhance the biodegra-
dation processes.
During treatment of wastewater in constructed wetlands, high Plants play an important role in constructed wetlands, and they
molecular weight organic pollutants are degraded to low molecu- generally have positive effects on purification. Plants can influence
lar weight compounds and inorganic products. According to the soil enzyme activity by excreting exogenous enzymes, and can
current knowledge of soil biochemistry, this is achieved via the affect species composition and diversity of microbes by releasing
metabolism of microorganisms (Brix and Schierup, 1989) and en- exudates and oxygen into the rhizosphere that indirectly affect
zyme activity in the soil (Martens et al., 1992; Kang et al., 1998). enzyme activity. They can also reactivate the free enzymes which
Soil enzyme activity is proposed to be an important determinant may be inactivated and preserved by tannins and other chemicals
of water quality improvement in wetland systems (Freeman in the bulk anaerobic soil, by oxygenating the anaerobic substrate
et al., 1997; Kang et al., 1998; Shackle et al., 2000). Enzyme activity by its expanding root system (Neori et al., 2000). Research has
in constructed wetlands is affected by many factors, including bio- demonstrated higher enzyme activities in the area around the
logical factors (microbial populations, higher taxa, and fauna), soil rhizosphere than in the area beyond (Zhang et al., 2007). Niemi
factors (pH, texture, organic matter content, nutrient composition, et al. (2005) researched 12 soil enzymes and plant root growth,
depth profiles, etc.) and climate factors (Zaman et al., 1999; Duarte and found a positive correlation between plant root biomass and
et al., 2008; Reboreda and Cacador, 2008). For example, Shackle enzyme activity. Reboreda and Cacador (2008) also reported a po-
et al. (2000) suggested that enzyme activity could be modified by sitive correlation between root biomass and rhizosphere sediment
manipulating the quantity and quality of carbon supply to maxi- enzyme activity of five hydrolases. These studies indicated that
mize the efficiency of wastewater treatment in constructed wet- plant root biomass could affect enzyme activity in constructed
lands. Shackle et al. (2006) also reported that exogenous enzyme wetlands. In our previous studies on constructed wetlands, we
found that fine root biomass or the percentage of fine root biomass
in the total root biomass was more strongly correlated with
* Corresponding author. Tel.: +86 (0)20 85212758/15915819878; fax: +86 (0)20
85212078. decontamination than was total root biomass (Yang et al., 2007;
E-mail address: chenzhh@scnu.edu.cn (Z.-H. Chen). Cheng et al., 2009). Our results suggest that root growth status
0045-6535/$ - see front matter Ó 2009 Elsevier Ltd. All rights reserved.
doi:10.1016/j.chemosphere.2009.04.056
2. 602 L. Kong et al. / Chemosphere 76 (2009) 601–608
and activity might be more important than root biomass in affect- zyme activities, we collected soil samples from three depths (0–5,
ing substrate enzyme activity in constructed wetlands. 15–20, and 35–40 cm). Soil samples were lyophilized, sieved
The objective of this study was to determine whether correla- through 1.0 mm mesh to remove plant material and sand, mixed
tions existed among soil enzyme activities, root activity and thoroughly, and then stored at 4 °C prior to use. Soil samples were
growth, and contaminant removal in constructed wetlands. assayed within 1 week.
Phosphatase activity was measured using the modified method
of Schinner and von Mersi (1990). A soil sample (1 g) was mixed
2. Materials and methods with 0.25 mL toluene, 4 mL acetate buffer (pH 5.8) and 0.25 mL
0.115 M p-nitrophenol phosphate substrate solution, and the sam-
2.1. Treatment system and wetland management ple mixture was incubated for 1 h at 37 °C. The reaction was termi-
nated by adding 4 mL 0.5 M NaOH. The formation of p-nitrophenol
The study site is located in the Botanical Garden of South China was determined spectrophotometrically at 400 nm and enzyme
Normal University, Guangzhou, China. Guangzhou is located be- activity was expressed as lg p-nitrophenol gÀ1 soil hÀ1.
tween 112°570 and 114°350 E, and 22°360 and 24°040 N, and is with- Urease activity was determined according to Klose and Tabata-
in a subtropical monsoon climate zone. The annual average air bai (2000). A solution consisting of 10 mL phosphate buffer (pH
temperature is 21.4–21.9 °C. The mean temperature in the coldest 6.7), 0.5 mL toluene and 10 mL 10% aqueous urea was added to
month (January) is 13 °C and in the hottest month (July) is 28 °C. 5 g soil, and the mixture was incubated for 48 h at 37 °C. At the
The annual precipitation is approximately 1600–1900 mm, with end of the incubation period, 20 mL 1 M KCl was added. The cul-
the wet season occurring from April to September and the dry sea- ture solution was shaken thoroughly for 30 min and then filtered.
son from October to March. One millilitre of filtrate was diluted to 10 mL with distilled water,
Sixteen small-scale surface-flow constructed wetlands of 2.0 m and 1 mL potassium sodium tartrate and 0.8 mL Nessler reagent
(L) Â 1.0 m (W) Â 0.7 m (D) were aligned in two parallel lines. Soil were added. Then, 4 mL 1 M NaOH was carefully added to the solu-
from the garden field was added to each wetland to 0.6 m depth as tion, and the sample volume made up to 25 mL with distilled
the substrate. We selected four wetland plant species: Cyperus fla- water. The released NHþ was determined at 460 nm using a UV-
4
belliformis Rottb., Hymenocallis littoralis (Jacq.) Salisb., Phragmites 2000 spectrophotometer and the urease activity was expressed
australis Trin. ex Steud. and Vetiveria zizanioides (Linn.) Nash. These þ À1
as lg NH4 g soil 24 h . À1
species were selected because they are suitable for use in tropical Protease activity was assayed according to Kandeler et al.
and subtropical constructed wetlands. Fourteen seedlings were (1999) and Müller and Bordusa (2000). A 1 g soil sample was
randomly planted in each wetland in February 2006. Each species- placed in a test tube, 1 mL Tris–HCl buffer (pH 8.0) and 0.5 mL tol-
specific wetland was replicated four times. The wastewater used uene were added, and after 15 min 2 mL 1% casein solution was
in the experiment was the sewage from students’ dormitories. The added. The samples were then incubated for 24 h at 37 °C. At the
sewage flowed into a septic tank and through a settling tank, and end of the incubation period, 3 mL 15% trichloroacetic acid was
then was pumped to the experimental wetlands. Wastewater irriga- added to make a casein sediment, and then the samples were sha-
tion began in March 2006. Each week, 140 L of wastewater was ken gently and filtered. One millilitre filtrate was mixed with 5 mL
loaded into each wetland with an inundation depth of about 5– 0.4 M Na2CO3 and 1 mL Folin–Ciocalteu reagent, and then placed in
10 cm. The hydraulic loading rate was 10 L mÀ2 dÀ1 and the hydrau- an incubator for 15 min at 37 °C. The absorbance of the tyrosine re-
lic retention time (HRT) was 7 d. The average contaminant loading leased from the reaction was determined at 680 nm using a UV-
rates (mg mÀ2 dÀ1) were as follows: total nitrogen (TN), 177 ± 37; 2000 spectrophotometer, and the enzyme activity was expressed
NHþ , 145 ± 17; NOÀ , 7.9 ± 0.9; total phosphorus (TP), 24 ± 6; soluble
4 3 as lg tyrosine gÀ1 soil 24 hÀ1.
reactive phosphorus (SRP), 17 ± 5 and COD, 917 ± 217. Cellulase activity was assayed using phosphatase buffer (pH
5.5) with 1% carboxymethyl cellulose as the substrate. After incu-
2.2. Biomass, growth, and activity of root bating at 37 °C for 72 h, the mixture was boiled in a water bath
at 100 °C to terminate the reaction and then cooled under a run-
Root biomass was measured in July 2006 and in January 2007. ning tap. Potassium alum (0.3 g) was added to the mixture to form
For each species, eight 20 cm  20 cm plots were sampled from an insoluble CM-cellulose flocculate. The mixture was shaken thor-
the wetlands (two from each wetland). Soil samples were taken oughly and filtered. An aliquot of the filtrate (2.5 mL) was cooled in
from three depths: 0–10, 10–20, and 20–30 cm. The first and sec- an ice water bath and added carefully to 5 mL anthrone, cooled,
ond samples were taken from closely located sites within each then shaken gently. Then, the solution was boiled in a water bath
wetland. for 10 min in a covered test tube. The absorbance of the reducing
Root growth was measured using in-growth soil core method sugars was measured at 540 nm after cooling, and the cellulase
(Lee and Shibu, 2003). Eight 20 cm  20 cm plots were sampled activity was expressed as lg glucose gÀ1 soil 72 hÀ1 (Semenov
from the species-specific wetlands and soil samples were collected et al., 1996).
from three layers (0–10, 10–20, and 20–30 cm). Root growth was For all enzyme activities, assays were performed in triplicate
measured in April, July, and October 2006, and in January 2007. and were corrected for a blank.
Roots in the soil samples were separated, cleaned, dried at 80 °C
for 48 h and weighed. The sum of the four measurements was con- 2.4. Contaminant removal measurement
sidered as 1 year’s growth.
Root activity was measured every month from April 2006 to Water samples were taken once every 2 months between March
January 2007 using a-naphthylamine oxidation method (Ota, 2006 and January 2007. Surface water (200 mL) was taken from
1970). Young roots were collected from eight individuals and used each of three locations along a diagonal line for HRT at 24 and
for root activity assays. 48 h, respectively, for each wetland. All water samples were trans-
ported to the university laboratory and analyzed immediately for
2.3. Soil enzyme activity TN, TP, NHþ , NOÀ , SRP, and COD according to standard methods
4 3
(State Environmental Protection Administration of China, 2002).
Soil was collected with a soil sampler once every 2 months from Removal efficiencies (%) of the contaminants listed above were
March 2006 to January 2007. To study vertical variation of the en- based on influent and effluent concentrations.
3. L. Kong et al. / Chemosphere 76 (2009) 601–608 603
2.5. Statistical analysis higher activity was observed in July (in H. littoralis and V. zizanio-
ides wetlands) or September (in P. australis wetlands). The annual
Data were analyzed using the Statistical Package for Social Sci- average of phosphatase activity was higher in V. zizanioides and
ence (version 13.0) program. Pearson’s correlation coefficients and C. flabelliformis wetlands.
p-values were calculated for all possible pairs of variables. Analyses Protease activity showed a clear, single-peak trend in all three
of variance were performed to determine the effects of soil layers sample layers and in all four species-specific wetlands. The maxi-
on the enzyme activities, and to compare the root biomass and mum activities were observed in September and the minimum
growth differences with species. Differences between means were activities in November (Fig. 2). The annual average protease activ-
tested using paired-sample T-tests. ity was significantly higher in P. australis wetlands than in C. flabell-
iformis wetlands (p < 0.05). There was no significant difference in
3. Results annual average protease activity among the other wetlands.
In contrast to the enzyme activities of phosphatase and prote-
3.1. Vertical variations in enzyme activity ase, urease activity showed two maxima: one in spring (May)
and the other in fall (September) (Fig. 2). In the deepest layer, ure-
Activities of enzymes were significantly higher (p < 0.05) in the ase activity was significantly higher in P. australis wetlands than in
top layer in most of the wetlands, and were generally not signifi- the other wetlands. There was no significant difference in annual
cantly different between the two deeper layers (Fig. 1). With respect average urease activities among the wetlands, although higher val-
to different wetlands, C. flabelliformis and V. zizanioides wetlands ues of urease activity were observed at some time points in C. fla-
exhibited significantly higher enzyme activities in the top layer than belliformis and P. australis wetlands.
in the deeper layers for almost all the enzymes, while this pattern Cellulase activity fluctuated more than the other three soil en-
was only observed for some enzymes in H. littoralis and P. australis zymes, although activity was relatively high in September (Fig. 2).
wetlands. Although higher urease and phosphatase activities were There was no significant difference in annual average cellulase
measured in C. flabelliformis wetlands, there was no significant activities among the wetlands, although cellulase activity at some
difference in enzyme activities between the wetlands. time points was higher in H. littoralis and V. zizanioides wetlands.
3.2. Temporal variations in enzyme activity 3.3. Root activity, biomass, and growth
The activities of phosphatase, protease, urease, and cellulase Root activities showed a single-peak monthly pattern for all
showed large variations over time. The temporal patterns of phos- species, with the maximum activity generally in August or July
phatase, protease, and urease activities were similar among the (Fig. 3). However, there were differences between plant species.
four types of wetlands, but cellulase activity varied widely among C. flabelliformis and H. littoralis had higher root activity in the early
the different wetlands (Fig. 2). months, while P. australis retained a high root activity during the
In the top layer of soil samples, phosphatase activity exhibited a late months. During the early months (April–August), average root
single-peak pattern with highest activity in September. For the activities of C. flabelliformis and H. littoralis were significantly higher
middle and the deepest layer, the variation was less distinctive; (p < 0.05) than that of V. zizanioides. During the later months,
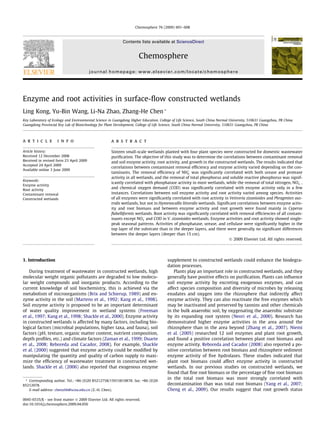
Fig. 1. Enzyme activity at different soil depths in the species-specific surface-flow constructed wetlands (mean ± SD, n = 24).
4. 604 L. Kong et al. / Chemosphere 76 (2009) 601–608
Fig. 2. Annual variation of enzyme activity in the species-specific surface-flow constructed wetlands (mean ± SD, n = 4). (a): C. flabelliformis; (b): H. littoralis; (c): P. australis;
(d): V. zizanioides.
P. australis had significantly higher (p < 0.05) average root activity distributed vertically but not horizontally. The other three root sys-
than other species. Root activities of all the plants decreased in June, tems were mainly distributed in the upper 10 cm of the substrate.
probably because of the high rainfall in June that year. P. australis Root biomass increment (estimation of root growth) showed a
and C. flabelliformis had higher average root activity, and V. zizanioides single-peak pattern during the growing season for all plant species
showed a significantly lower root activity than other species. except P. australis, which did not show a significant decrease in
Distribution of root biomass varied among plant species root growth during the late months. H. littoralis had the greatest
(Fig. 4a). V. zizanioides had a high proportion (about 50%) of root root growth. In general, root growth differed significantly among
biomass distributed deeper than 20 cm. Its roots were generally most of the species (Fig. 4b).
5. L. Kong et al. / Chemosphere 76 (2009) 601–608 605
Fig. 2 (continued)
3.4. Correlation between enzyme activity and contaminant removal correlated with phosphatase activity in most wetlands, while re-
moval of TN was correlated with urease and protease activities
There was a strong correlation between NHþ removal and en-
4 only in a few wetlands, and few correlations were found between
zyme activity. In almost all wetlands, significant correlations ex- removal of COD or NOÀ and enzyme activities (Table 1).
3
þ
isted between NH4 removal efficiencies and urease and protease With respect to plant species, enzyme activity was strongly cor-
activities. Removal of TP and SRP were also significantly related with NHþ , TN, TP, and SRP removal in P. australis wetlands,
4
6. 606 L. Kong et al. / Chemosphere 76 (2009) 601–608
Fig. 3. Plant root activity of four species from April 2006 to January 2007 in the species-specific surface-flow constructed wetlands (mean ± SD, n = 4).
Table 1
Correlation coefficients between soil enzyme activity and contaminant removal
efficiencies in species-specific surface-flow constructed wetlands.
C. flabelliformis H. littoralis P. australis V. zizanioides
Phosphatase-TP (24 h) 0.165 0.368 0.467* 0.644**
Phosphatase-TP (48 h) 0.630** 0.197 0.567** 0.797**
Phosphatase-SP (24 h) 0.304 0.715** 0.322 0.690**
Phosphatase-SP (48 h) 0.143 0.682** 0.612** 0.785**
Protease-NHþ (24 h)
4 0.569** 0.731** 0.543* 0.651**
Protease-NHþ (48 h)
4 0.269 0.657** 0.160 0.485*
Protease-TN (24 h) 0.070 À0.390 0.688** À0.096
Protease-TN (48 h) 0.220 0.584** 0.595** 0.420
Protease-NOÀ (24 h)
3 0.017 0.319 À0.355 À0.326
Protease-NOÀ -(48 h)
3 À0.415 À0.214 À0.274 À0.218
þ
Urease-NH4 (24 h) 0.766** 0.998** 0.767** 0.747**
þ
Urease-NH4 (48 h) 0.563** 0.961** 0.553** 0.782**
Urease–TN (24 h) 0.365 0.017 0.663** À0.002
Urease–TN (48 h) 0.184 0.209 0.334 0.329
Urease–NO3-(24 h) 0.644** 0.542* 0.201 0.210
Urease–NOÀ (48 h)
3 À0.070 À0.022 0.245 0.306
Cellulose-COD (24 h) 0.390 À0.127 0.357 0.037
Cellulose-COD (48 h) 0.632** À0.520* 0.177 À0.095
*
Represent significant correlations at p < 0.05.
**
Represent significant correlations at p < 0.01.
H. littoralis, and P. australis wetlands. COD removal was not corre-
lated with root activity in any of the wetlands (Table 2).
3.6. Correlation between enzyme activity and root activity
Enzyme activity was significantly correlated with root activity
in most wetlands (Table 3). In P. australis and in V. zizanioides wet-
Fig. 4. Root biomass measured in January 2007 (a) and root biomass increment for Table 2
a growth season measured with inset soil cores (b) in the species-specific surface- Correlation coefficients between root activities and contaminant removal efficiencies
flow constructed wetlands. Different letters denote significant differences among in species-specific surface-flow constructed wetlands.
species at p < 0.05 (mean ± SD, n = 8).
C. flabelliformis H. littoralis P. australis V. zizanioides
TP (24 h) 0.438 0.052 À0.473 0.828**
TP (48 h) 0.706** À0.145 0.060 0.313
with NHþ ,
4 TP, and SRP removal in V. zizanioides wetlands, with NHþ
4 SP (24 h) À0.090 0.039 À0.648** 0.747**
and SRP removal in H. littoralis wetlands, and with NHþ removal in
4 SP (48 h) 0.353 0.413 À0.197 0.869**
C. flabelliformis wetlands (Table 1). NHþ (24 h)
4 0.238 0.343 À0.321 0.902**
NHþ (48 h)
4 0.291 0.329 À0.647** 0.822**
TN (24 h) 0.818** 0.555* 0.002 0.624**
3.5. Correlation between root activity and contaminant removal
TN (48 h) 0.453 0.171 0.283 0.683**
NOÀ (24 h)
3 À0.159 À0.011 À0.799** À0.245
Root activity of V. zizanioides was significantly correlated with NOÀ (48 h)
3 À0.780** À0.484* À0.607** À0.293
removal of all contaminants except NOÀ and COD. Only a few posi-
3
COD (24 h) À0.295 À0.387 À0.291 0.109
tive correlations between root activity and contaminant removal COD (48 h) À0.095 À0.230 À0.285 0.293
were found in other wetlands. A significant negative correlation be- *
Represent significant correlations at p < 0.05.
tween root activity and NOÀ removal was found in C. flabelliformis,
3
**
Represent significant correlations at p < 0.01.
7. L. Kong et al. / Chemosphere 76 (2009) 601–608 607
Table 3 negatively correlated with NOÀ removal in the present study. Re-
3
Correlation coefficients between enzyme activity and root activity, root biomass, and moval of NOÀ principally relies on plant uptake and microbial
3
root biomass increment in species-specific surface-flow constructed wetlands.
denitrification (Haberl and Perfler, 1991). Higher root activity
C. flabelliformis H. littoralis P. australis V. zizanioides might result in release of more oxygen, which might limit anaero-
Root activity bic denitrification by microbes. This may explain the negative cor-
Phosphatase 0.472 0.327 0.789** 0.687* relation between root activity and NOÀ removal.
3
Protease 0.591* 0.380 0.996** 0.744** Correlations between enzyme activity and contaminant re-
Urease 0.680* 0.378 0.871** 0.792**
Cellulase 0.426 0.074 0.903** 0.873**
moval efficiency varied greatly among the enzymes and contami-
nants. Removal of NHþ was correlated with urease and protease
4
Root biomass
Phosphatase 0.051 À0.667** 0.327 À0.095
activities, while removal of COD and NOÀ was generally not corre-
3
Protease 0.876** À0.806** À0.106 À0.137 lated with enzyme activity. Higher urea concentrations are found
Urease 0.674** À0.431 À0.034 0.224 in waters polluted by sewage discharge, which is similar to the
Cellulase 0.278 0.336 À0.230 0.376 wastewater used in this research. Non-enzymatic urea hydrolysis
Root biomass increment occurs only at a very low rate, approximately 0–2% (Antia et al.,
Phosphatase 0.650* 0.056 0.594* 0.273 1991; Thorén, 2007), this indicates the important role of urease
Protease 0.692* 0.350 0.503 0.517
in urea hydrolysis. On the other hand, urease activity can be lim-
Urease 0.049 0.056 0.510 0.559
Cellulase 0.720** 0.636* 0.413 À0.084 ited by high levels of NHþ , a product of the urea hydrolysis (Thoré-
4
n, 2007). Significant correlation between urease activity and NHþ 4
*
Represent significant correlations at p < 0.05.
**
removal in this study is likely because that urease promotes urea
Represent significant correlations at p < 0.01.
hydrolysis to form NHþ , the latter is easily give off from water col-
4
umn and is absorbed by the plant.
The potential sources of nitrate to the wastewater are nitrogen-
lands, significant (p < 0.01 or p < 0.05) positive correlations existed containing chemicals and decomposition of organic wastes from
between activities of all enzymes and root activity. In C. flabellifor- the dormitories. However, the concentration of nitrate in the
mis wetlands, only protease and urease activities were significantly wastewater is much lower than the concentration of NHþ , which
4
(p < 0.05) correlated with root activity. Enzyme activities were not indicates that nitrification may occur only at a low level. Most
correlated with root activity in H. littoralis wetlands. nitrogen in sewage is in the form of NHþ and because of low dis-
4
solved oxygen concentration there is little room for nitrification
3.7. Correlation between enzyme activity and root biomass and growth before the wastewater reaches the plant. This explains why there
were no correlations found between enzyme activities and effi-
There were a few significant correlations between enzyme ciency of NOÀ removal in the present study.
3
activities and root biomass in C. flabelliformis and H. littoralis wet- The inverse relationship between phosphatase activity and soil
lands, but no significant correlations were found in P. australis and phosphorus concentration has been shown in several studies
V. zizanioides wetlands (Table 3). Significant correlations existed (Wright and Reddy, 2001; Allison and Vitousek, 2005; Allison
between root growth and activities of phosphatase, protease, and et al., 2007). Kang et al. (1998) also indicated that soil enzyme
cellulase in C. flabelliformis wetland, but few significant correla- activities are partly responsible for improving water quality. A po-
tions between enzyme activities and root growth existed in the sitive correlation between phosphatase activity and phosphorus
other wetlands (Table 3). removal was found in most of the wetlands in the present study.
Root activity showed a stronger correlation with enzyme activ-
4. Discussion ity, while root biomass showed a weaker correlation (Table 3). Sig-
nificant positive correlations between root biomass and enzyme
Previous studies have reported that enzyme activities decrease activity and between root growth and enzyme activity existed
with soil depth (Aon and Colaneri, 2001; Niemi et al., 2005). In the mostly in C. flabelliformis wetland. Root biomass and growth in C.
present study, enzyme activities were higher in the top layer of flabelliformis wetland were not the largest of all the wetlands, but
substrate for almost all enzymes and in almost all wetlands. En- this wetland had the highest percentage of small-size roots (diam-
zyme activities decreased with depth, but generally there were eter 6 1 mm). These results suggest that root activity and root size
no significant differences among the layers deeper than 15 cm. This (root surface area) were more important than root biomass in
result indicates that the upper 15 cm of the constructed wetland affecting enzyme activity and decontamination ability.
medium is crucial for contaminant decomposition.
Plant roots are crucial for wetland plants growing in an anaero-
5. Conclusions
bic substrate. They release oxygen into the medium, which is
favorable for aerobic microbes and for contaminant removal (Nie-
In the constructed wetlands, urease and protease activities were
mi et al., 2005). Therefore, it can be suggested that growth status of
strongly correlated with NHþ removal, and phosphatase activity
4
plant roots might affect enzyme activities in the substrate through
was correlated with TP and SRP removal. Our results indicate that
affecting the diversity, growth, and activity of substrate microbes.
urease, protease, and phosphatase might play important roles in
In the present study, we found many significant positive correla-
NHþ and phosphorus removal in constructed wetlands. The strong
4
tions between soil enzyme activity and root activity, except in H.
correlation between root activity and enzyme activity indicated
littoralis wetland. This result suggested that plant root activity
that plant root activity can affect enzyme activity, and that plant
has a positive impact on enzyme activities. Root activity was signif-
roots have important effects on contaminant removal.
icantly correlated with contaminant removal only in a few in-
stances in the present study. This may be because that root
activity played an indirect role in contaminant removal, and plant Acknowledgments
uptake only accounted for a small part of contaminant removal. A
greater correlation between root activity and contaminant removal The project was supported by the National Natural Science
was found in V. zizanioides wetland, suggesting that the role of root Foundation of China (No. 30470346), and the Natural Science
activity may differ among different plant species. Root activity was Foundation of Guangdong Province (Nos. 021082 and 06025056).
8. 608 L. Kong et al. / Chemosphere 76 (2009) 601–608
References Müller, N., Bordusa, F., 2000. Assay of diverse protease activities on the basis of a
small synthetic substrate. Anal. Biochem. 286, 86–90.
Neori, A., Reddy, K.R., Ciskova-Koncalova, H., Agami, M., 2000. Bioactive chemicals
Allison, S.D., Vitousek, P.M., 2005. Responses of extracellular enzymes to simple and
and biological–biochemical activities and their functions in rhizospheres of
complex nutrient inputs. Soil Biol. Biochem. 37, 937–944.
wetland plants. Bot. Rev. 66, 351–378.
Allison, V.J., Condron, L.M., Peltzerc, D.A., Richardsonc, S.J., Turner, B.L., 2007.
Niemi, R.M., Vepsalainen, M., Wallenius, K., Simpanen, S., Alakukku, L., Pietola, L.,
Changes in enzyme activities and soil microbial community composition along
2005. Temporal and soil depth-related variation in soil enzyme activities and in
carbon and nutrient gradients at the Franz Josef chronosequence, New Zealand.
root growth of red clover (Trifolium pratense) and timothy (Phleum pratense) in
Soil Biol. Biochem. 39, 1770–1781.
the field. Appl. Soil Ecol. 30, 113–125.
Antia, N.J., Harrison, P.J., Oliveira, L., 1991. The role of dissolved organic nitrogen in
Ota, Y., 1970. Diagnostic method for measurement of root activity in rice plant. Jpn.
phytoplankton nutrition, cell biology and ecology. Phycologia 30, 1–89.
Agr. Res. Quart. 5, 1–6.
Aon, M.A., Colaneri, A.C., 2001. Temporal and spatial evolution of enzymatic
Reboreda, R., Cacador, I., 2008. Enzymatic activity in the rhizosphere of Spartina
activities and physico-chemical properties in an agricultural soil. Appl. Soil Ecol.
maritima: Potential contribution for phytoremediation of metals. Mar. Environ.
18, 255–270.
Res. 65, 77–84.
Brix, H., Schierup, H.H., 1989. The use of aquatic macrophytes in water-pollution
Schinner, F., von Mersi, W., 1990. Xylanase-, CM-cellulase- and invertase activity in
control. Ambio 18, 100–107.
soil: an improved method. Soil Biol. Biochem. 22, 511–515.
Cheng, X.Y., Chen, W.Y., Gu, B.H., Liu, X.C., Chen, F., Chen, Z.H., Zhou, X.Y., Li, Y.X.,
Semenov, A.M., Batomunkueva, B.P., Nizovtseva, D.V., Panikov, N.S., 1996. Method of
Huang, H., Chen, Y.J., 2009. Morphology, ecology and contamination removal
determination of cellulase activity in soils and in microbial cultures, and its
efficiency of eight wetland plants with differing root systems. Hydrobiologia
calibration. J. Microbiol. Methods 24, 259–267.
623, 77–85.
Shackle, V.J., Freeman, C., Reynolds, B., 2000. Carbon supply and the regulation of
Duarte, B., Reboreda, R., Caçador, I., 2008. Seasonal variation of extracellular
enzyme activity in constructed wetlands. Soil Biol. Biochem. 32, 1935–1940.
enzymatic activity (EEA) and its influence on metal speciation in a polluted salt
Shackle, V.J., Freeman, C., Reynolds, B., 2006. Exogenous enzyme supplements to
marsh. Chemosphere 73, 1056–1063.
promote treatment efficiency in constructed wetlands. Sci. Total Environ. 361,
Freeman, C., Lock, M.A., Hughes, S., Reynolds, B., Hudson, J.A., 1997. Nitrous oxide
18–24.
emissions and the use of constructed wetlands for water quality amelioration.
State Environmental Protection Administration of China, 2002. Methods for Water
Environ. Sci. Technol. 31, 2438–2440.
Analysis, fourth ed. Environment Science Press, Beijing, pp. 200–285 (in
Haberl, R., Perfler, R., 1991. Nutrient removal in a reed bed system. Water Sci.
Chinese).
Technol. 23 (4), 729–737.
Thorén, A.K., 2007. Urea transformation of wetlands microbial communities.
Kandeler, E., Luxhùi, J., Tscherko, D., Magid, J., 1999. Xylanase, invertase and
Microbial Ecol. 53, 221–232.
protease at the soil-litter interface of a loamy sand. Soil Biol. Biochem. 31,
Wright, A.L., Reddy, K.R., 2001. Phosphorus loading effects on extracellular enzyme
1171–1179.
activity in everglades wetland soils. Soil Sci. Soc. Am. J. 65, 588–595.
Kang, H., Freeman, C., Lee, D., Mitsch, W.J., 1998. Enzyme activities in constructed
Yang, Q., Chen, Z.H., Zhao, J.G., Gu, B.H., 2007. Contaminant removal of domestic
wetlands: implication for water quality amelioration. Hydrobiologia 368, 231–
wastewater by constructed wetlands: effects of plant species. J. Integr. Plant
235.
Biol. 49, 437–446.
Klose, S., Tabatabai, M.A., 2000. Urease activity of microbial biomass in soils as
Zaman, M., Di, H.J., Cameron, K.C., Frampton, C.M., 1999. Gross nitrogen
affected by cropping systems. Biol. Fert. Soils 31, 191–199.
mineralization and nitrification rates and their relationships to enzyme
Lee, K.H., Shibu, J., 2003. Soil respiration, fine root production, and microbial
activities and the soil microbial biomass in soils treated with dairy shed
biomass in cottonwood and loblolly pine plantations along a nitrogen
effluent and ammonium fertilizer at different water potentials. Biol. Fert. Soils
fertilization gradient. Forest Ecol. Manage 185, 263–273.
29, 178–186.
Martens, D.A., Johanson, J.B., Frankenberger, W.T., 1992. Production and
Zhang, B.J., Bai, X.L., He, K.L., Feng, Q.Y., Cheng, Y.J., 2007. Distribution status of soil
persistence of soil enzymes with repeated addition of organic residues. Soil
microbes and enzyme activity in bio-salver. Environ. Sci. Technol. 30, 26–28.
Sci. 153, 53–61.