Branford's Achievement Gap: A Concern?
•Download as DOC, PDF•
0 likes•325 views

This document has been corrected. I apologize for the confusion. The Gap should be a concern for all of us. A possible solution is offered

Recommended
Recommended
More Related Content
Similar to Branford's Achievement Gap: A Concern?
Similar to Branford's Achievement Gap: A Concern? (20)
Recently uploaded
Recently uploaded (20)
Branford's Achievement Gap: A Concern?
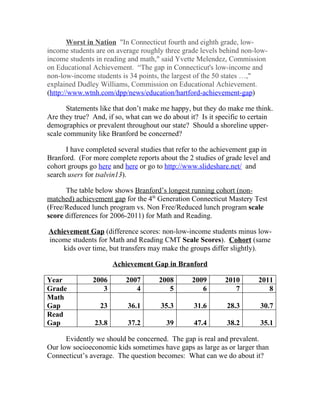
- 1. Worst in Nation "In Connecticut fourth and eighth grade, low- income students are on average roughly three grade levels behind non-low- income students in reading and math," said Yvette Melendez, Commission on Educational Achievement. “The gap in Connecticut's low-income and non-low-income students is 34 points, the largest of the 50 states …," explained Dudley Williams, Commission on Educational Achievement. (http://www.wtnh.com/dpp/news/education/hartford-achievement-gap) Statements like that don’t make me happy, but they do make me think. Are they true? And, if so, what can we do about it? Is it specific to certain demographics or prevalent throughout our state? Should a shoreline upper- scale community like Branford be concerned? I have completed several studies that refer to the achievement gap in Branford. (For more complete reports about the 2 studies of grade level and cohort groups go here and here or go to http://www.slideshare.net/ and search users for tsalvin13). The table below shows Branford’s longest running cohort (non- matched) achievement gap for the 4th Generation Connecticut Mastery Test (Free/Reduced lunch program vs. Non Free/Reduced lunch program scale score differences for 2006-2011) for Math and Reading. Achievement Gap (difference scores: non-low-income students minus low- income students for Math and Reading CMT Scale Scores). Cohort (same kids over time, but transfers may make the groups differ slightly). Achievement Gap in Branford Year 2006 2007 2008 2009 2010 2011 Grade 3 4 5 6 7 8 Math Gap 23 36.1 35.3 31.6 28.3 30.7 Read Gap 23.8 37.2 39 47.4 38.2 35.1 Evidently we should be concerned. The gap is real and prevalent. Our low socioeconomic kids sometimes have gaps as large as or larger than Connecticut’s average. The question becomes: What can we do about it?
- 2. A sociologist, Karl Alexander, from Johns Hopkins University studied 650 students in the Baltimore Public Schools from 1st through 5th grade by tracking their scores in reading (Karl L. Alexander; Doris R. Entwisle, 2003, “The Beginning School Study, 1982-2002"). The instrument, the California Achievement Test, was administered in June of each year. The first table shows results of end of year (June) CAT for each grade level. End of School Year Achievement Test Scores by Socioeconomic Level (June-Baltimore) 3rd 5th SocEcoClass 1st Grade 2nd Grade 4th Grade Grade Grade Low 329 375 397 433 461 Middle 348 388 425 467 497 High 361 418 460 506 534 Look at the scores of the first grade students in June of the year and you will see that the low socioeconomic group scored lower than the middle and high socioeconomic groups. For various reasons this could be expected. The gap grows through the five grades. The achievement gap being due to poor teachers and poor schools would be a likely conclusion. The unique and very telling occurrence that allows a secondary analysis was the test was given twice a year—at the beginning and end of the school year. Gains during the school year were measured and shown in the chart below. Gains During the School Year by Socioeconomic Level (September to June-Baltimore) st 2nd 3rd SocEcoClass 1 Grade 4th Grade 5th Grade Grade Grade Low 55 46 30 33 25 Middle 69 43 34 41 27 High 60 39 34 28 23 This table shows the gains of each socioeconomic group September to June school year first through fifth grades. These numbers indicate the achievement gains made by each group during the school year.
- 3. If you take a cumulative total of the gains during the school year by socioeconomic groups, you will see that the Low Group gained 189 points during their time in school besting the High Group gain of 184 points. Looking at the first chart for end of year scores could easily result in the suggestion that “schools are failing our low socioeconomic kids.” While looking at the second table shows us that schools are providing better gains for low socioeconomic kids than high socioeconomic kids. Why the paradox? Due to the advent of a pretest and posttest scenario, achievement can be calculated due to the summer break. These difference scores from the end of previous grade (June) to the beginning of next grade (September) are shown below. The results show what effect the summer break had on the students’ achievement. Effect of the Summer Break on Student Achievement by Socioeconomic Level (June to September-Baltimore) SocEcoClas 1st-2nd 2nd -3rd 3rd-4th 4th-5th Total s Low -3.67 -1.70 2.74 2.89 .26 Middle -3.11 4.18 3.68 2.34 7.09 High 15.38 9.22 14.51 13.38 52.49 This table is crucial for the explanation of the conundrum of how a school system can be successful with groups of kids while simultaneously failing the same groups of kids. By providing learning opportunities during the school year to kids, schools are successful, by not providing learning opportunities during the rest of the year—particularly the summer break, schools are failing. And the failure is registering vividly in the reported achievement gap leveled by socioeconomics, ethnicity, English as a second language, and other categories. The solution is to provide reading and math instruction for several weeks during the summer. Not “remedial” light duty phonics/comprehension and basic math facts practice morphed from several lower grades but contiguous rigorous instruction. “These summer school programs typically differ significantly from the regular school program in terms of curriculum, goals, and rigor.” (http://en.wikipedia.org/wiki/Summer_learning_loss)
- 4. Students exit school around the second week of June. Let them vacation until a week after the Fourth of July celebrations. Beginning on or about the tenth of July, open schools to all until the second week of August. To provide incentive and means for the gap kids (low-income), grant money should be sought. Regular income kids would be required to pay. Volunteer teachers working with college students who intend to become teachers could be an additional resource that should be explored. (This is not out of the question. A few years ago I wanted to volunteer to help begin a summer reading and math program primarily aimed at kids who needed the extra instruction. I talked to a few colleagues and 2 administrators. Besides myself, I found 2 teachers who were interested, and both administrators thought it a real possibility.) If the math and reading instructional content was “from the regular program…curriculum, goals…” and directed toward identified achievement gap students (the needy ones), but offered to all, the effect might be dramatic while cost effective. Using data-driven common sense and needed incentives, our schools could become summer community learning centers for anyone interested, with special emphasis on low-economic students and equal opportunity education for others. The achievement gap might become a thing of the past, and summer break would still be a satisfying 5-week holiday.