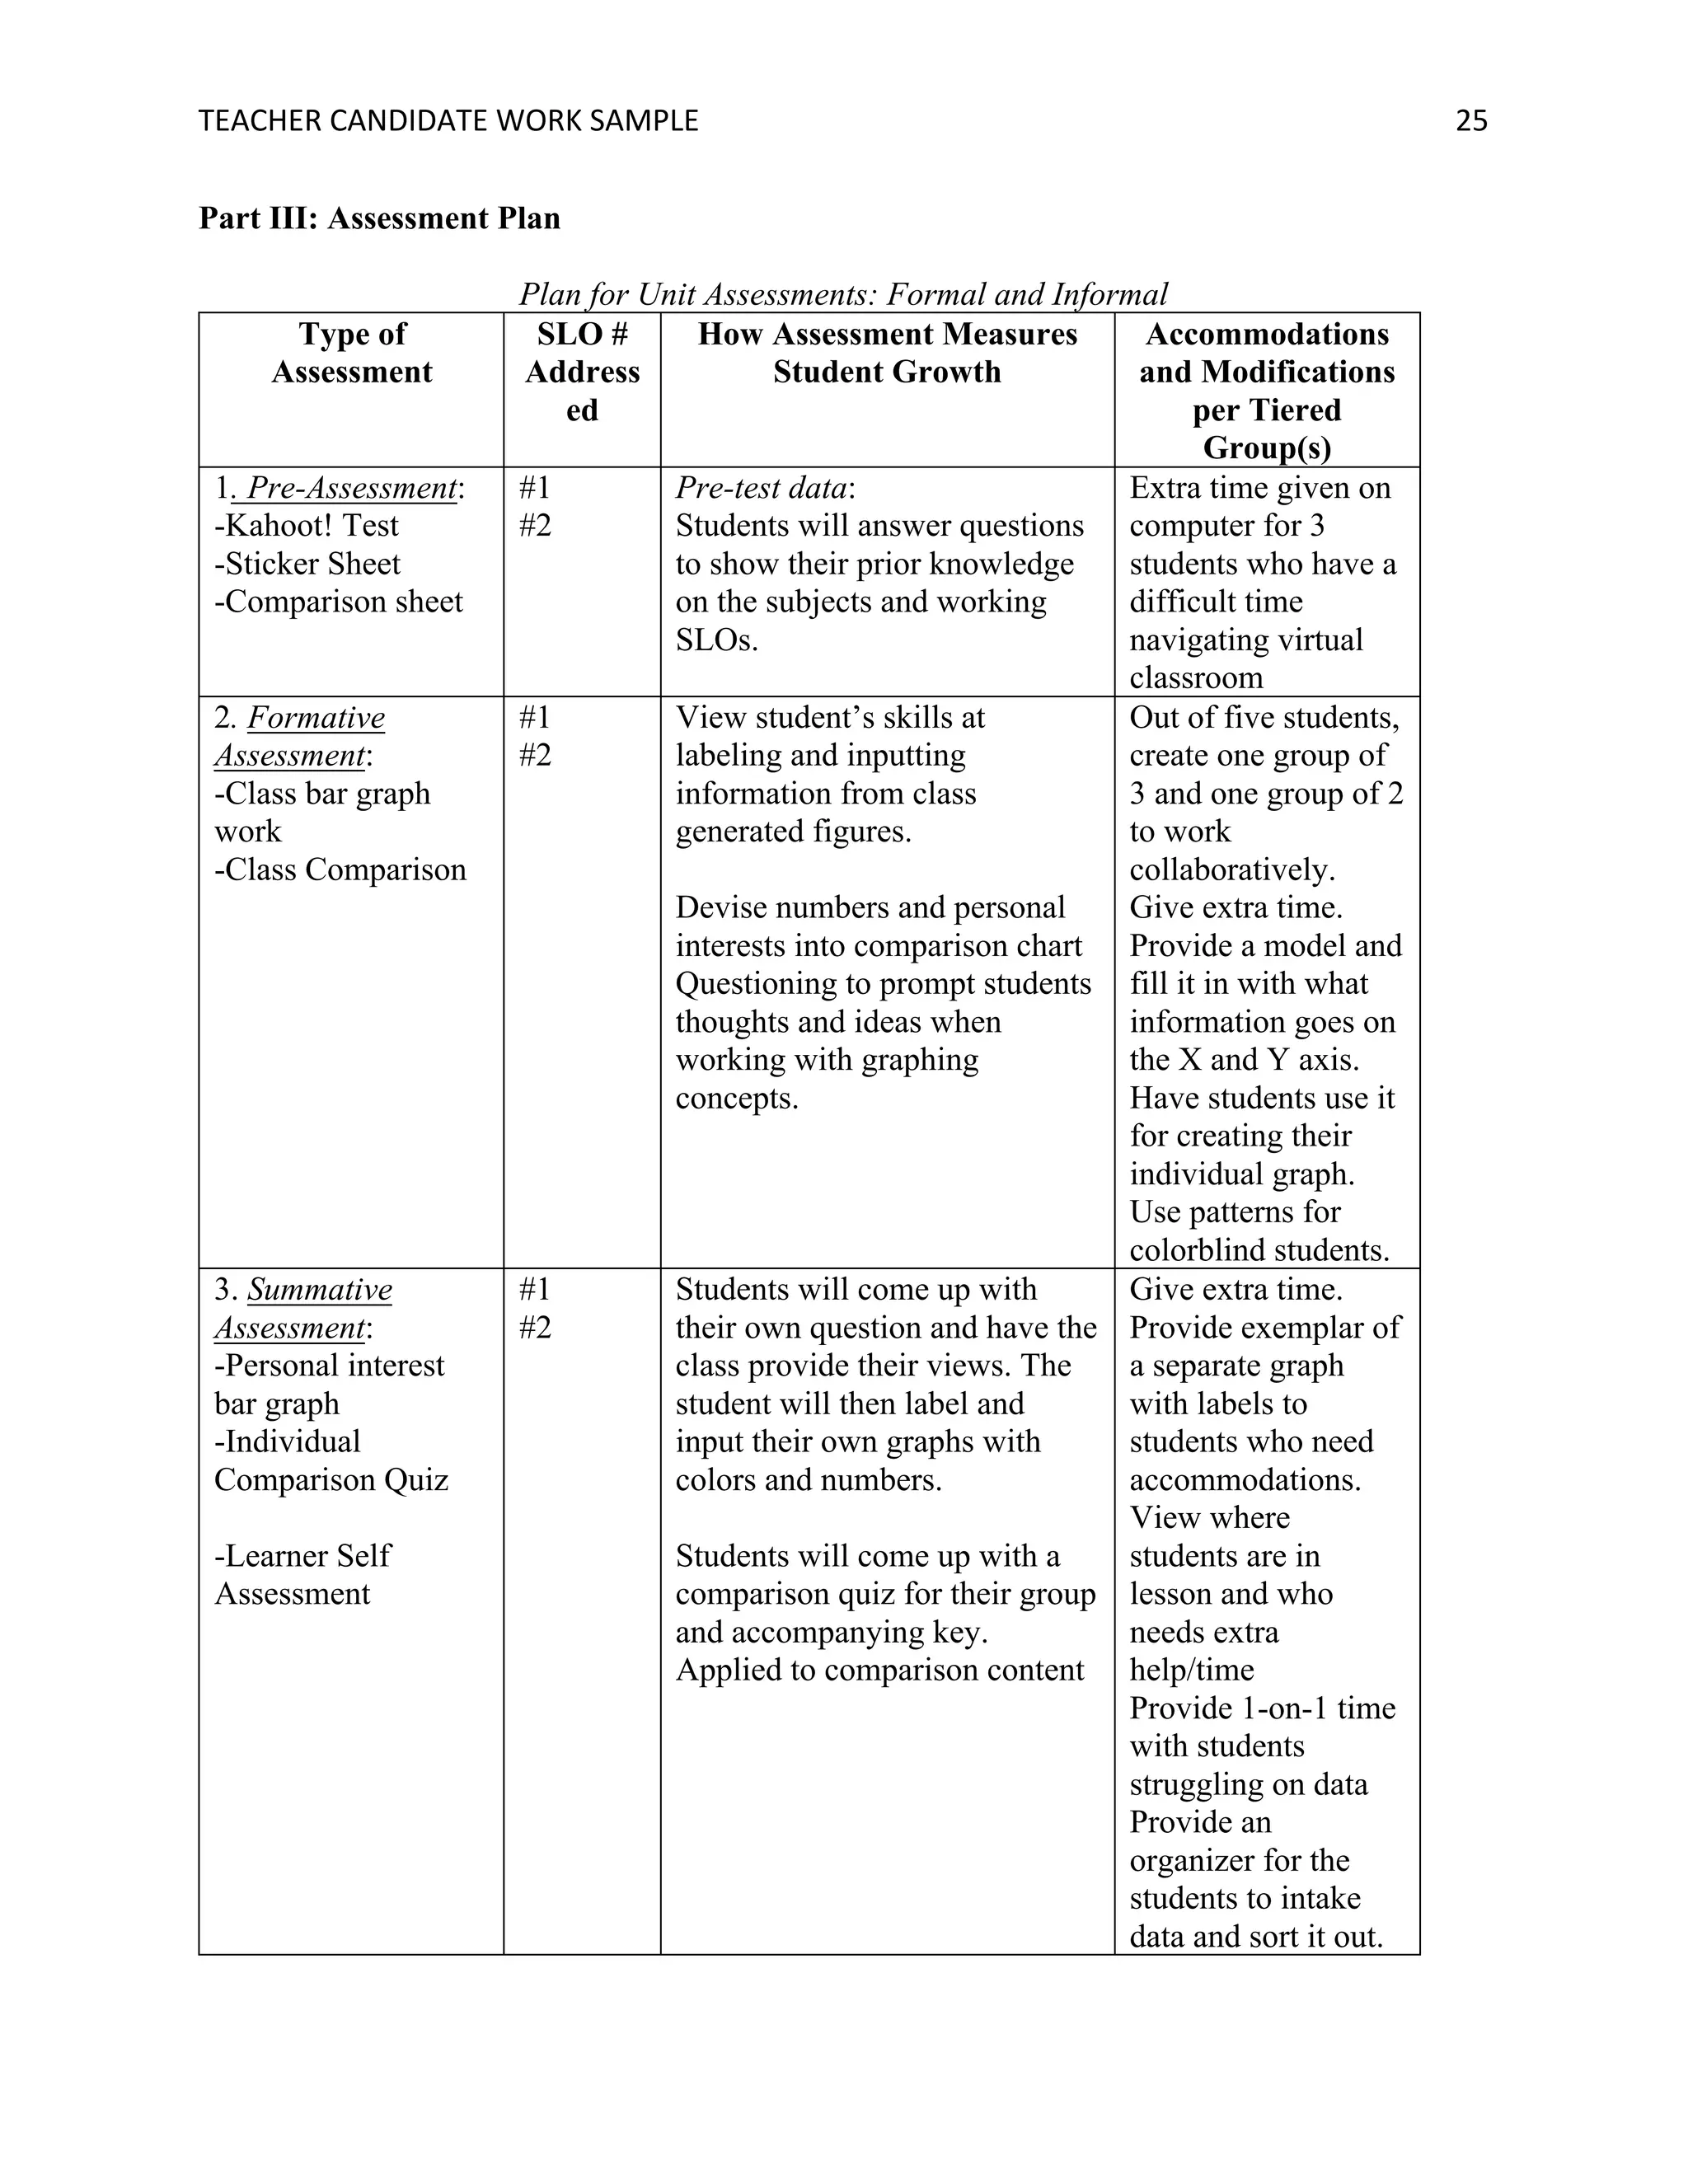
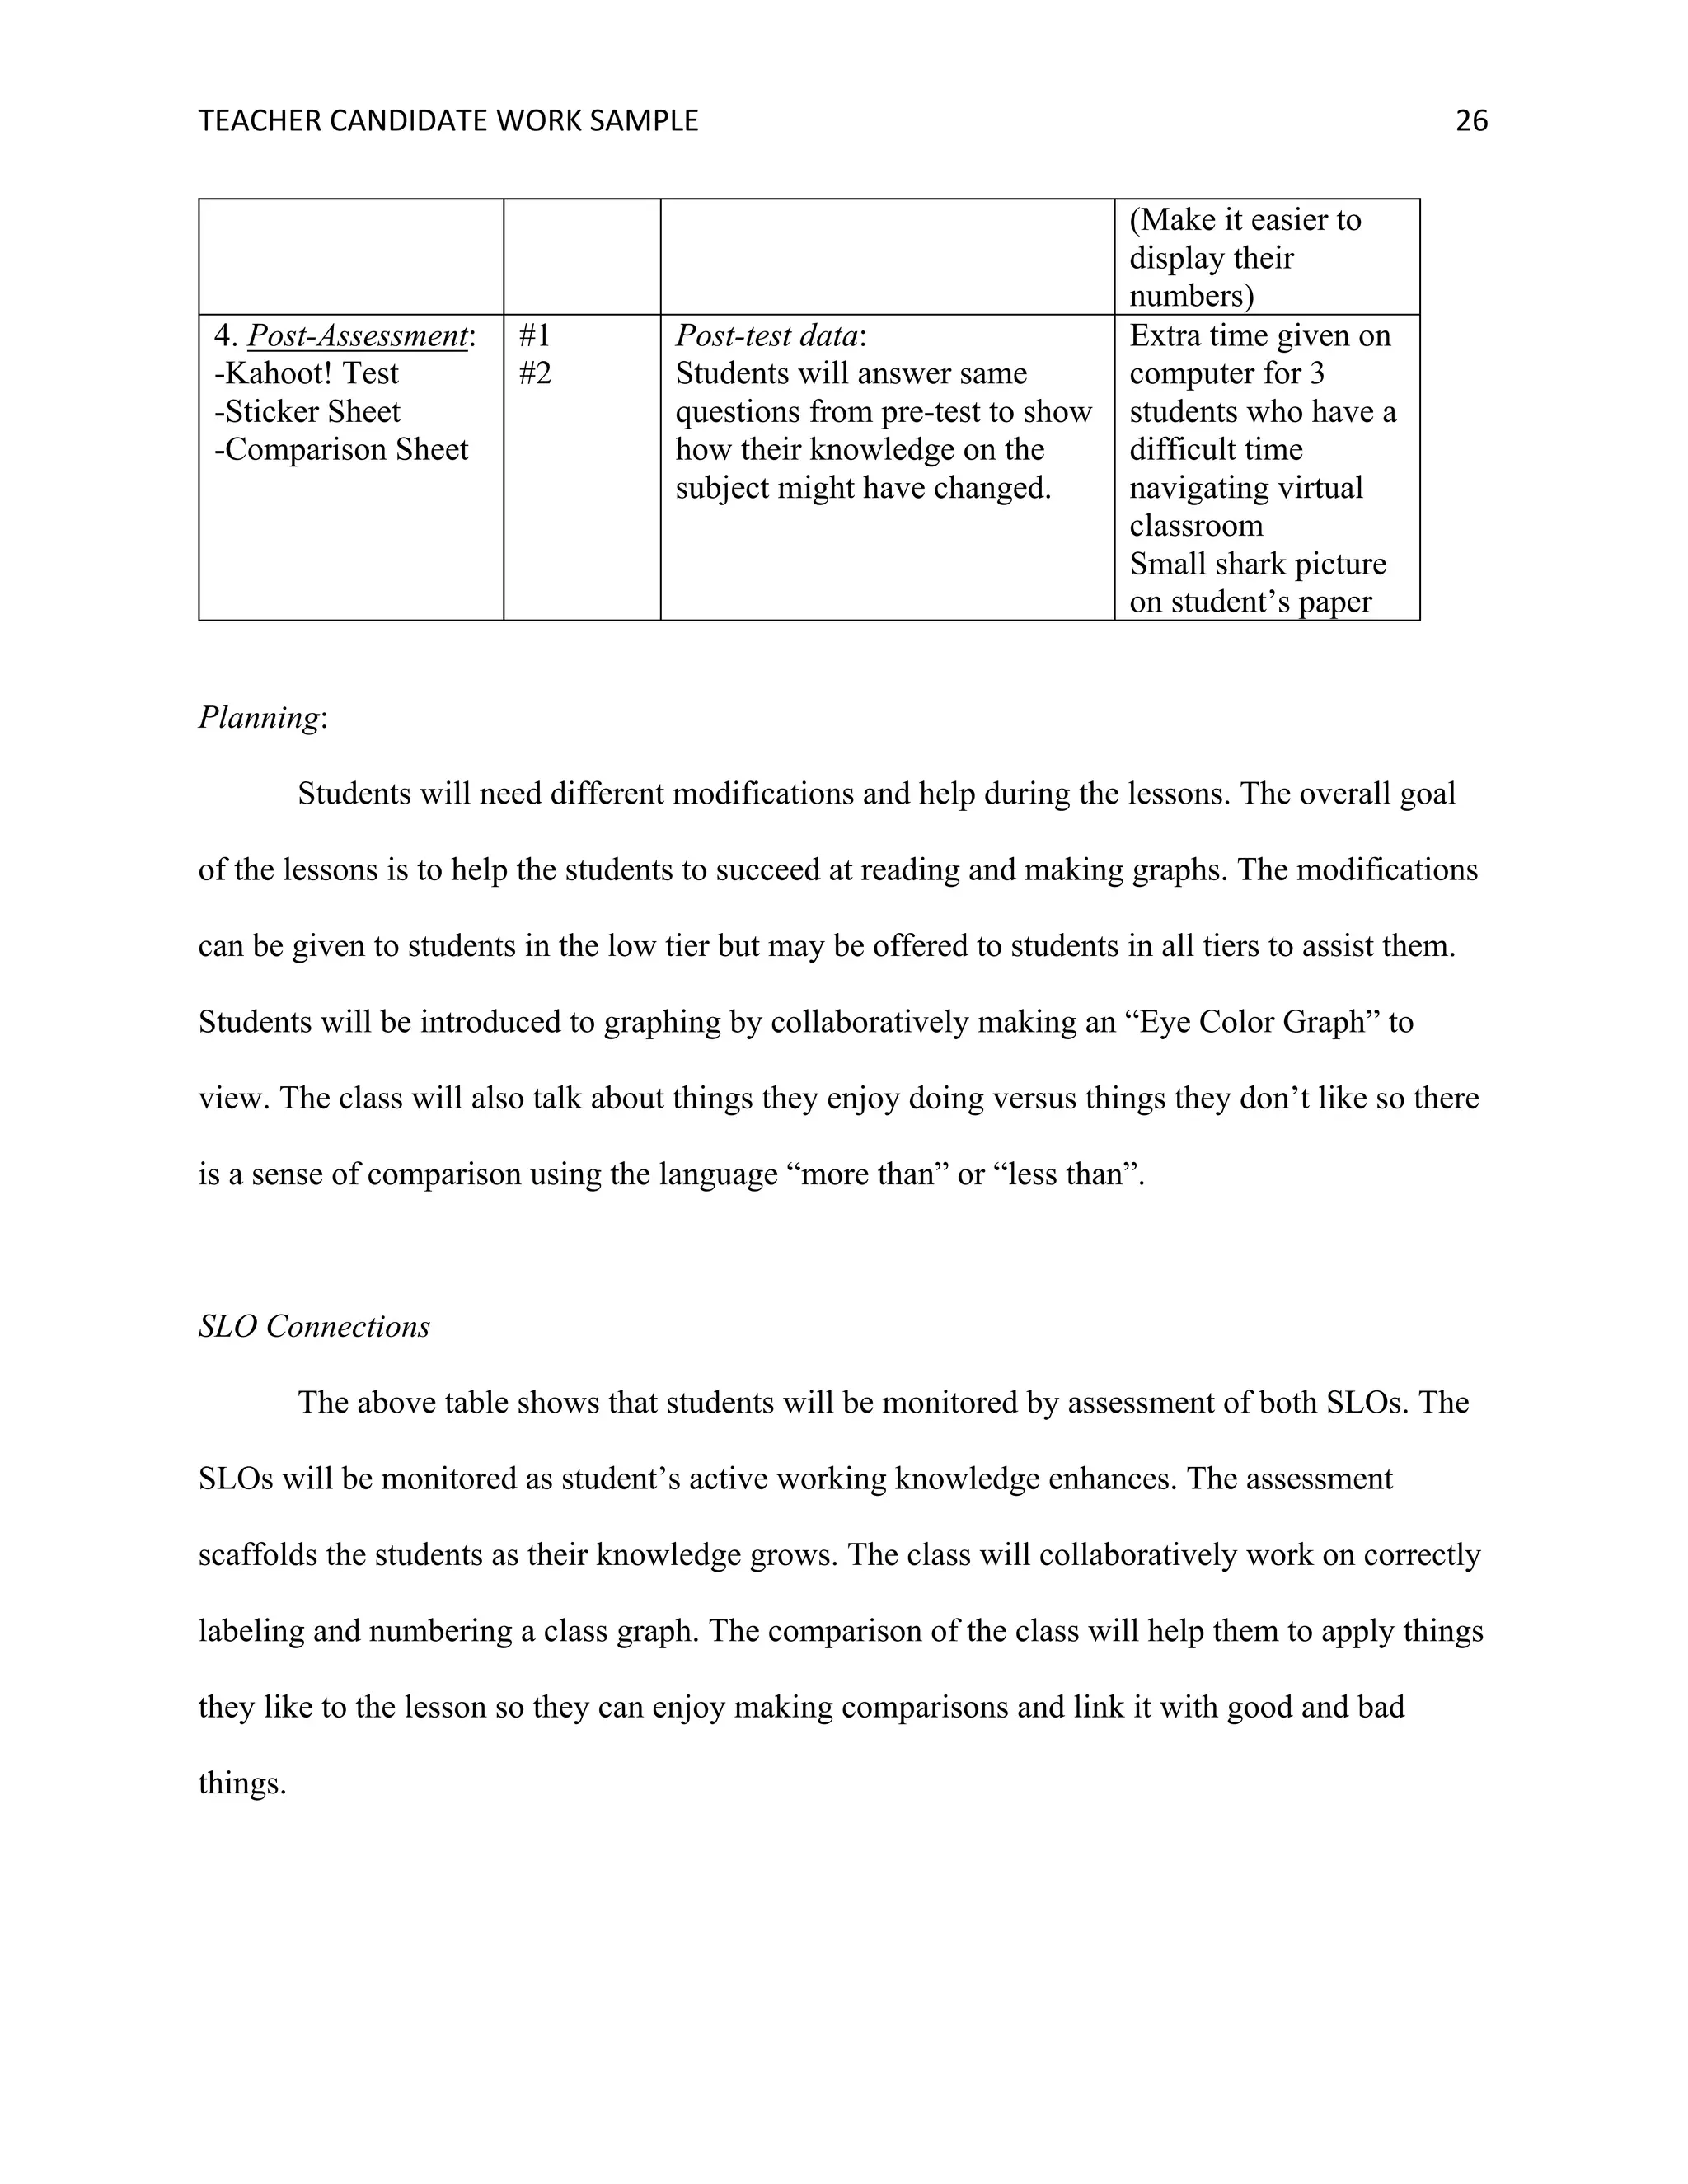
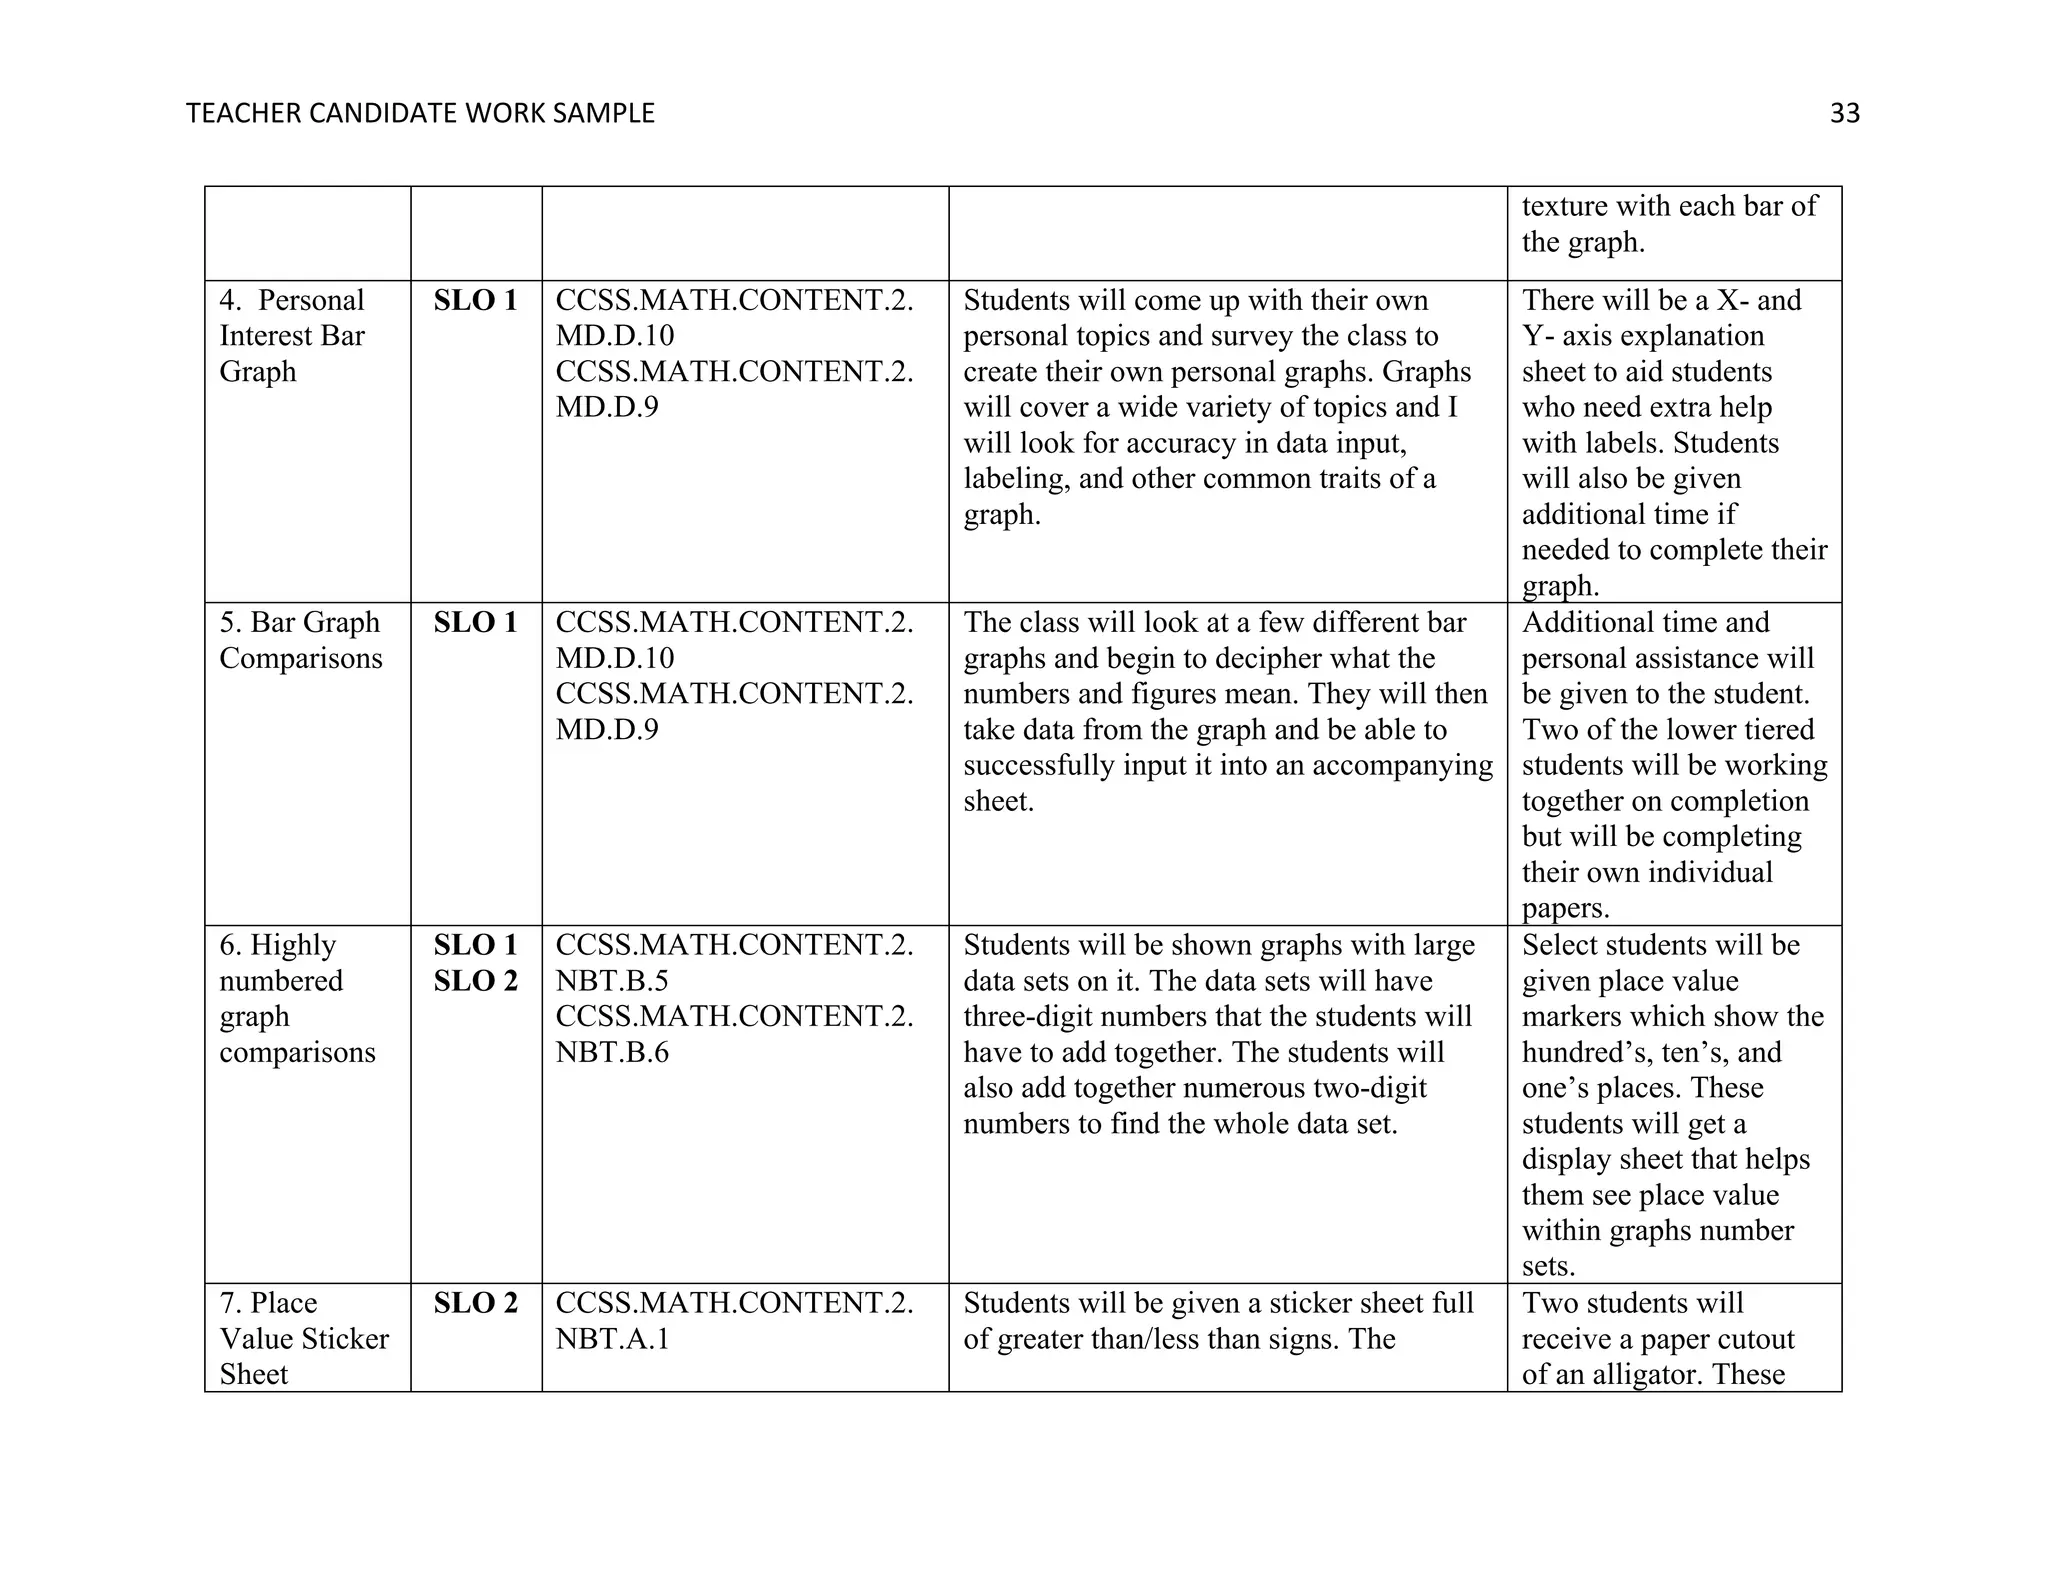
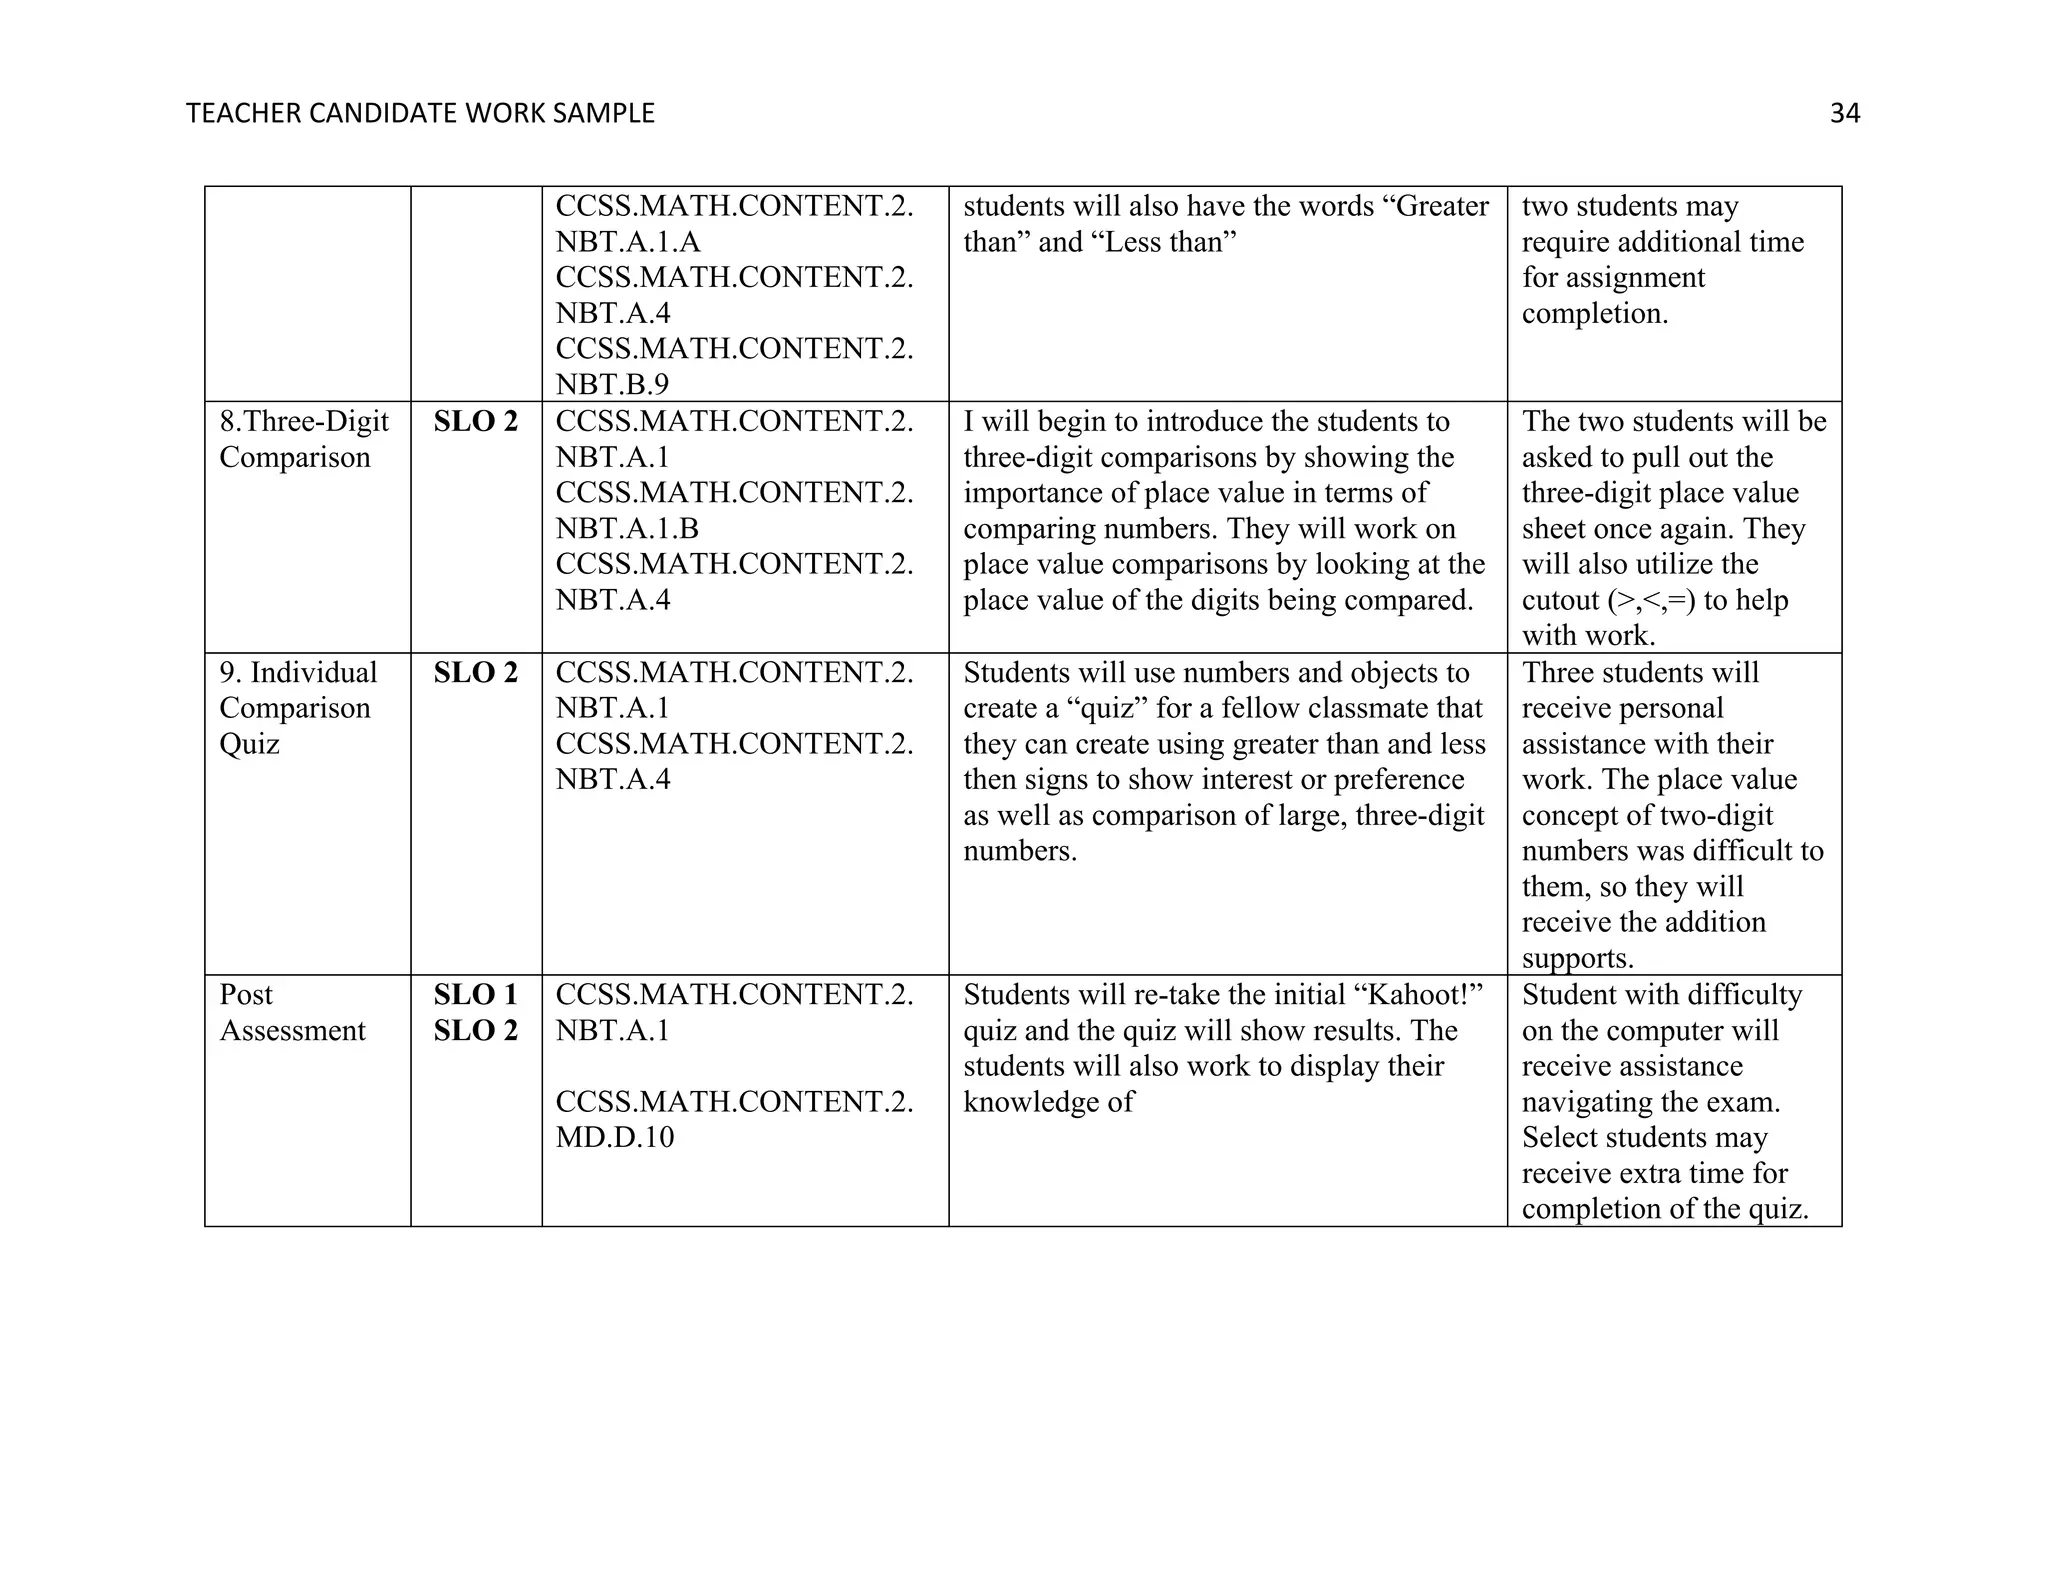
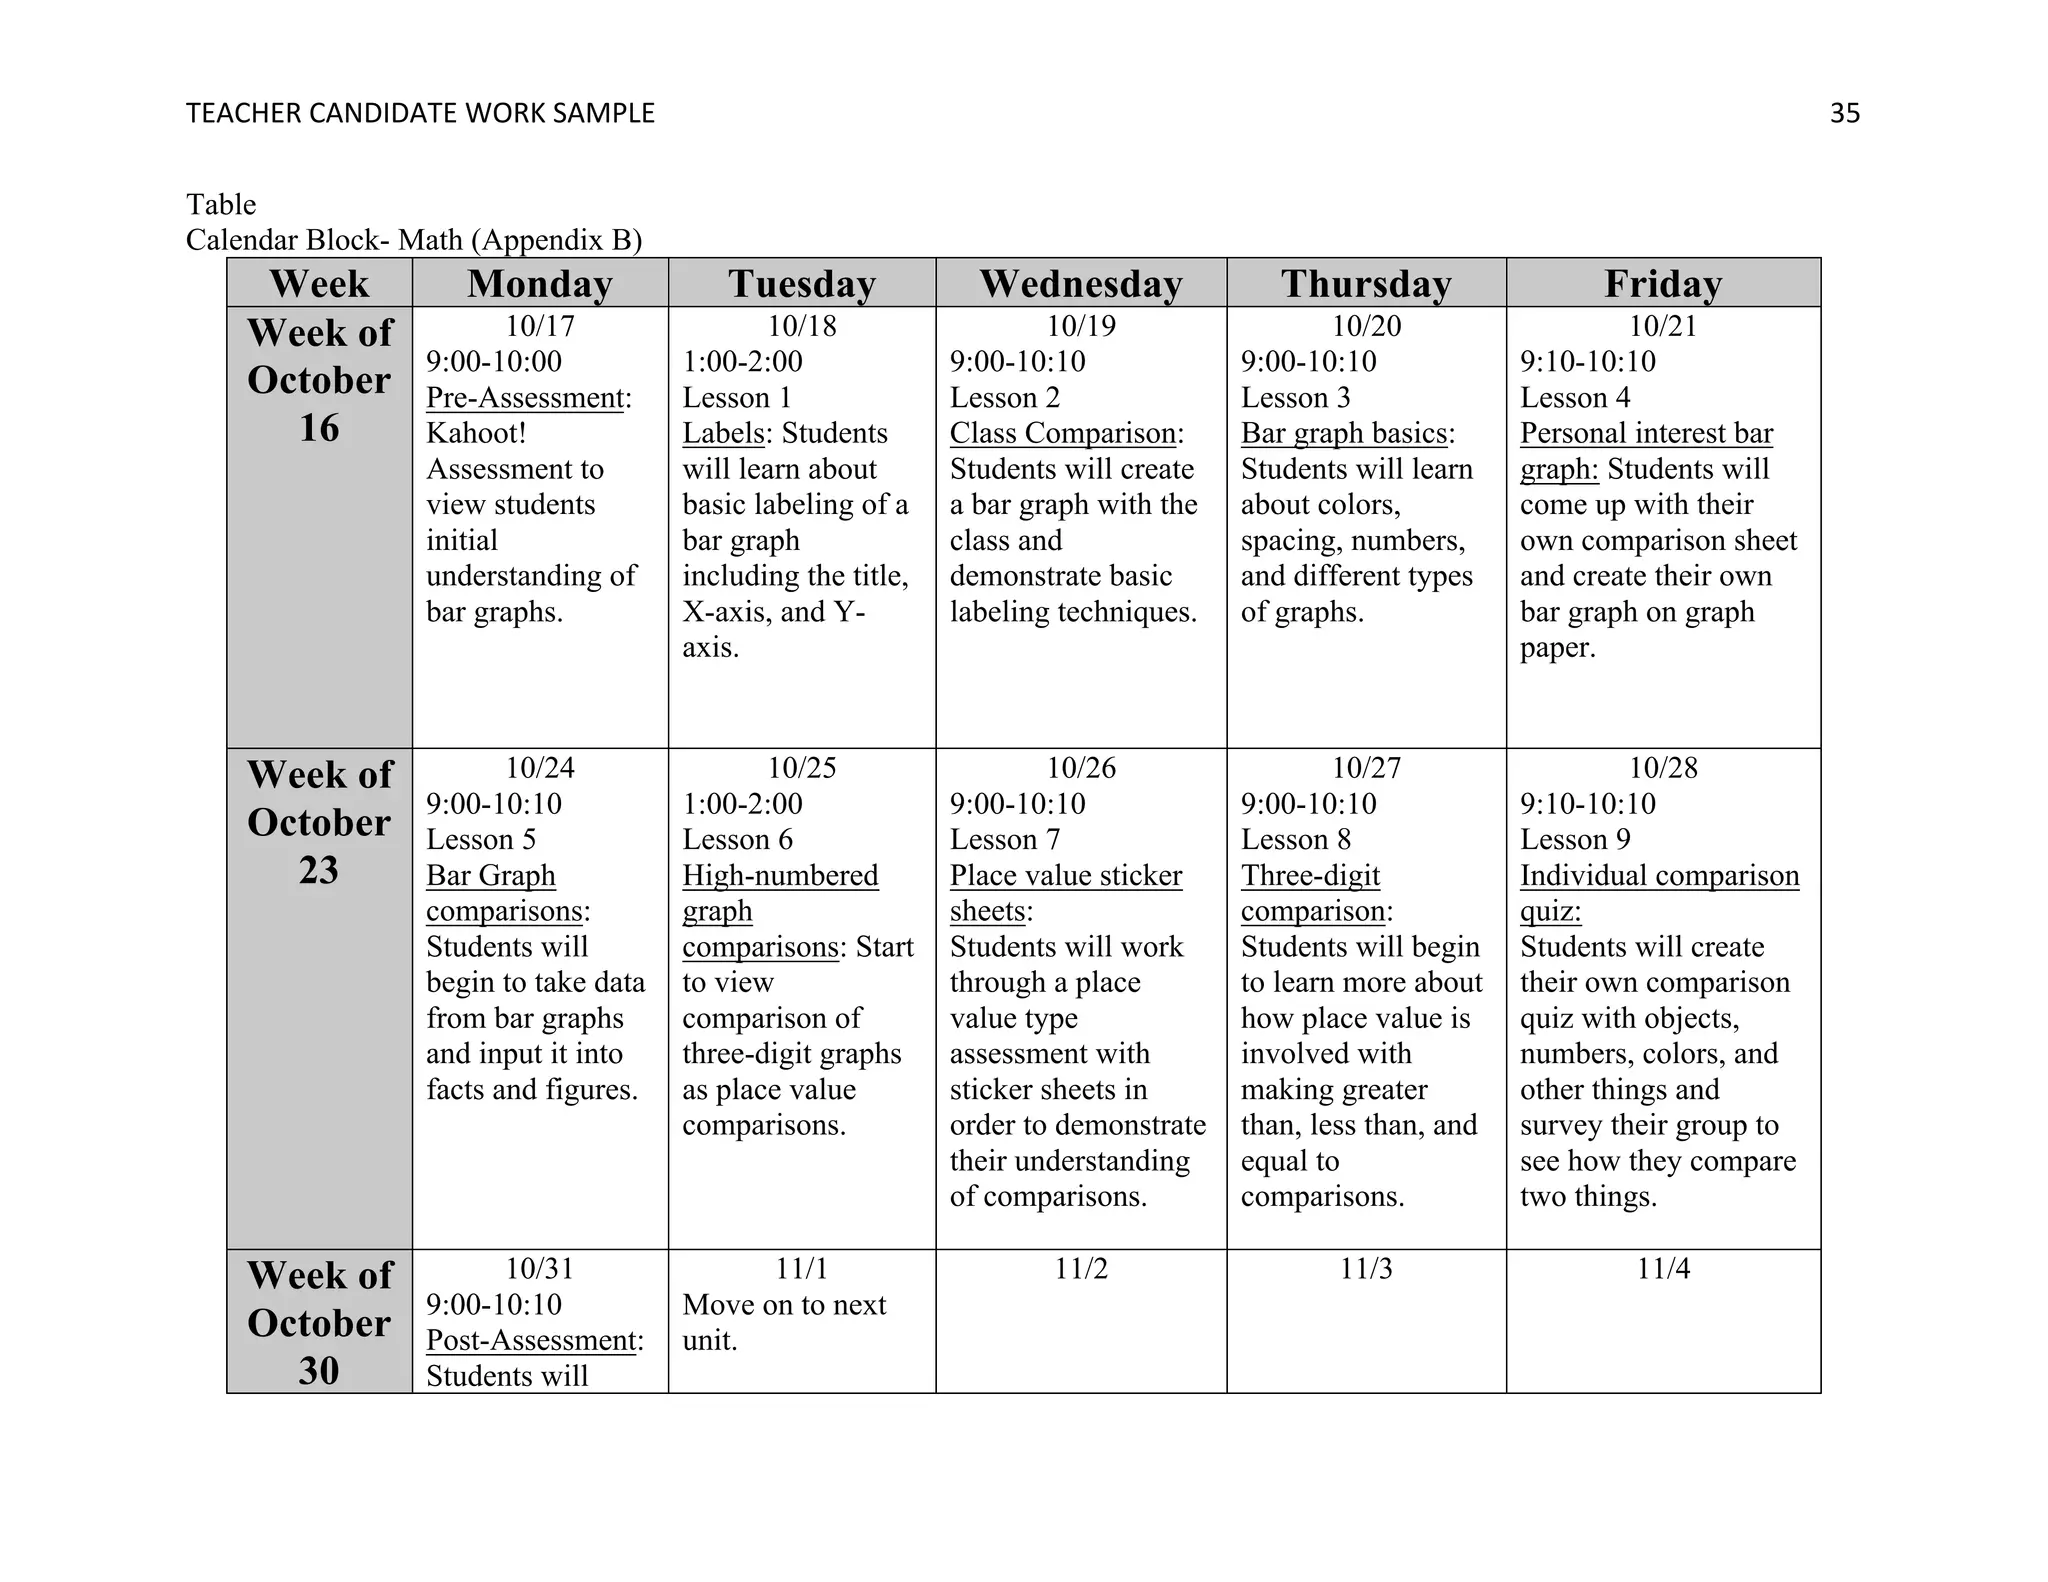
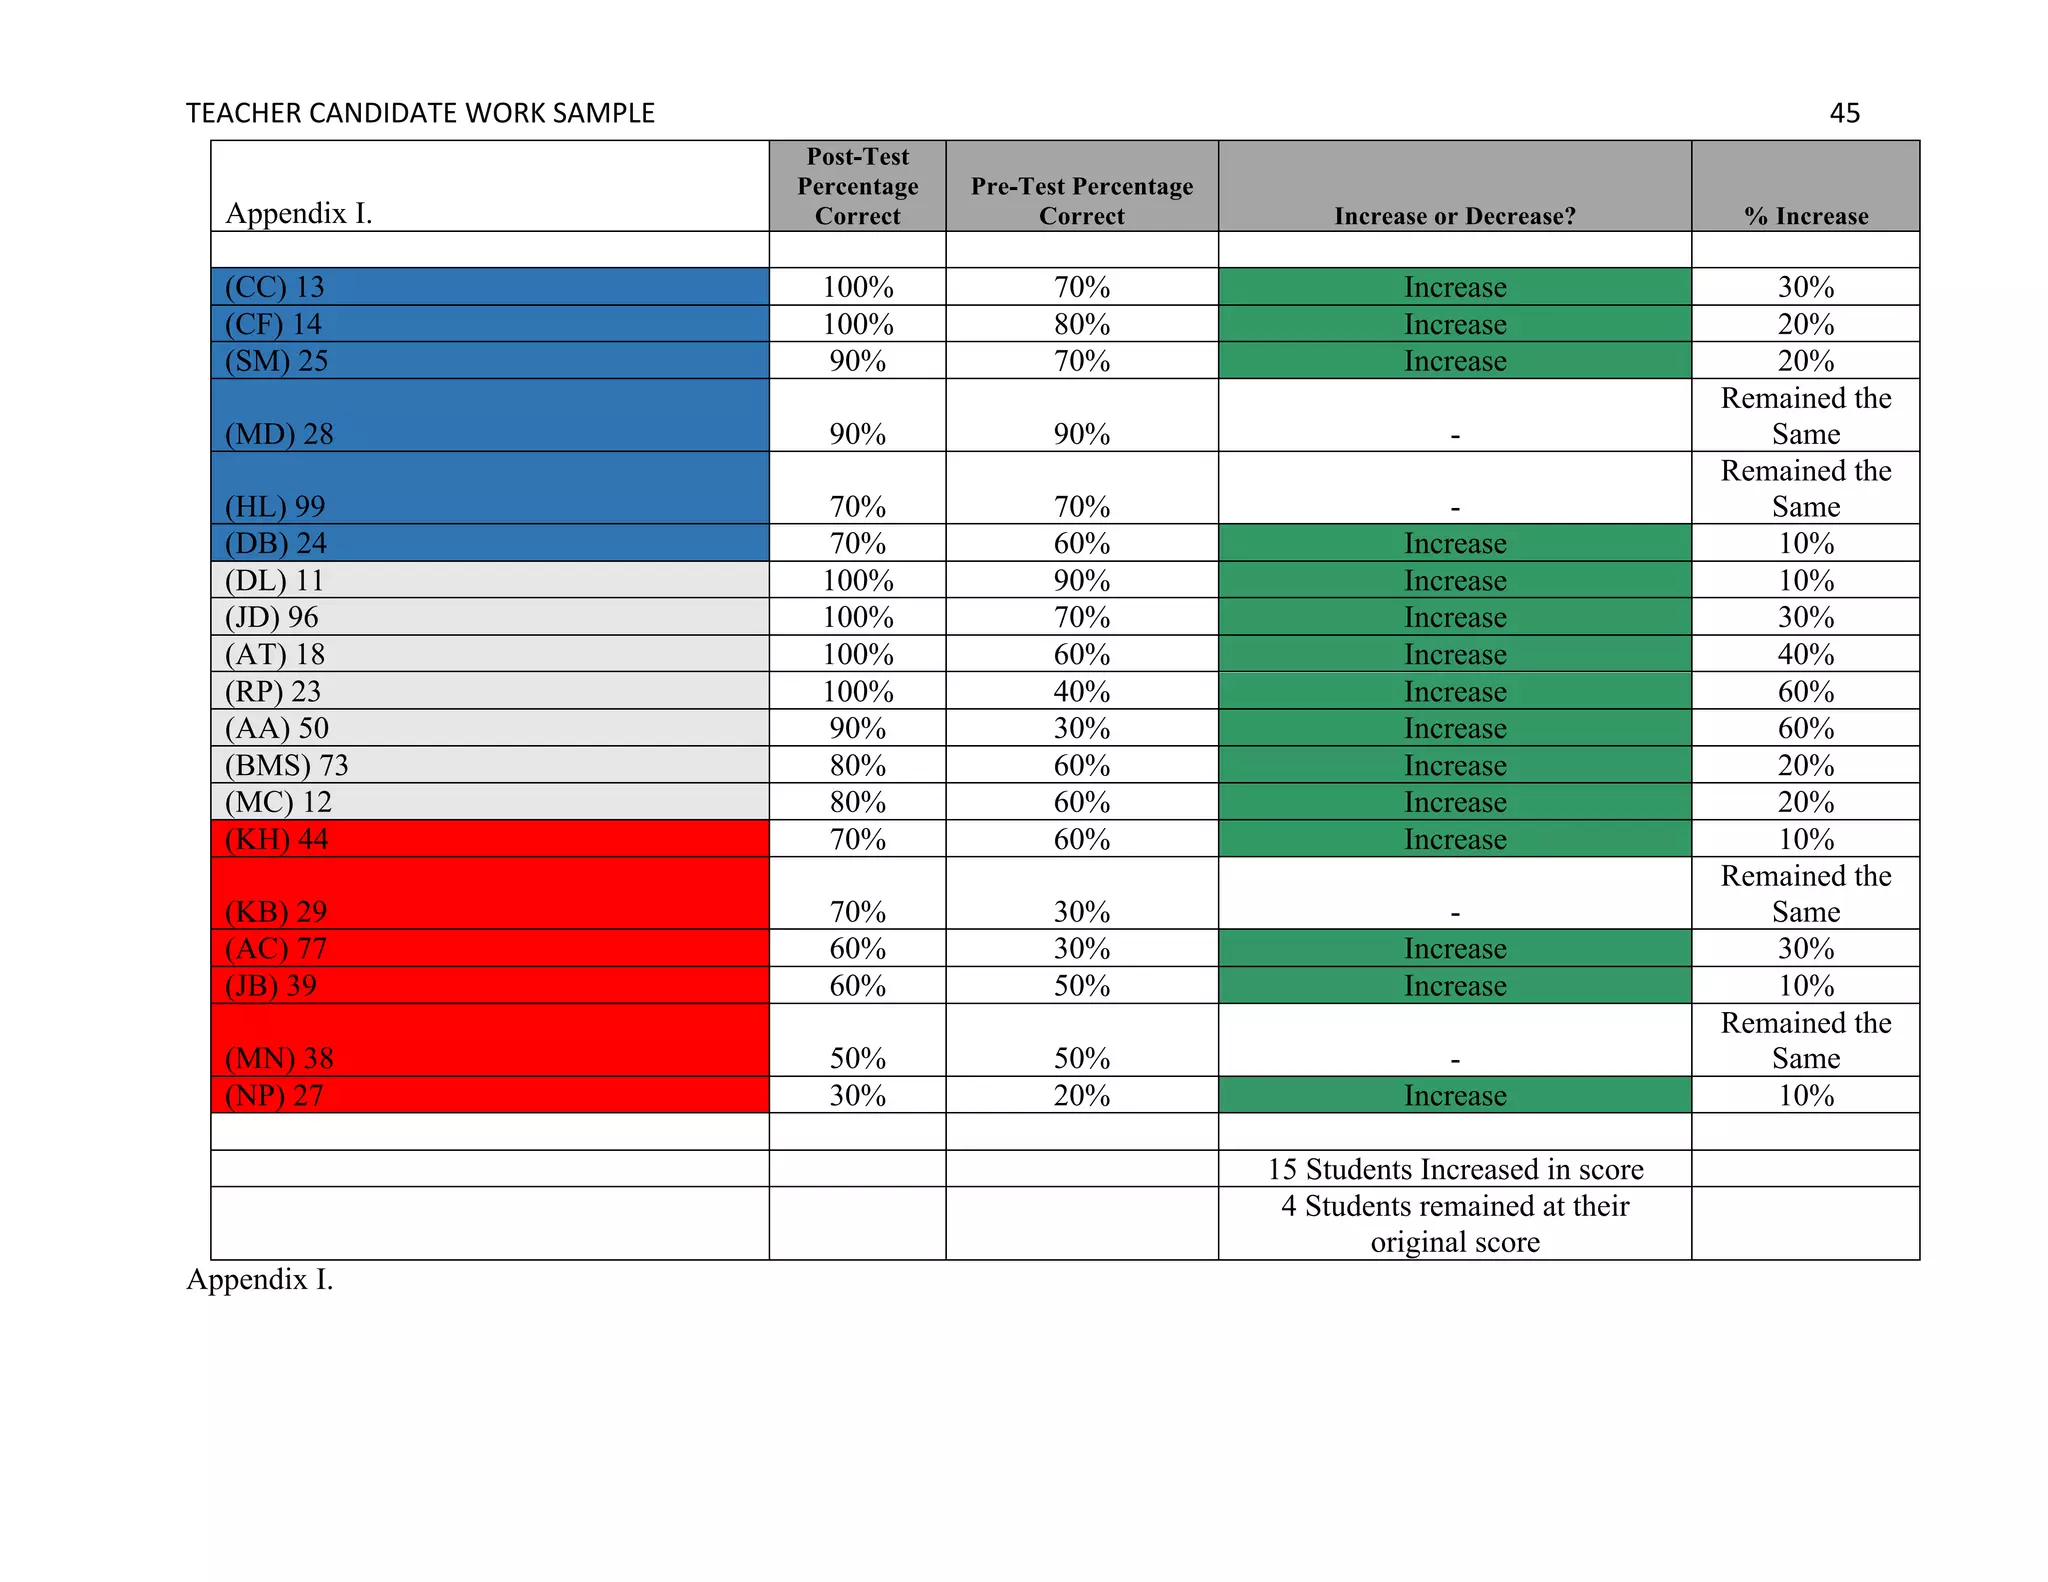
This document provides contextual information about a 2nd grade classroom. It describes the school demographics, including that 21% of students qualify for subsidized lunch. The classroom has 19 students grouped into high, medium, and low tiers based on assessment data. Several students have IEPs or other special needs. Lessons are differentiated based on tiered groups. The school follows Common Core standards and a behavior management system to encourage positive behavior.
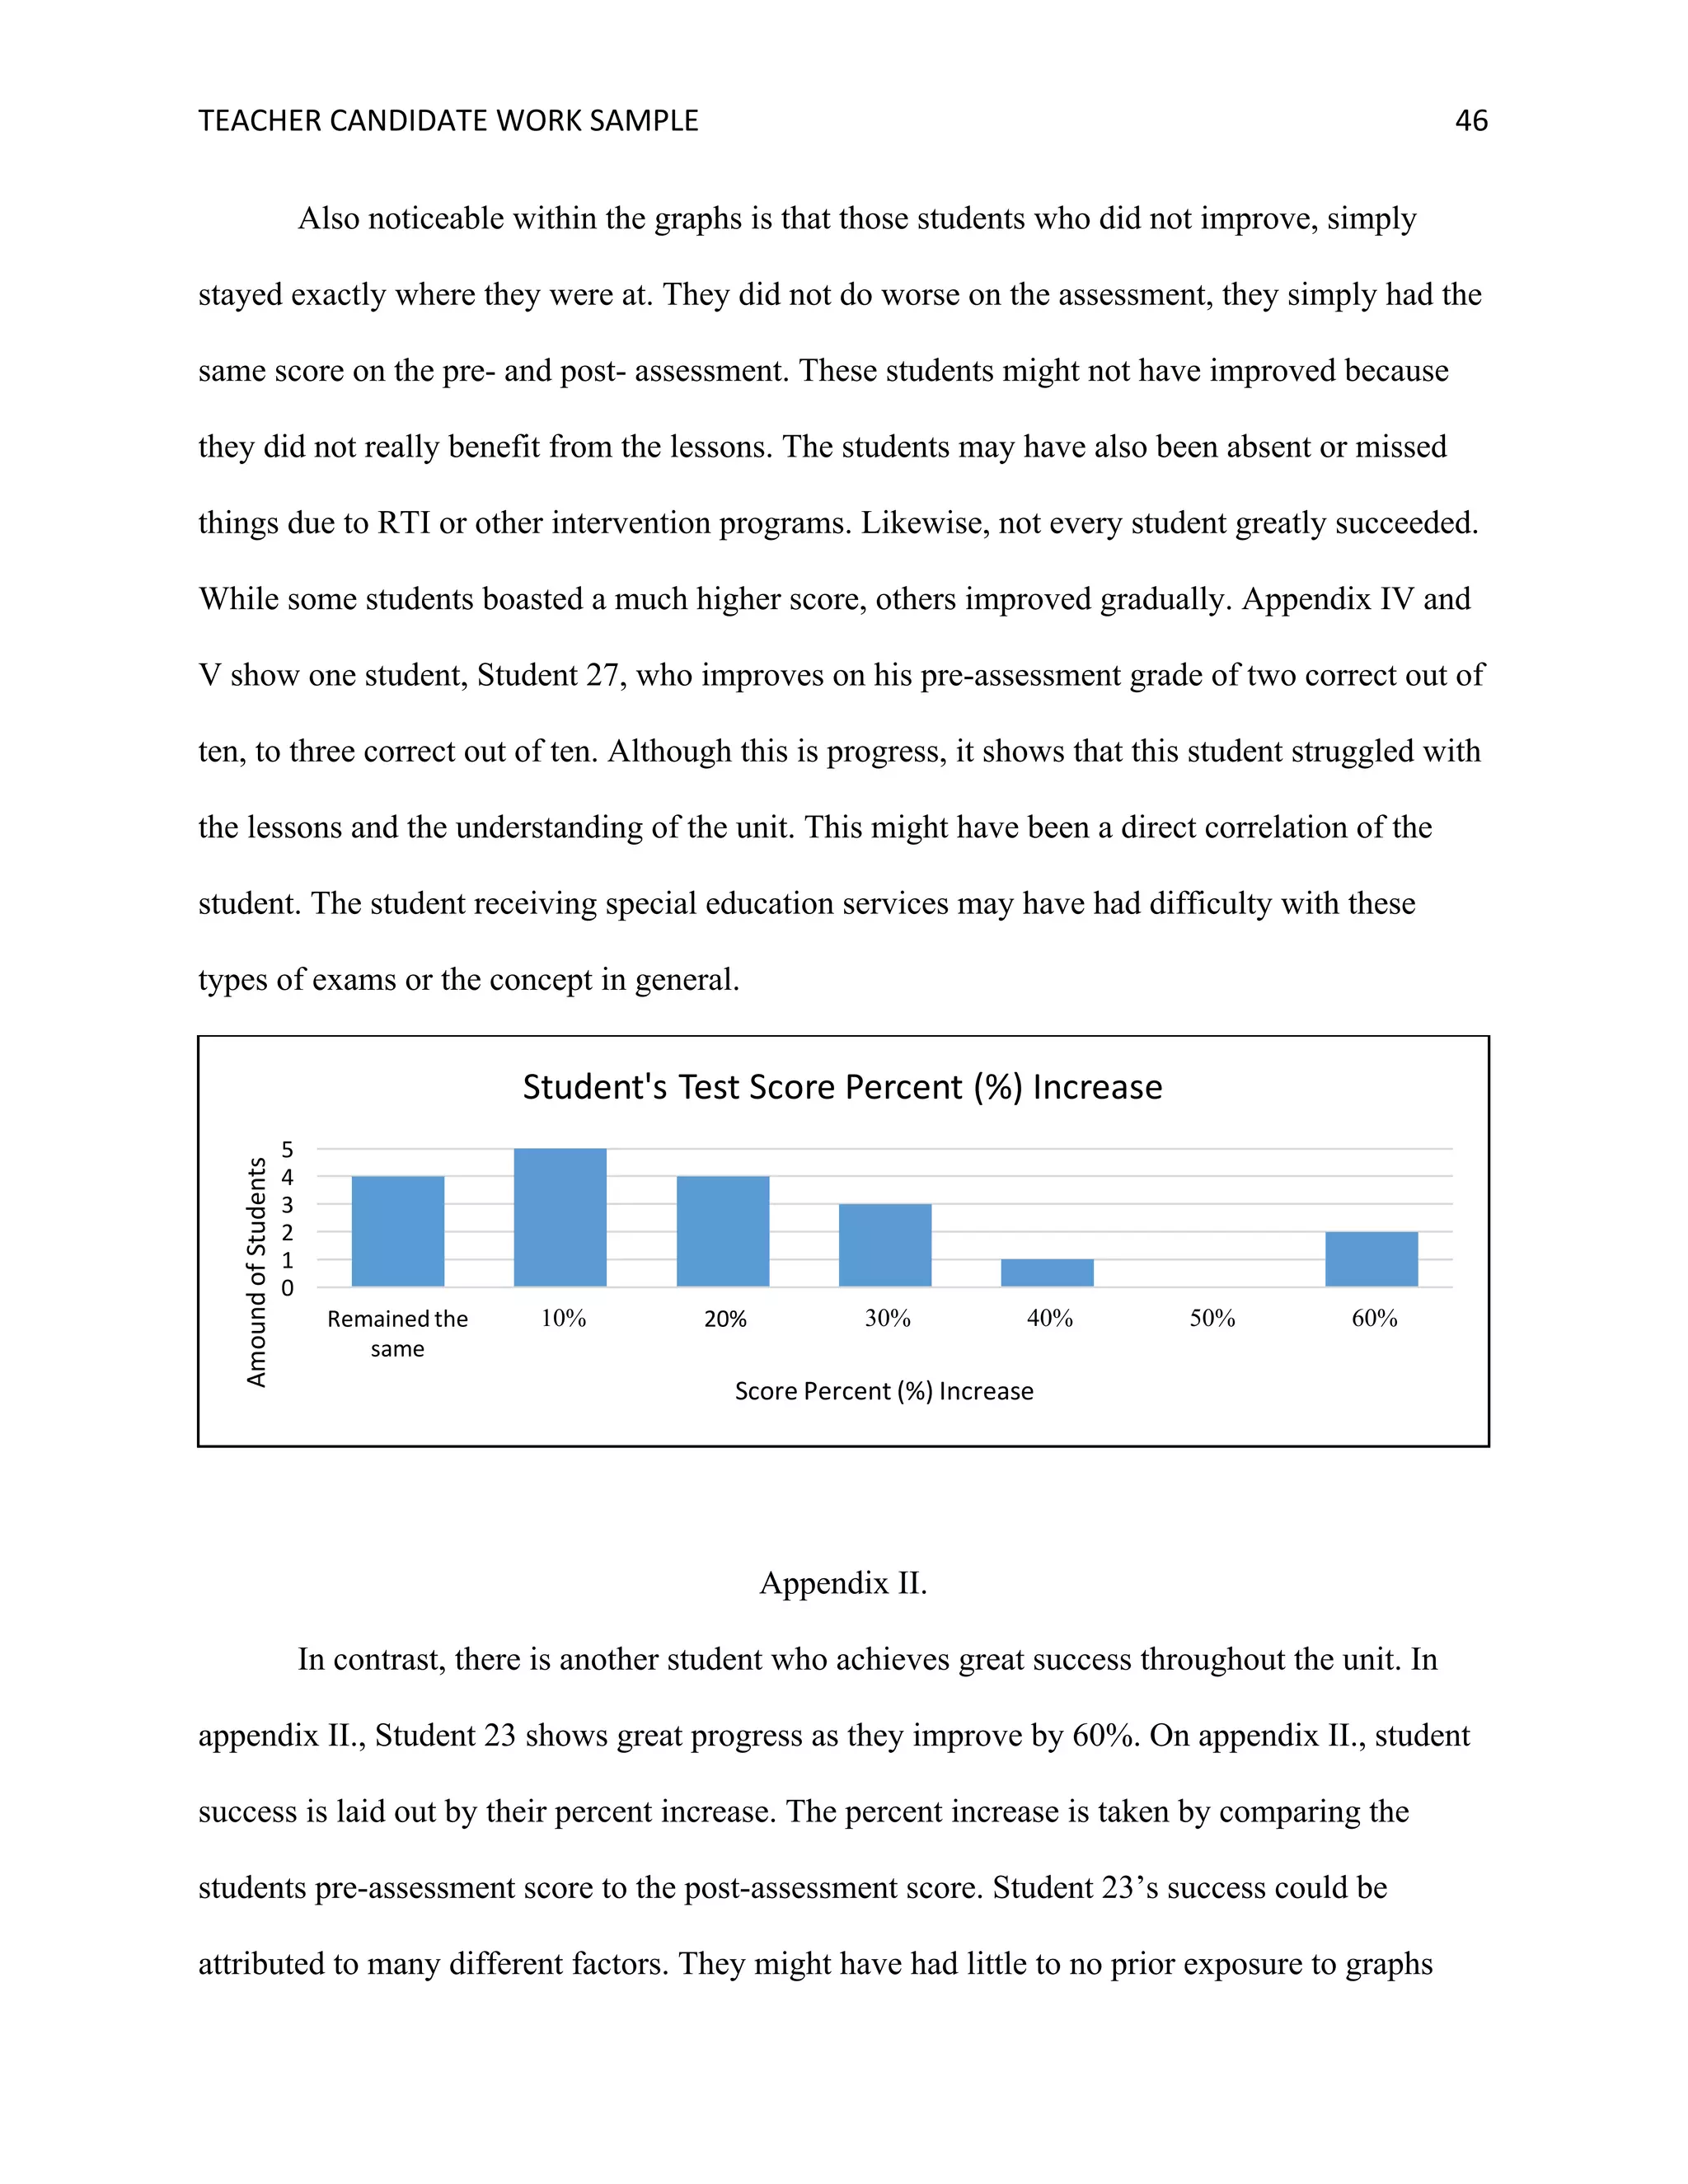


![School Title 1 plan final[1]](https://cdn.slidesharecdn.com/ss_thumbnails/schooltitle1planfinal1-100827170125-phpapp02-thumbnail.jpg?width=640&height=640&fit=bounds)