1. THE NET LEASE MARKET REPORT
Q4 2010
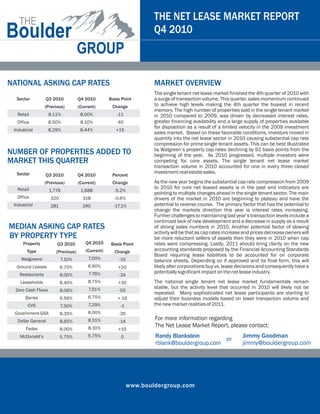
NATIONAL ASKING CAP RATES MARKET OVERVIEW
The single tenant net lease market finished the 4th quarter of 2010 with
Sector Q3 2010 Q4 2010 Basis Point a surge of transaction volume. This quarter, sales momentum continued
(Previous) (Current) Change to achieve high levels making the 4th quarter the busiest in recent
memory. The high number of properties sold in the single tenant market
Retail 8.11% 8.00% -11 in 2010 compared to 2009, was driven by decreased interest rates,
Office 8.50% 8.10% -40 greater financing availability and a large supply of properties available
for disposition as a result of a limited velocity in the 2009 investment
Industrial 8.29% 8.44% +15
sales market. Based on these favorable conditions, investors moved in
quantity into the net lease sector in 2010 causing substantial cap rate
compression for prime single tenant assets. This can be best illustrated
by Walgreen’s property cap rates declining by 92 basis points from the
NUMBER OF PROPERTIES ADDED TO beginning of the year. As 2010 progressed, multiple investors were
MARKET THIS QUARTER competing for core assets. The single tenant net lease market
transaction volume in 2010 accounted for one in every three closed
Sector investment real estate sales.
Q3 2010 Q4 2010 Percent
(Previous) (Current) Change As the new year begins the substantial cap rate compression from 2009
Retail to 2010 for core net leased assets is in the past and indicators are
1,776 1,688 -5.2%
pointing to multiple changes ahead in the single tenant sector. The main
Office 320 318 -0.6% drivers of the market in 2010 are beginning to plateau and have the
Industrial 281 240 -17.1% potential to reverse course. The primary factor that has the potential to
change the markets direction this year is interest rates increasing.
Further challenges to maintaining last year’s transaction levels include a
continued lack of new development and a decrease in supply as a result
MEDIAN ASKING CAP RATES of strong sales numbers in 2010. Another potential factor of slowing
activity will be that as cap rates increase and prices decrease owners will
BY PROPERTY TYPE be more reluctant sellers of assets then they were in 2010 when cap
Property Q3 2010 Q4 2010 Basis Point rates were compressing. Lastly, 2011 should bring clarity on the new
Type (Previous) (Current) Change accounting standards proposed by the Financial Accounting Standards
Board requiring lease liabilities to be accounted for on corporate
Walgreens 7.10% 7.00% -10 balance sheets. Depending on if approved and its final form, this will
Ground Leases 6.70% 6.90% +20 likely alter corporations buy vs. lease decisions and consequently have a
Restaurants 7.76% potentially significant impact on the net lease industry.
8.00% -24
Leaseholds 8.40% 8.75% +35 The national single tenant net lease market fundamentals remain
7.51% stable, but the activity level that occurred in 2010 will likely not be
Zero Cash Flows 8.06% -55
repeated. Many sophisticated net lease participants are starting to
Banks 6.56% 6.75% + 19 adjust their business models based on lower transaction volume and
CVS 7.30% 7.29% -1 the new market realities of 2011.
Government-GSA 8.35% 8.00% -35
Dollar General 8.65% 8.51% -14
For more information regarding
Fedex 8.10% The Net Lease Market Report, please contact:
8.00% +10
McDonald’s 5.75% 5.75% 0 Randy Blankstein Jimmy Goodman
or
rblank@bouldergroup.com jimmy@bouldergroup.com
www.bouldergroup.com