Financial Management Questions and Answers
•
0 likes•55 views

This document contains solutions to various financial management assignment questions. It includes calculations to determine the monthly savings required to accumulate $60,000 over 5 years, NPV calculations at different discount rates, computing future values of investments and superannuation, calculating monthly pension amounts, real vs nominal interest rates, effects of changing cash reserve ratios, risk-return tradeoffs of different investments, imputation credits, monthly/annual returns of stocks, standard deviation and beta calculations using CAPM model, and constructing a portfolio with expected return. Formulas and step-by-step workings are provided for all calculations.

Recommended
More Related Content
What's hot
What's hot (20)
Similar to Financial Management Questions and Answers
Similar to Financial Management Questions and Answers (20)
More from Total Assignment Help
More from Total Assignment Help (20)
Recently uploaded
Recently uploaded (20)
Financial Management Questions and Answers
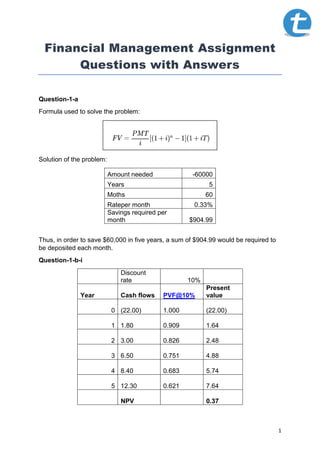
- 1. 1 Financial Management Assignment Questions with Answers Question-1-a Formula used to solve the problem: Solution of the problem: Amount needed -60000 Years 5 Moths 60 Rateper month 0.33% Savings required per month $904.99 Thus, in order to save $60,000 in five years, a sum of $904.99 would be required to be deposited each month. Question-1-b-i Discount rate 10% Year Cash flows PVF@10% Present value 0 (22.00) 1.000 (22.00) 1 1.80 0.909 1.64 2 3.00 0.826 2.48 3 6.50 0.751 4.88 4 8.40 0.683 5.74 5 12.30 0.621 7.64 NPV 0.37
- 2. 2 As the net present value of the project as calculated above in this financial management assignment is $0.37 million. Hence, the NPV is positive therefore the project is acceptable. Question-1-b-ii Yes, the answer would change. Now, the increase in discount rate from 10% to 15% leads to negative NPV which implies that the project is not financial worthy. Discount rate 15% Year Cash flows PVF@10% Present value 0 (22.00) 1.000 (22.00) 1 1.80 0.870 1.57 2 3.00 0.756 2.27 3 6.50 0.658 4.27 4 8.40 0.572 4.80 5 12.30 0.497 6.12 NPV (2.97) Question-1-c-i The value of Brant’s financial assets when he retires at age 67 is computed as below: Brant is now 34 years and he retires at 67 so the time period is 33 years Value of portfolio after 33 years: C0 = 47,000 (present value of portfolio) R = 7% N = 33 years = 47,000*(1+7%)^33 = 47,000*9.325 = 438,275
- 3. 3 Value of superannuation after 34 years: Value of superannuation: Present value 78000 Monthly contribution 1000 Time- months 396 Rate-monthly 0.67% Value of superannuation $3,017,140.93 Total value of financial assets of Brant will be $3,893,706 ($438,275+$3,017,140) Question-1-c-ii The calculation of monthly pension amount for Brant is given as below: Where, R = rate of investment (5% pa or 0.42% monthly) PVA = present value of annuity ($3,893,706-120,000 set aside = 3,773,706) N = time period (18 years, counted from 67 to 85, or 216 months) Monthly pension annuity: Total amount available $3,773,706.00 Time- months 216 rate-monthly 0.42% Annuity $26,530.43 Question-2-a-1 The bank quotes 4% interest rate for the loan. This is the nominal interest rate not yet adjusted for the effects of inflation.
- 4. 4 Question-2-a-2 The real interest rate identifies in this financial management assignment signifies that rate of interest which has been adjusted for the effect of inflation on the other hand; the notional interest rate is the rate that has not been adjusted for inflation effect. Thus, the real interest shows the actual earnings of the banker in the form of interest income received on the extended loan facility (McAndrews, 2015). Question-2-a-3 The annual inflation rate in Australia is 1.60%. Notional rate of interest is 4% Real interest rate will be = 4%-1.60% = 3.40% p.a. Question-2-a-4 Yes, it is possible that the real interest rate becomes equal to the notional interest rate. This situation can arise only when the inflation is zero in the economy. Question-2-b The cash reserve ratio is the regulatory requirement that all banks and financers being regulated by the Reserves Bank of Australia must comply with. The Reserve Bank of Australia uses the cash reserve ratio as the tool of monetary policy. When the reserve ratio is increased, the bankers or financers would have to maintain more reserve funds and hence it reduces their liquidity. On the other hand, when the RBA reduces the cash reserve ratio, this increases the liquidity of the banks and financiers. The increase in liquidity gives more power to the banks to lend money and thus, it also affects the loan interest rates. The loan interest rates could be lowered down by the bankers which ultimately provide benefits to the borrowers. Hence, if RBA reduces the cash reserve rate by 0.25%, it will increase availability of funds in the hands of the banks. Now, the supply of money would increase which would result in reduction in the cost of borrowing for the borrowers (Becker, Fang, & Wang, 2016). Question-3-a-i Due to less risk-taking capacity, Bradley is considering investing in Bank guaranteed investment which provides return of 1%. The marginal tax rate applied on the income of Bradley is 32.5% and additional 2% medicare levy is also applied. The prevailing inflation is 2.5%. Thus, it can be seen in this financial management assignment that the rate of inflation is higher than the after tax return that Bradley would receive from the investment in bank guaranteed investment. Supporting computations are shown as below:
- 5. 5 Amount invested (assumed) 100,000.00 Return @1% 1,000.00 Less: Tax @ 32.5% 325.00 Less: Medicare levy @2% 20.00 Return after tax 655.00 Dollar value of investment after 1 year (100000/(1+2.5%) 97,560.98 Diminution in the value (100000- 97560.98) 2,439.02 The after tax return on the investment is only $655 whereas the diminution in the value of investment amount over the period of 1 year is $2,439.02. Thus, it is clearly seen that Bradley is not able to preserve the dollar value of its investment. Question-3-a-ii Every investment involves risk. Some may involve lower risk and some may be with higher risk. The return and risk run in parallel. If the investor wants higher returns, it would come with only higher risk. Therefore, there forms a simple principle that higher the risk, higher would be the returns or vice a versa. It is essential for Bradley to understand that taking high risk is not always a bad strategy because it would land to high returns at the same time. The biggest advantage of taking high risk in investing is that the investor can widen the range of profits. The low risk investments narrow down the profit range would result in shrinkage in net returns from the investment (Chari, David, Duru, & Zhao, 2019). Question-3-b Imputation credit (franking credit) discussed in this Financial Management assignment means the credit given to the shareholders on the part of the taxes paid by the company on profits so that the dividends distributed by the company could be saved from double taxation. The profits earned by the company are taxed in the hands of the company and then it distributes dividend to the shareholders which is again taxed in the hands of the investor. Therefore, in order to provide relief to the investor, the dividend imputation credit system was brought into force. Now, the investor receiving dividend could claim credit of the taxes paid by the company and reduce their overall tax liability (Dixon & Nassios, 2016). The investors of Australia would receive fully franked dividend which entitles the investor to take credit of the taxes already paid by the company on the amount of dividend declared. However, a foreign investor would not be able to utilize the
- 6. 6 franking credit and hence the tax liability in that case would be higher as compared to the local Australian investor. Question-3-c-i Date Open Close Monthly Holding period returns ($) Monthly Holding period returns (%) Jul-17 3.79 4.14 Aug-17 4.15 5.04 0.90 21.74% Sep-17 5.10 5.86 0.82 16.27% Oct-17 5.92 7.62 1.76 30.03% Nov-17 7.34 7.59 (0.03) -0.39% Dec-17 7.60 7.37 (0.22) -2.90% Jan-18 7.40 8.29 0.92 12.48% Feb-18 8.32 12.23 3.94 47.53% Mar-18 12.21 11.46 (0.77) -6.30% Apr-18 10.96 11.31 (0.15) -1.31% May-18 11.36 9.93 (1.38) -12.20% Jun-18 9.70 10.52 0.59 5.94% Question-3-c-ii Average Monthly Holding period returns (%): Average = (21.74%+16.27%+30.03%+-0.39%+- 2.90%+12.48%+47.53%+-6.30%+-1.31%+- 12.20%+5.94%)/ 11 = 10.08%
- 7. 7 Question-3-c-iii Annual holding period return $ 6.38 (10.52-4.14) % 154.11% (10.52- 4.14)/4.14 Question-3-d-i The calculation for monthly holding period return is shown as below: (Dividend + (latest price – previous price)) / Previous price) * 100 Date Open Close Monthly Holding period returns (%) Jul-17 5,764.00 5,773.90 Aug-17 5,773.90 5,776.30 0.04% Sep-17 5,776.30 5,744.90 -0.54% Oct-17 5,744.90 5,976.40 4.03% Nov-17 5,976.40 6,057.20 1.35% Dec-17 6,057.20 6,167.30 1.82% Jan-18 6,167.30 6,146.50 -0.34% Feb-18 6,146.50 6,117.30 -0.48% Mar-18 6,117.30 5,868.90 -4.06% Apr-18 5,868.90 6,071.60 3.45% May-18 6,071.60 6,123.50 0.85% Jun-18 6,123.50 6,289.70 2.71%
- 8. 8 Question-3-d-ii Average of monthly holding period returns is given as below: = (0.04%+-0.54%+4.03%+1.35%+1.82%+-0.34%+-0.48%+- 4.60%+3.45%+0.85%+2.71%)/ 11 = 0.80% Question-3-d-iii iii) Annual holding period return % 8.93% (6289.70- 5773.90)/5773.90 Question-3-d-iv Line graph showing monthly returns of A2M and MKT is presented as below: Figure 1: Monthly Returns of A2M and MKT
- 9. 9 Question-3-d-v The calculation of standard deviation (risk) for A2M and MKT is given below in this Financial Management assignment: Standard deviation (A2M) X x- (x- )^2 Aug-17 21.74% 11.66% 1.36% Sep-17 16.27% 6.19% 0.38% Oct-17 30.03% 19.95% 3.98% Nov-17 -0.39% -10.48% 1.10% Dec-17 -2.90% -12.98% 1.68% Jan-18 12.48% 2.40% 0.06% Feb-18 47.53% 37.45% 14.02% Mar-18 -6.30% -16.38% 2.68% Apr-18 -1.31% -11.39% 1.30% May-18 -12.20% -22.28% 4.97% Jun-18 5.94% -4.14% 0.17% 10.08% Total 31.70% 17.80%
- 10. 10 Standard deviation (MKT) X x- (x- )^2 Aug-17 0.04% -0.76% 0.01% Sep-17 -0.54% -1.35% 0.02% Oct-17 4.03% 3.23% 0.10% Nov-17 1.35% 0.55% 0.00% Dec-17 1.82% 1.01% 0.01% Jan-18 -0.34% -1.14% 0.01% Feb-18 -0.48% -1.28% 0.02% Mar-18 -4.06% -4.86% 0.24% Apr-18 3.45% 2.65% 0.07% May-18 0.85% 0.05% 0.00% Jun-18 2.71% 1.91% 0.04% 0.80% Total 0.51% 2.27% Question-3-d-vi The beta value of A2M is 1.04 times which reflect the sensitivity of the stock relative to the overall market. Beta is also known as the measure of systematic risk. The interpretation of beta value is given in terms of times. For instance, A2M has beta of 1.04 times which implies that if market moves up side by 10%, the stock of A2M will move up side by 10.40% and if market goes down by 10%, the stock of A2M will be down by 10.40%. The higher the beta of the stock higher will be the risk and vice a versa. Beta value of 1.04 indicates that the A2M is moderately risky stock (Bollerslev, Li, & Todorov, 2016).
- 11. 11 Question-3-d-vii The calculation of expected return of A2M applying the CAPM model is given as below: Where, Ra = Expected return Rrf = Risk free rate Ba = Beta value of stock Rm = Market return Market return 9.55% Risk free rate 2.29% Beta 1.04 CAPM [2.29%+(9.55%- 2.29%)*1.04] 9.84% Question-3-d-viii The SML chart for A2M is given below: Figure 2: SML A2M
- 12. 12 Question-3-d-ix The recreated chart with actual returns of A2M and MKT is presented as below: Figure 3: SML chart Question-3-d-x The portfolio using 40% and 60% weights of A2M and MKT respectively is given as below: Construct portfolio A2M MKT Weight 40% 60% Return 10.08% 0.80% Beta 1.04 1 Expected return of the portfolio is the weighted average return of the securities comprising of the portfolio (Bollerslev, Li, & Todorov, 2016): = 10.08%*40%+0.80%*60% = 4.52% The portfolio beta is the weighted average beta of the securities comprising of the portfolio: = 1.04*40%+1*60% = 1.02