1. SPATIAL ANALYSIS OF LEAD LEVELS IN CHILDREN, ALABAMA
Dwight Tigner, Jessica Williams, and Dawn Lemke
Department of Biological and Environmental Science, Alabama A&M University, contact: dawn.lemke@aamu.edu
Introduction
The water systems in Flint, Michigan have identified high levels of lead
throughout the water systems in communities of predominately
African-American neighborhoods. The recent discovery has been
devastating for the image of the state of Michigan and has spark
concerns for other cities in the United States. In doing so, researchers
have speculated even higher levels of lead may be found in
communities in Alabama. According to Center of Disease Control
(CDC), Houston and Dallas counties have high proportion of children
with unacceptable lead levels, these are rural, predominantly African-
American communities. The Alabama Department of Public Health
identified over 24,000 cases of children with unacceptable levels of
lead in their blood between the last 5 years. The focus of this research is
to identify if there are any hot spots of excessive lead levels in Alabama
and if there is any relationship with socioeconomic data. Data has been
tabulated and analyze in excel sheets using comparisons of zip codes.
Then, the data will be imported into ArcGIS for spatial analysis and
integration with census data.
Methods
• Analyzed 2011-2014 data tabulations excel sheets from Center of
Disease Control and Alabama Department of Health
• Used excel sheets containing zip code files and exported them into
an ArcGIS (v.10.x) map displaying Lead cases across the state
• Conducted a case study to what may be causing lead exposure to
children by identifying socioeconomic data of counties
Objectives
Locate and identify areas in Alabama that have high levels of lead
cases relating to children
Give a breakdown of racial demographics of affected due to lead
exposure.
Preliminary Results and Discussion
• The research shows high percentages of poverty rates along with high
numbers of lead exposures of children .
• High levels of lead exposure took place mostly in the southern region
of Alabama.
• There were no consistently in lead levels across the state of Alabama
• Many counties does not provide or collect data on lead exposure
• Learn that there is no standard protocol for lead poisoning testing
Future Work
Additional socio-economic variables would be used to assess
relationships of lead levels and demographics
The county boundaries in the will be compared lead levels throughout
the state of Alabama
Use of zip code data to correlate with lead levels in Alabama.
Acknowledgements
This work is funded through USDA-NIFA Capacity Building Grant: Geospatial Research
and Education Center (GREC) to strengthen environmental and natural resources
sciences programs - Award # 2013-38821-21130. We would like to thank the students at
GREC who have assisted with field work and methods.
References
1 – "Preventing Lead Poisoning in Young Children: Chapter 2." Centers for Disease Control and
Prevention. Centers for Disease Control and Prevention, 01 Oct. 1991. Web. 11 Apr. 2016.
2 –"Forms for Healthcare Providers." ACLPPP. N.p., n.d. Web. 11 Apr. 2016.
3 -- "American Factfinder." Census American Factfinder. N.p., n.d. Web. 11 Apr. 2016.
4 – Geographic Information Systems ArcMap, ESRI.
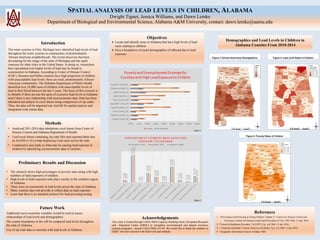
Figure 3: African Americans Demographics
Figure 1
Figure 2
Figure 4: Lead Level Rates of Children
Figure 5: Poverty Rates of Children
Demographics and Lead Levels in Children in
Alabama Counties From 2010-2014