This document presents information on both sides of the debate around human-caused climate change. It includes definitions of bias and discusses theories that climate change is caused by natural cycles or human activity. The document also summarizes two films with opposing views - An Inconvenient Truth argues climate change is human-caused while The Great Global Warming Swindle argues it is not significantly increased by humans.
Call Girls in Uttam Nagar (delhi) call me [🔝9953056974🔝] escort service 24X7
Carbon CycleThis module uses a variety of sources to educate.docx
1. Carbon Cycle
This module uses a variety of sources to educate you about the
carbon cycle and current theories of climate. In this module,
you will use resources that have opposing views about the
impact of humans on the carbon cycle and global climate.
Of the many, many, different theories about climate change, we
are only presenting a few. Our attempt in this activity is to give
a few examples illustrating the complexity involved in studying
the environment and the impact of bias on scientific research.
A. The carbon cycle is currently in the news as people look for
explanations for changes in climate. This issue provides
excellent examples of bias in the presentation of information.
What is bias in relation to science and reporting? Use any
online dictionary and search for “bias”. Write the definition that
relates to bias in science and reporting.
Answer:
Does being biased necessarily mean that you are wrong?
Yes
No
B. Theories Explaining Climate Change:
Climate fluctuations have long been observed to be cyclical.
Theories explaining the variations include the following:
· Human Cause. Humans are responsible for an increase in
2. greenhouse gases that is causing the Earth to warm up and
change the climate.
· Natural Cycle. The climate changes observed are cyclical and
natural.
· Volcanic Events. Volcanoes cause variations in the ability of
the Earth’s atmosphere to absorb energy.
· Astronomical Cause. The Milankivitch Theory asserts that
climate changes are caused by changes in the tilt of the Earth’s
axis. Changes in some areas are balanced by opposite changes
in other areas.
· Variations if Energy Output from the Sun. Variations in heat
from the sun causes drastic changes in climate.
C. Two movies shown in movie theaters have energized the
“Global Climate Change” controversy. Evaluate the following
movies using the questions on the next page. All information for
this page is contained on the websites linked below. If you
would like to learn more, you may be able to rent the movies.
Movie 1: An Inconvenient Truth
Website: http://www.takepart.com/an-inconvenient-truth Click
the link “The Film” on the top tab and evaluate the reading list
on the right side of the page. Much information was removed
from the original website, however, the RealClimate website
mostly supports the movie and provides a review at
http://www.realclimate.org/index.php/archives/2006/05/al-
gores-movie/.
The website for An Inconvenient Truth has removed the original
science pages and the "Hockey Stick" graphic that was one of
its main graphics. It now links the following information from
its official website at takepart.com:
Purpose Statement. Climate change, also called global warming,
3. refers to the rise in average surface temperatures on Earth.
· An overwhelming scientific consensus maintains that climate
change is due primarily to the human use of fossil fuels, which
releases carbon dioxide and other greenhouse gases into the air.
· The gases trap heat within the atmosphere, which can have a
range of effects on ecosystems, including rising sea levels,
severe weather events, and droughts that render landscapes
more susceptible to wildfires.
Point 1) Is climate change real? There is broad-based agreement
within the scientific community that climate change is real. The
U.S. Environmental Protection Agency, the National
Aeronautics and Space Administration, and the National
Oceanic and Atmospheric Administration concur that climate
change is indeed occurring and is almost certainly due to human
activity.
Point 2) What are the causes of climate change? The primary
cause of climate change is the burning of fossil fuels, such as
oil and coal, which emits greenhouse gases into the
atmosphere—primarily carbon dioxide. Other human activities,
such as agriculture and deforestation, also contribute to the
proliferation of greenhouse gases that cause climate change.
· While some quantities of these gases are a naturally occurring
and critical part of Earth’s temperature control system, the
atmospheric concentration of CO2 did not rise above 300 parts
per million between the advent of human civilization roughly
10,000 years ago and 1900.
· Today it is at about 400 ppm, a level not reached in more than
400,000 years.
Point 3) What are the effects of climate change? Even small
increases in Earth’s temperature caused by climate change can
have severe effects.· The earth’s average temperature has gone
up 1.4° F over the past century and is expected to rise as much
as 11.5° F over the next. That might not seem like a lot, but the
average temperature during the last Ice Age was about 4º F
4. lower than it is today.
· Rising sea levels due to the melting of the polar ice caps
(again, caused by climate change) contribute to greater storm
damage.
· Warming ocean temperatures are associated with stronger and
more frequent storms; additional rainfall, particularly during
severe weather events, leads to flooding and other damage.
· An increase in the incidence and severity of wildfires
threatens habitats, homes, and lives; and heat waves contribute
to human deaths and other consequences.
Point 4) Climate change: the debate While consensus among
nearly all scientists, scientific organizations, and governments
is that climate change is happening and is caused by human
activity, a small minority of voices questions the validity of
such assertions and prefers to cast doubt on the preponderance
of evidence. · Climate change deniers often claim that recent
changes attributed to human activity can be seen as part of the
natural variations in Earth’s climate and temperature, and that it
is difficult or impossible to establish a direct connection
between climate change and any single weather event, such as a
hurricane. While the latter is generally true, decades of data and
analysis support the reality of climate change—and the human
factor in this process. · In any case, economists agree that
acting to reduce fossil fuel emissions would be far less
expensive than dealing with the consequences of not doing so.
1. Is this source neutral or biased toward the topic of “Global
Climate Change”.
Neutral
Biased
5. 2. This film asserts that “by burning fossil fuels such as coal,
gas and oil and clearing forests we have dramatically increased
the amount of carbon dioxide in the Earth’s atmosphere and
temperatures are rising”. Using this statement, what is the
film’s position on the cause of “Global Climate Change”?
Bubble one.
Climate Change is caused by humans
Climate change is natural and is not significantly increased by
humans.
What evidence is presented by the film to support the position?
List 3 bullet points.
Answer:
List 1 statement by the film that suggests bias.
Answer:
The Great Global Warming Swindle
Purpose Statement from The Great Global Warming Swindle
(http://greatglobalwarmingswindle.co.uk/):
“The whole global warming alarm, we believe, raises serious
issues about the way science functions in the real world, about
the political bias of scientists, about censorship within the
scientific community itself, about the routine practice of
scientists drawing false or inflated conclusions from ambiguous
or uncertain data, about the manifest failure of the peer review
process, about the extraordinary unwillingness of scientists who
have invested time and reputation in a particular theory to
consider evidence which directly contradicts it, about the
elevation of speculation (models) to the level of solid data, and
much else besides.
6. Science and scientists cannot always rise above the prejudices
of their class and of their age. The selection and handling of
evidence often reflects these prejudices. The most highly
qualified and respected scientists can be blind to obvious
deficiencies in a theory, and will be dismissive of evidence
when it undermines what they want to believe. But the scare
over man made global warming may prove to be the first great
example in the modern Western world, when science was
betrayed by scientists themselves."--- Great Global Warming
Swindle
The makers of the documentary The Great Global Warming
Swindle have made many science documentaries before. The
thing they found most shocking when they started to make this
one, was the "weakness of the case for man-made global
warming, and the quantity and quality of the evidence which
flatly contradicts it.”
1. Is this source neutral or biased toward the topic of “Global
Climate Change”.
Neutral
Biased
2. This film presents “the case against the theory of man-made
global warming” using 5 major points. The wording of each
point is quoted exactly from the website.
Film Point 1)The Sun- One of the most curious aspects of the
global warming alarm is the persistent reluctance of some
climate scientists to consider the role of the sun. The idea that
variations in solar activity, observable in the form of sun spots,
influence the earth’s climate has a long, important history,
stretching back to the astronomers
Film Point 2) Temperature Record central problem for those
who promote the idea of man-made global warming is the
7. earth’s temperature record – on almost all time scales. In the
last decade, there has been no clear warming trend.
· In the last century, much of the warming occurred prior to
1940, when human emissions of CO2 were relatively small
compared to today.
· During the post-war economic boom (when one would have
expected the temperature to rise) the world cooled.
· A thousand years ago there was time a warm period –
apparently warmer than today- followed by a relatively cold
period (known as the Little Ice Age).
· The Intergovernmental Panel on Climate Change (IPCC)
reports the original research-based graph was replaced by
another – the famous ‘Hockey Stick’ (so-called because it looks
like one) for dramatic effect.
· Over longer time periods of course, the earth has been far, far
hotter than it is today (with tropical forests covering much of
the earth) and also far, far colder, with much of the earth buried
under miles of ice. The Earth’s climate has always changed, and
changed without any help from us.
Film Point 3) Carbon Dioxide and Temperature. The ice-core
data is frequently cited as principal evidence to argue that CO2
is the earth’s main climate driver. It is, in a way, the jewel in
the crown of the theory of man made global warming.
· Ice-core data does not show that CO2 drives climate. It shows,
very clearly, that variations in temperature precede rises in
atmospheric CO2 – not the other way round.
· There is no evidence that CO2 has ever ‘driven’ the climate in
the past, nor is there any compelling evidence that it is doing so
now.
· According to global warming theory, if an enhanced
greenhouse effect (from increased levels of CO2 or indeed any
other greenhouse gas) is responsible for warming the earth, then
the rate of temperature rise should be greatest in that part of the
earth’s atmosphere known as the troposphere, specifically in the
tropics. And yet the observations, from weather balloons and
8. satellites have consistently shown that not to be the case.
Film Point 4) The Intergovernmental Panel on Climate Change
(IPCC) and Consensus. One of the biggest barriers to a rational
discussion about climatology, is the persistent and sinister use
of the ‘consensus’ argument. The idea that there is a consensus
between ‘the world’s top scientists’ is used to brow beat
politicians, to forestall media criticism of the global warming
orthodoxy and to marginalise and ridicule those scientists who
dare to speak out against the theory of man made global
warming.
· Who are these ‘top scientists’ and who says they all agree?
· The implications on public policy of the global warming alarm
(for all of us, in the developed world and even more the
developing world) are enormous. This is too big an issue for us
to rubber-stamp the declarations of a semi-political body such
as the IPCC.
· Sadly, we have no option, but to be grown up, to examine the
question ourselves, and make up our own minds. Is this global
warming alarm built on solid evidence?
Point 5) Extreme Weather Events. So much has been blamed on
global warming, from Hurricane Katrina to the Asian tsunami.
So many ludicrous claims have been made in this area, it is hard
to know where to begin debunking it all. In the global cooling
scare of the 1970s, all the same extreme weather events were
blamed on the world getting colder. Here we go again.
Point 6) Apocalypse Then. The following predictions based
upon the theory of Global Warming never materialised and
show the failure of Global Warming Theory.
· I would take even money that England will not exist in the
year 2000-- Paul Ehrlich in (1969)
· In ten years all important animal life in the sea will be extinct.
Large areas of coastline will have to be evacuated because of
the stench of dead fish.-- Paul Ehrlich, Earth Day (1970)
· Before 1985, mankind will enter a genuine age of scarcity . .
9. in which the accessible supplies of many key minerals will be
facing depletion-- Paul Ehrlich in (1976)
· This cooling has already killed hundreds of thousands of
people. If it continues and no strong action is taken, it will
cause world famine, world chaos and world war, and this could
all come about before the year 2000.-- Lowell Ponte "The
Cooling", 1976
· If present trends continue, the world will be about four
degrees colder for the global mean temperature in 1990, but
eleven degrees colder by the year 2000...This is about twice
what it would take to put us in an ice age.-- Kenneth E.F. Watt
on air pollution and global cooling, Earth Day (1970)
What is the film’s position on the cause of “Global Climate
Change”? Bubble one.
Climate Change is caused by humans
Climate change is natural and is not significantly increased by
humans.
What evidence is presented by the film to support the film's
position? List 3 bullet points.
Answer:
List 1 statement by the film that suggests bias.
Answer:
D. The Human Caused Global Warming Perspective:
The following website asserts that Global Warming exists and is
caused by humans.
Go to http://www.sciencecourseware.com/
10. · Click on Virtual Courseware for Earth and Environmental
Sciences
· Select Global Warming.
· Click on Tutorials.
· Click on Seasons on Earth.
1. What causes the seasons? The tilt of the Earth or the distance
from the sun? _________________
2. The Earth’s spins on its axis of rotation every:
___________________days.
3. The plane of the equator occurs where?
4. How many degrees of latitude are there between the equator
and the poles? _______
5. How long does it take for the Earth to revolve around the
sun? ___________________
6. What is the plane of the ecliptic?
7. As the earth orbits the sun what happens to its axis of
rotation relative to the stars?
8. How much is the Earth tilted on its axis?
9. What is the solar zenith angle?
10. Click on one of the numbered circles on the website.
To compute the energy per unit area, first click on each Zenith
angle in the image that pops up.
Find the area covered for the Zenith angle in the white box.
11. Type the number for the area covered in the box on the right
and then press the equals sign. Record your answers in the table
below.
Energy Flux
11. Click on “surface view” on the slide. Then click on each
latitude and month to find the Zenith angle.
Record the data in the table below
Lat
December
March
June
September
40º N
Zenith angle:
Energy Flux:
Zenith angle:
Energy Flux:
Zenith angle:
Energy Flux:
Zenith angle:
Energy Flux:
23.5º N
Zenith angle:
Energy Flux:
Zenith angle:
Energy Flux:
12. Zenith angle:
Energy Flux:
Zenith angle:
Energy Flux:
Equator
Zenith angle:
Energy Flux:
Zenith angle:
Energy Flux:
Zenith angle:
Energy Flux:
Zenith angle:
Energy Flux:
23.5º S
Zenith angle:
Energy Flux:
Zenith angle:
Energy Flux:
Zenith angle:
Energy Flux:
Zenith angle:
Energy Flux:
40º S
Zenith angle:
Energy Flux:
13. Zenith angle:
Energy Flux:
Zenith angle:
Energy Flux:
Zenith angle:
Energy Flux:
12. Choose the correct answers for the following questions by
filling in the bubble.
Go back to the main menu and choose “Carbon Cycle”:
The Carbon Cycle
1. Pure carbon is found as _________________ and
__________________________.
2. Organic compounds are composed of _________________,
________________, and __________________.
3. What does the statement that “Carbon is Conserved mean”?
Sinks
4. What is a carbon sink?
For the next few questions, roll your cursor over the words in
the activity (lithosphere, hydrosphere, etc.)
5. Where is carbon in the lithosphere?
6. Where is carbon in the hydrosphere?
7. Where is carbon in the biosphere?
8. Where is carbon in the atmosphere?
14. 9. Where is carbon in the soil?
10. Which sink contains the least carbon?
11. In which sink is carbon found as hydrocarbons (liquid
carbon)?
Long Term Cycle
12. How are sedimentary rocks degassed?
13. How does weathering release carbon?
14. Name three fossil fuels:
15. What is the long term carbon cycle?
16. Which process involves the transfer of carbon through
combustion?
17. Is there more carbon in sedimentary rocks or fossil fuels?
Short Term Cycle
18. What is the short-term carbon cycle?
19. How much carbon is in each sink?
Sink
Amount of Carbon
Turn-over Time
Atmosphere
Hydrosphere
Biosphere
Soil
15. 20. Which sink contains the largest amount of
carbon?_____________________________
21. Which process converts CO2 from the atmosphere into
organic matter?
Flux
1. Which process includes the transfer of carbon through
combustion?
2. Flux of carbon out of fossil fuels is
_________________________ times faster than flux into fossil
fuels. This is causing the carbon levels in the atmosphere to
____________.
3. Fill in the following table with the correct numbers:
Long Term Carbon Dioxide Levels
4. Record the estimated carbon dioxide levels in the
atmosphere:
a. In the early 1700’s _____________.
b. In the early 1800’s _____________.
c. In the early 1900’s _____________.
d. In the early 2000’s _____________.
5. What is the change in carbon dioxide levels from 1700 to
2000? _____________ ppm.
Skip to the Last Slide
6. Choose the correct answers for the following questions by
filling in the bubble.
Go back to the tutorial page and select Greenhouse Gases.
1. List the primary greenhouse gases.
1.
16. 2.
3.
4.
5.
1. These gases are referred to as greenhouse gases because they
can absorb and radiate ____________________________
radiation allowing the Earth to be warmer than space forming a
“greenhouse” where plants and animals can survive.
2. Fill in the following chart:
Gas
Name of Compound
CO2
CH4
H2O
N2O
CCl2F2
Carbon Dioxide
3. Fossil fuel combustion emits about ________% of the “extra”
CO2 in the atmosphere.
4. Fill out the following chart.
Source
% CO2 emitted in USA
1. Total CO2
17. 2. Electricity
3. Transportation
4. Manufacturing/Construction
5. Residential
6. Non-fuel energy & Industry
5. According to the EPA, what is the trend in nitrogen oxide
pollution in the United States? How have the concentrations of
nitrogen oxides changed over the last few decades?
Chlorofluorocarbons
1. What elements make up Chlorofluorocarbons?
C – Carbon
Cl – Chlorine
F - Fluorine
2. What is the Montreal Protocol?
3. Where were Chlorofluorocarbons historically used?
4. What is the concentration of Chlorofluorocarbons in the
atmosphere? ________.
Methane
18. 1. True or false: Landfills are a significant source of methane.
_________________ Why?
2. What role do livestock play in the generation of methane?
Nitrous Oxide
1. Laughing gas is made of ___________________________.
2. Nitrogen based fertilizer accounts for ___________% of
emission.
3. Industry account for ________% of Nitrous Oxide.
4. Livestock account for ________% of Nitrous Oxide.
5. What is the largest source of Nitrous Oxide emission?
______________________
6. According to the EPA, what is the trend in nitrogen oxide
pollution in the United States? How have the concentrations of
nitrogen oxides changed over the last few decades?
Ozone
1. Each ozone molecule is composed of three
________________ atoms.
7. What is the largest source of Troposphere ozone?
______________________
2. What role does nitrous oxide have in the formation of Ozone
(Roll cursor over number 3)?
3. According to the EPA, what is the trend in ozone pollution in
19. the United States? How has the concentration of ozone changed
over the last few decades?
Go back to the tutorial page and select Greenhouse Effect.
1. What is the Greenhouse Effect?
2. Which form of energy is radiated by the Earth’s surface?
3. Which form of radiation do greenhouse gases readily absorb
(skip to slide 3)?
4. According to the global warming activity, an increase in
greenhouse gas concentrations will have what effect on global
temperatures?
Go back to the tutorial page and select Albedo.
1. What is albedo?
2. Answer the questions below (last slide of albedo):
A Natural Climate Change Perspective: The Earth’s Tilt and
Orbit are the reason for Climate Variation
The following article asserts that climate changes naturally
occur in cycles and that the current climate changes are
consistent with past cycles.
“Astronomical Theory of Climate Change “ Retrieved from the
National Oceanic and Atmospheric Association” (NOAA)
Department of Paleoclimatology,
http://www.ncdc.noaa.gov/paleo/milankovitch.html For
educational purposes only.
What is the impact of the Earth’s Tilt on Climate? Changes in
the "tilt" of the earth can change the severity of the seasons.
The earth wobbles in space so that its tilt changes between
20. about 22 and 25 degrees on a cycle of about 41,000 years.
· More "tilt" means more severe seasons - warmer summers and
colder winters.
· Less "tilt" means less severe seasons - cooler summers and
milder winters.
What is the impact of the Eccentricity of the Earth’s Orbit on
Climate? The earth's orbit around the sun is not quite circular,
so the earth is slightly closer to the sun at some times of the
year than others. The "roundness", or eccentricity, of the earth's
orbit varies on cycles of 100,000 and 400,000 years. This
affects how important the timing of the closest approach of the
Earth to the sun, known as the perihelion, is to the strength of
the seasons. The perihelion now occurs in January, making
northern hemisphere winters slightly milder. This change in
timing of perihelion is known as the precession of the
equinoxes, and occurs on a period of 22,000 years. 11,000 years
ago, perihelion occurred in July, making the seasons more
severe than today.
The Combination of Tilt and Eccentricity. The combination of
the 41,000 year tilt cycle and the 22,000 year precession cycles,
impact the severity of summer and winter, are suggested by the
author to control the growth and retreat of ice sheets.
What Causes Ice Ages? Cool summers are thought to allow
snow and ice to last from year to year in high latitudes,
eventually building up into massive ice sheets. An earth covered
with more snow reflects more of the sun's energy into space,
causing additional cooling. The amount of Carbon Dioxide in
the atmosphere falls as ice sheets grow, adding to the cooling of
the climate. Warmer summers shrink ice sheets by melting more
ice than the amount accumulating during the winter.
What is The Milankovitch Theory? The Milankovitch or is an
explanation for changes in the seasons based upon the earth's
orbit around the sun. The theory is named for Serbian
astronomer Milutin Milankovitch, who calculated the slow
21. changes in the earth's orbit by careful measurements of the
position of the stars, and through equations using the
gravitational pull of other planets and stars. He asserted that the
earth's "tilt" causes seasons, and changes in the tilt of the earth
change the strength of the seasons. The seasons are modified by
the eccentricity (degree of roundness) of the orbital path around
the sun, and the timing of the perihelion.
What does the Milankovitch Theory Say About Future Climate
Change?
The author suggests that ice ages are related to the total summer
radiation received in northern latitudes zones where major ice
sheets form. Milankovitch calculations suggest that summer
radiation should increase gradually over the next 25,000 years,
and that no ice ages are expected in the next 50,000 - 100,000
years.
Using Ice Cores to Prove Milankovitch
All information and images in this section are from
http://jrscience.wcp.muohio.edu/studentresearch/climate_project
s_04/glacial_cycles/web/data.html for educational purposes
only.
What Is the Evidence? Evidence for the Milankovitch Cycle is
found in ice core samples. Ice core samples may contain a
detailed climate record extending back hundreds of thousands of
years. This record includes:
· Temperature
· Precipitation
· Chemistry
· Gas composition in the lower atmosphere
· Volcanic eruptions
· Solar variability
· Sea-surface productivity
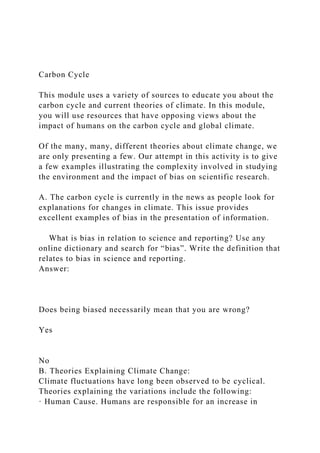
The image above right shows the changes in the ice core during
full ice ages. The vertical jagged dark blue data lines represent
22. from left to right: methane, carbon dioxide, and changes in
temperature from the present. Notice how the data for all three
show similar patterns.
The Milankovich calculations based upon the Earth’s tilt and
roundness of orbit show similar trends to the core sample data.
More "tilt" means more severe seasons - warmer summers and
colder winters; less "tilt" means less severe seasons - cooler
summers and milder winters. The Milankovitch data is graphed
at the bottom of the image to the right with the methane, carbon
dioxide and temperature graphed above it.
The patterns of Milankovich line up fairly with the data from
the core samples indicating that there is a correlation between
methane, carbon dioxide and the tilt and roundness of the
Earth’s orbit.
Graphical Representation
According to the authors, the atmospheric carbon increases just
before an ice age occurs. Once the ice age begins, the carbon in
the atmosphere decreases.
The image to the right represents the Milankovich data. To view
the images more closely, zoom in using your computer.
Notice that the top left image represents a full glacial period, or
full ice age. Over time the earth moves through an interglacial
period (between ice ages).
Questions
1. The Earth’s tilt ranges between ________ and ______degrees
on a cycle of ________ years.
2. According to the NOAA Department of Paleoclimatology,
What does more tilt of the Earth’s axis cause?
3. What does less tilt of the Earth’s axis cause?
4. What is the eccentricity of the Earth’s orbit?
5. What is the perihelion?
23. 6. According to the Milankovich theory, the shrinking and
swelling of the ice sheets is caused by:
7. What does the Milankovich Theory say is the driver of ice
ages?
8. What is The Milankovitch Theory?
9. What does the Milankovich Theory predict for the future?
10. What evidence is used to support the Milankovich Theory?
A Natural Climate Change Perspective: The Sun’s Energy
Output Controls the Earth’s Climate
The author suggests that a possible reason for the global
temperature changes is the variation in the energy output of the
sun. Perry, C. A. and K. J. Hsu. Geophysical, archaeological,
and historical evidence support a solar-output model for climate
change. Proceedings of the National Academy of the Sciences.
November 7, 2000 vol. 97 no. 23 12433-12438
Introduction
The Solar Output Model suggests that the energy output of the
sun causes changes in climate. As the world population
continues its rapid growth, the potential for catastrophic effects
from climate change increases. One important key to
understanding global climate change may be found in examining
climate events of world history and combining it with the
evaluation of samples from the Earth.
The Model
Climate changes are observed to follow a basic solar-cycle
length of 11 years. Earth-satellite measurements in the last two
decades show that that the total energy reaching the Earth varies
by at least 0.1% over the 11 year solar cycle. The average
sunspot-cycle length for the period 1700 to 1969 is also 11.1
years.
The distribution of the sunspot cycles is very nearly the same as
the distribution of cycles of other geophysical and astronomical
cycles. These patterns suggest that solar-activity cycles may be
the underlying cause of many climatic cycles that are preserved
24. in the geophysical record.
This model uses a series of waves based upon the 11 year solar
cycle to model solar energy over a full glaciercycle of 90,000
years. The model was compared with geophysical,
archaeological, and historical evidence of warm or cold climates
over the past 9000 years.
What Is the Evidence for the Solar Output Model?
The model predicting the Sun’s energy output correspond well
with the timing of “little ice ages”. One example of a little ice
age is the cool era from 1280–1860 CE (Common Era). These
cold periods occur approximately every 1,300 years. The
climate history of the last 1,000 years is of special interest and
also agrees well with the model.
The solar-output model is supported by geophysical,
archaeological, and historical evidence from 30,000 years
Before Present to the present. This model was compared with
geophysical data including records of sea level, carbon-14
production, oxygen 16/18 ratios”, and other geologic evidence
of climate fluctuations. The approximate 1,300-year cycle of
“little ice ages” and warmer periods agree with archaeological
and historical evidence. Throughout history, global warming has
brought prosperity whereas global cooling has brought
adversity.
What does the Solar Output Model Predict for the Future?
The model predicts a gradual cooling during the next few
centuries with intermittent minor warm-ups and a return to
little-ice-age conditions within the next 500 years. This cool
period then may be followed by a return to very warm and dry
conditions in approximately 1500 years. The solar output model
suggests that, approximately 20,000 years after it began, the
current warm period may come to an end and another glacial
period may begin.
The Data
25. Solar-output model from 14,000 years BP to 2,000 years AP
compared with sea-level deviations (24) and selected events
Modeled solar output (luminosity) from 40,000 years BP to
10,000 years AP compared with glacial, sea-level-deviation
(24), and archaeological information during the late Pleistocene
and Holocene.
Solar-output model from Gregorian calendar dates 400 B.C. to
A.D. 2500 compared with carbon-14 production (36) and
selected events.
Questions
1. According to the Solar Output theory of Climate Change,
what is suggested to be the underlying cause of climate change?
2. What is average sunspot-cycle length for the period 1700 to
1969?_____ years.
3. How frequently do the cold periods called "little ice ages"
occur? _____ years.
4. How long is Earth’s full glacier cycle? _________________
years.
5. What evidence is used to support the Solar Output model?
6. What does the solar output model predict for the future?
Image of Houston from noaa.gov
Carbon dioxide Methane Water
Nitrogen Oxides Chlorofluorocarbons