The south foot of hill ranges on north side of West Godavari District is the birth of Yerrakaluva, within few kilometers in down stream, a reservoir constructed near Konguvarigudem. Yerrakaluva ends up at Duvva Village to Yanamadurru drain separated by a weir. Yanamadurru acts as a drain for discharging waste water from the fields and ends by confluence with Upputeru at Naidupalem. On upstream of Yanamadurru drain from Bhemavaram village, River Gasthani confluenced with this Drain. River Gosthani and Yanamadurru drain downstream from Garagaparru influenced with industrial discharges, municipal sewage, aqua culture waste discharges and causing pollution nuisance to the people adjacent to Bhimavaram Town. The stretch of Yanamadurru drain is surveyed with water sample collections and found that the drain water, from its starting point is meeting drinking water standards crossed the limit acceptable of 500mg/L TDS at Peppara and further deterioration found and exceeded permissible limit of 2100mg/L at Garagaparru before confluence of River Gosthani. The COD and BOD concentrations are reached 116 and 42mg/L further increased when crossing Bhimavaram Town due to sewage and MSW joins to Yanamadurru drain.
Yanamadurru Drain Water Quality Assessment during 12-13 March, 2016
1. The International Journal Of Engineering And Science (IJES)
|| Volume || 5 || Issue || 5 || Pages || PP -92-102 || 2016 ||
ISSN (e): 2319 – 1813 ISSN (p): 2319 – 1805
www.theijes.com The IJES Page 92
Yanamadurru Drain Water Quality Assessment during 12-13
March, 2016
T.Vidya Sagar, M. Bujji babu
Joint Chief Environmental Scientist, Andhra Pradesh Pollution Control Board, Board Office ,Hyderabad
Analyst Gr-I, Andhra Pradesh Pollution Control Board, Zonal Office, Visakhapatnam
--------------------------------------------------------ABSTRACT-----------------------------------------------------------
The south foot of hill ranges on north side of West Godavari District is the birth of Yerrakaluva, within few
kilometers in down stream, a reservoir constructed near Konguvarigudem. Yerrakaluva ends up at Duvva
Village to Yanamadurru drain separated by a weir. Yanamadurru acts as a drain for discharging waste water
from the fields and ends by confluence with Upputeru at Naidupalem. On upstream of Yanamadurru drain from
Bhemavaram village, River Gasthani confluenced with this Drain. River Gosthani and Yanamadurru drain
downstream from Garagaparru influenced with industrial discharges, municipal sewage, aqua culture waste
discharges and causing pollution nuisance to the people adjacent to Bhimavaram Town. The stretch of
Yanamadurru drain is surveyed with water sample collections and found that the drain water, from its starting
point is meeting drinking water standards crossed the limit acceptable of 500mg/L TDS at Peppara and further
deterioration found and exceeded permissible limit of 2100mg/L at Garagaparru before confluence of River
Gosthani. The COD and BOD concentrations are reached 116 and 42mg/L further increased when crossing
Bhimavaram Town due to sewage and MSW joins to Yanamadurru drain.
Keywords: Yanamadurru drain, River Goasthani, Yerrakaluva, Veyyuru canal,Kalipatnam canal.
-------------------------------------------------------------------------------------------------------------------------------------
Date of Submission: 09 May 2016 Date of Accepted: 21 May 2016
--------------------------------------------------------------------------------------------------------------------------------------
I. INTRODUCTION
Based on the complaint regarding pollution of Yanamadurru drain, the Chairman, APPCB had entrusted
assessment of water quality to the Joint Chief Environmental Scientist, I/C (JCES). In obedience he proceeded to
Visakhapatnam for feedback from the JCEE, formed a team with the SES, an Analyst Gr-I and a Field-man from
the Zonal Laboratory, Visakhapatnam on 11.03.2016 and conducted survey, sampling and field monitoring on
12.03.2016 and 13.03.2016. Water Samples Analysis is done at Zonal Laboratory, Visakhapatnam. The JCES
prepared report with association of Analyst by processing the Analysis reports and field observations. On
upstream of Yerrakaluva near the south foot of hill ranges on north side of West Godavari District, Yerrakaluva
Reservoir constructed near Kanguvarigudem village and downstream point ends with Yanamadurru Channel at
Duvva village. Yanamadurru drain water is used for lift irrigation of paddy fields and drain flood water from the
cultivated fields (paddy, Aqua culture fields). Yanamadurru drain/channel is around 61.2 KM length up to
confluence of Upputeru. It is also called as Veyyuru canal up to confluence point of River Gosthani at
Gollalakoderu. Yanamadurru drain is in the web of agriculture drains originated from Dowaleswaram anicut on
River Godavari, intended for discharge of wastewater and floodwater from these fields. Hence it has many inlets
with control to prevent back flow from these fields and canals.
II. SURVEY AND MONITORING
The team on 12.03.2016 reached Duvva village and started survey, water sampling along the bund of
Yanamadurru drain. Water samples are referred „S‟ series (S1-18) and Photographs at critical points and
observations are referred X series (X1-31) as detailed at TABLE 1. Photographs are placed at Fig. 1-3, GPS data
collected with the aid of smart phone “CoolpadNote3” and GPS mapping is done with the aid of “ViewNX2”
software provided with camera “Nikon CoolpixP520”. There is some uncertainty in lat-long data as it is from
GPS through smart phone for serving approximate indication of position.
Water Sample collected from Yerrakaluva downstream at Duvva village (S1, X2) and it is called
Yanamadurru drain separated by a weir. The next Yanamadurru drain water sample collected at a bridge near
Menavalluru village (S2, X3) where Arudalakodu (A confluence of combination of some drains) joined through
a weir and culvert in upstream. Then the team observed that water is joining through culvert to the Yanamadurru
2. Yanamadurru Drain Water Quality Assessment…
www.theijes.com The IJES Page 93
drain at upstream of a bridge at Pippera village. Water sample collected near Bridge, Pippera from Yanamadurru
drain (S3, X5) where local farmers are using diesel motors for lifting water from the drain. Water sample
collected near bridge, Kesavaram village from Yanamadurru drain (S4, X6). In the downstream from Kesavaram
Village there is one more bridge (X6), observed aqua culture farm fields draining rejects through pipe line in to
Yanamadurru drain and collected water sample from pipeline (S5, X7, X8). Later, near subway at S.Kongepadu,
water sample is collected from Yanamadurru drain (S6, X9). After crossing a culvert (X10), there is a Bridge at
Yandagandi (X11) and proceeds to a Bridge, Garagaparru. A water sample is collected at the Bridge,
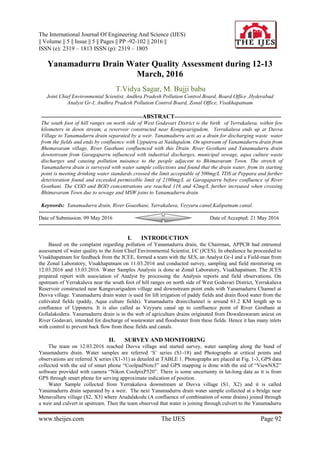
Garagaparru from Yanamadurru drain (S7, X12). Photographic views of Yenamadurru stretch from Bridge,
Duvva to Bridge, Garagaparru are covered in X1-12 are at Fig. 1.
X1 X2 X6
X3 X4 X5 X8 X10
X7 X9 X11 X12
Fig. 1: Photographic views of Yenamadurru stretch from Bridge, Duvva to Bridge, Garagaparru (X1-12)
There is sudden change in the color, suspended and floating matter and municipal garbage found inside the
bank of Yanamadurru drain in downstream from Bridge, Garagaparru. In the downstream, water sample is
collected at Farmers Welfare Society Lift Irrigation Point (S8, X13) and observed on the opposite bank, there is
covered pipe line joining Yanamadurru drain (X14). Down to it, oily surface on drain water is observed and
garbage waste is being dumped inside the bund of Yanamadurru drain. While moving forward, it is observed that
prawn processing units on opposite bund edge of Yanamadurru drain, processed aqua solid waste rejects are
found inside bank with foul smell (X15). The confluence point of River Gosthani is reached (X16). Water
Sampling is done at River Gosthani before its confluence with Yanamadurru drain (S9, X16) used for
agricultural lift irrigation. Then the team reached Yanamadurru drain after confluence with River Gosthani at
Palakoderu and collected sample (S10, X18) from lift irrigation point in the downstream near Gollalakoderu
Village Bridge. The team moved on the bank of River Gosthani, before confluence with Yanamadurru drain,
collected water sample near bridge (S11, X19), after confluence with M/s. Delta paper Mills effluents and is
used for agriculture purpose with lift irrigation. It crossed M/s. Delta paper Mills, Vendra village treatment
facility, collected sample on upstream before confluence of M/s. Delta paper Mills effluents and it is the point
after confluence of aqua culture effluents (S12, X20). Then, the team moved towards upstream of River
Gosthani and found aqua culture fields discharging rejects to the river and samples are collected on upstream of
3. Yanamadurru Drain Water Quality Assessment…
www.theijes.com The IJES Page 94
this confluence point in the River Gosthani (S13, X21). Photographic views of Yenamadurru stretch from
farmer‟s welfare lift irrigation pump, Garagaparru to lift irrigation Pump at Palakoderu and the stretch of River
Gosthani up to Vendra from confluence with Yanamaduru drain are covered in X13-21 are at Fig. 2.
X13 X14 X15
X16 X17 X18
X19 X20 X21
Fig. 2: Photographic views of Yenamadurru stretch from Garagaparru to Palakoderu and stretch of River
Gosthani up to Vendra from confluence with Yanamaduru drain.
On 13.3.2016, the team consulted complainant Mr. Ansari, Secretary Consumer Welfare Protection Society,
Bhimavaram Town and his associates for collecting opinions. They informed that the people including him
suffered from unbearable foul smell emanate from Yanamadurru drain in the city area. He opined that, it would
be from the industries discharges. He and the members of his society opined that a dedicated pipe line for
industrial discharges into sea would be a remedy for the problems they are facing and expressing their
willingness of contribution in some extent.
Later, the team continued survey on bank of Yanamadurru drain downstream from Bhimavaram Town.
Sample is collected near Prakasam chowk (S14, X22), then reached to Government hospital road and collected
sample near footpath bridge connecting 1 and 2 towns of Bhimavaram (S15, X23). It reached Bhimavaram
lakulu connecting Kalipatnam canal (agriculture) and collected sample from Yanamadurru drain (S16, X24).
Then it reached Yanamadurru village and collected sample from Yanamadurru drain (S17, X25). It finally
proceeds to Naidupalem before confluence point of Upputeru and collected samples from the Yanamadurru
drain (S18, X26). Photographic views of Yenamadurru drain stretch from Prakasam chowk, Bhimavaram to
Upputeru, Naidupalem are covered in X22-26 at Fig. 3. The samples details referred as S1-18 are placed at
column 2 and Photographs X1–26 are referred at column 1 TABLE 1.
X22 X23 X24
4. Yanamadurru Drain Water Quality Assessment…
www.theijes.com The IJES Page 95
X25 X26
Fig. 3: Photographic views of Yenamadurru drain stretch from Prakasam chowk, Bhimavaram to Upputeru,
Naidupalem.
Table 1: Sample location / Photographic View Point Description (location)
View
point
Sampl
e Code
Sample location / Photo View Point Description
(location)
Latitude
N
Longitude
E
X1 S1 Yanamadurru drain water collected at weir (Lakulu), Duvva
(V)
16°46‟51.8" 81ͦ 37‟20.6”
X2 S2 Yanamadurru drain water collected at Bridge- Meenavalluru
(V) and a view of Arudalakodu (a set of drains) joining
through weir and culvert in upstream.
16°44‟10.8" 81ͦ 35‟26.3”
X3 water is joining through culvert to the Yanamadurru drain at
upstream of a bridge at Pippera village
16°40‟58.6" 81ͦ 36‟23.6”
X4 S3 Yanamadurru drain water collected near Bridge- Pippara
(V) and a view in upstream, water joining through a culvert.
16°46‟51.8" 81ͦ 37‟20.6”
X5 S4 Yanamadurru drain water collected near Bridge- Kesavaram
(V) views of Yanamadurru drain near Kesavaram Bridge
16°41‟26.3" 81ͦ 32‟20.0”
X6 In the downstream from Kesavaram Village there is one
more bridge
16°40‟46.9" 81°32'19.5"
X7,
X8
S5 Yanamadurru drain water collected near fish/prawn
cultivation, hatcheries point (at the point waste water is
discharged through pipe line into drain) near Kesavaram
(V)
16°40‟29.7" 81ͦ 32‟16.9”
X9 S6 Yanamadurru drain water collected at Bridge near Subway,
S.Kongepadu (V)
16°46‟51.8" 81ͦ 37‟20.6”
X10,
X11
Culvert and Bridge at Yandagandi 16°38‟52.4" 81ͦ 32‟6.8”
X12 S7 Yanamadurru drain water collected at Bridge (Abundant
quantity of municipal solid waste was observed on the
bunds) – Garagaparru (V)
16°36‟58.2" 81ͦ 32‟15.0”
X13 S8 Yanamadurru drain sample collected B/C of Gosthani river
at farmers welfare society lift irrigation point – Garagaparru
(V)
16°35‟26.4" 81ͦ 32‟16.0”
X14,
X15
Pipe line joining Yanamadurru drain near Garagaparru
Village. Down to it processed aqua solid waste reject found
inside bank and observed foul smell
16°36‟58.2" 81ͦ 32‟15.0”
X16 The confluence point of River Gosthani 16°36‟17.8" 81ͦ 32‟8.5”
X17 S9 River Gosthani sample collected B/C of Yanamadurru
drain- Garagaparru (V)
16°35‟35.4" 81ͦ 32‟18.8”
X18 S10 Yanamadurru drain sample collected after confluence with
river Gosthani- Palakoderu (V). A view of sampling point at
lift irrigation through pipeline
16°34‟41.4" 81ͦ 32‟15.4”
X19 S11 Gosthani river water collected after the confluence point of
M/s. Delta Paper Mills 16°46‟51.8"effluent – Vendra (V).
A view at bridge on River Gosthani.
16°33‟51.3" 81ͦ 34‟10.3”
X20 S12 Gosthani river water collected before the confluence point
of M/s. Delta Paper Mills effluent and after confluence of
Aqua culture effluents – Vendra (V).
16°33‟51.3" 81ͦ 34‟10.3”
X21 S13 Gosthani river water collected before the confluence point
of Aqua culture effluents – Vendra (V). Views of River
16°33‟51.3" 81ͦ 34‟10.3”
5. Yanamadurru Drain Water Quality Assessment…
www.theijes.com The IJES Page 96
Gosthani at aqua culture fields
X22 S14 Yanamadurru drain samples collected at Yanamadurru
Bridge of Bhimavaram Town near Prakasham Chowk –
Bhimvaram (V)
16°32‟32.8" 81ͦ 31‟7.0”
X23 S15 Yanamadurru drain samples collected at foot path Bridge
near Govt. Hospital, Bhimavaram connected first and
second towns – Bhimavaram (V)
16°32‟51.8" 81ͦ 31‟7.0”
X24 S16 Yanamadurru drain samples collected at Bhimavaram
Lakulu, D/s. of Bhimavaram Town B/C point of Kalipatnam
Canal and Photographic views
16°32‟39.7" 81ͦ 31‟5.8”
X25 S17 Yanamadurru drain samples collected at Yanamadurru
Village and view of the drain.
16°29‟0.7" 81ͦ 31‟4.3”
X26 S18 Yanamadurru drain samples collected at Naidupalem
Bridge – Naidupalem (V), before the confluence with
Upputeru. The photograph for referring lat-long.
16°23‟50.8" 81ͦ 28‟33.2”
III. LABORATORY ANALYSIS
Laboratory Analysis consisting of physico-chemical analysis at the Laboratory for (i) Chemical Oxygen
Demand (COD), Biological Oxygen Demand (BOD) and Dissolved Oxygen (DO); (ii) estimation of inorganic
ionic concentrations of Sodium, Potassium, Calcium, Magnesium, Chloride, Sulphate, Carbonate, Bicarbonate,
Ammonium, Nitrate, Nitrite, Phosphate, Boron, Fluoride and Heavy metals. Standard Operating Procedures
(SOPs) are followed [1, 2]. SOPs were prepared and upgraded from time to time based on the methods of i)
APHA (American Public Health Association), 16th (1985), 20th (1998) and 21st Edition (2005): titled
“Standard Method for Examination of water and wastewater”, ii) “Guide Manual: Water and Wastewater
Analysis” published by the CPCB, New Delhi, iii) Indian Standard (IS) methods as mentioned against parameter.
Checking Correctness of Analysis [3, 4] include pH, EC, TDS and major anionic and cationic constituents that
are indications of general water quality.
TABLES 2–3 show irrigation hazardous water quality rating (Ir. HWQR) [5] based on hazardous effects on
plants and Limits of parameters as per BIS/ Guidelines for Quality of Irrigation Water IS 11624 (1986) modified
in 2006 and comparable for drinking water standards IS 10500:1991 with its update IS 10500:2012. Hazardous
effects of irrigation water [6] are classified into four major groups (1) Total Salt Concentration expressed as the
EC in the scale of micro-mhos/cm, (2) SAR in the scale of Square root of millimole/L, (3) RSC in the scale of
milIiequivalent/L, (4) Percent Sodium. Water Quality Index (WQI) systems [7] are discussed. For setting water
quality objectives of a water body, it is essential to identify the uses of water in that water body. In India, the
Central Pollution Control Board (CPCB), an apex body in the field of water quality management, has developed
a concept of “designated best use”and identified 5 classes (TABLE 4) [8]. According to which, out of several
uses a particular water body, the use which demands highest quality of water is called its “designated best use”,
accordingly it is designated.
Table 2: Ir. HWQR
Ir. HWQR
Salt conc. as EC
(micromhos/cm)
SAR (millimole/L)1/2
RSC (me/L) Percent Sodium (%Na)
Low Below 1500 Below 10 Below 1.5 <20
Medium 1500-3000 10-18 1.5-3.0 20-40
High 3000-6000 18-26 3.0-6.0 40-60
Very high Above 6000 Above 26 Above 6.0 60-80
Table 3: Limit as per BIS/ IS:11624 (1986), IS 10500:1991, IS 10500:2012
Sl
No.
Parameter (except pH, expressed as
mg/L)
Acceptable
Limit
Permissible Limit in absence of alternate
source
1 pH 6.5 – 8.5 6.5 - 8.5
2 TDS 500 2000
3 Calcium (as Ca) 75 200
4 Chloride (as Cl) 250 1000
5 Magnesium (as Mg) 30 100
6 Sulphate (as SO4) 200 400
7 Total Alkalinity (TA as CaCO3) 200 600
8 Total Hardness (TH as CaCO3) 200 600
6. Yanamadurru Drain Water Quality Assessment…
www.theijes.com The IJES Page 97
Table 4: Primary Water Quality Criteria for Designated Best Uses by CPCB (PWQC)
Parameters
Designated-Best-Use
Classofwater
pH
DOmg/L
BODmg/L
FreeNH3asN
mg/L
ECmicro
mhos/cm
SAR
TotalColi
formMPN
/100ml
Drinking water source without conventional
treatment but after disinfection
A 6.5–8.5 > 6 < 2 - - - < 50
Outdoor bathing (Organized) B 6.5–8.5 > 5 < 3 - - - < 500
Drinking water source after conventional
treatment and Disinfection
C 6.0–9.0 > 4 < 3 - - - < 5000
Propagation of Wild life and Fisheries D 6.5–8.5 > 4 - - - - -
Irrigation, Industrial Cooling, Controlled
Waste disposal
E 6.0–8.5 > 4 - - 2250 26 -
IV. EXPERIMENTATION
The sampling points are sequenced from upstream to downstream and shown diagrammatically at Fig.4 with
representation as S1–18 along the Yanamadurru drain and River Gosthani stretches grouped as S1–7 (Gr.1), S5
inlet pipe, S8, S10, S14–18 (Gr.2), S9, S11–13 (Gr.3).
Figure 4: S1–7 (Gr.1), S5 inlet pope, S8, S10, S14–18 (Gr.2), S9, S11–13 (Gr.3).
Fig.5 shows the stretch marked with sampling points of Yanamadurru Drain in three blocks from upstream
(a) Duvva – Garagaparru, (b) River Gosthani confluence, Garagaparru – Gollalakoderu and (c) Bhimavaram –
Nagidipalem, before confluence to Upputeru around 5km apart from sea Bay of Bengal.
V. CHECKING CORRECTNESS OF ANALYSIS [9]
The following procedures are applied to water samples for which relatively complete analysis is made.
These include pH, EC, TDS and major anionic and cationic constituents that are indications of general water
quality. The data is classified as Primary, Secondary, Significant and Non-significant parameters.
7. Yanamadurru Drain Water Quality Assessment…
www.theijes.com The IJES Page 98
(a) (b) (c)
Fig. 5: Stretch of Yanamadurru Drain marked with sampling points (a) Duvva – Garagaparru, (b) River Gosthani
confluence, Garagaparru – Gollalakoderu and (c) Bhimavaram – Nagidipalem
Primary Analysis Data contains Station code, Monitoring date, organic and specific constituents (COD,
BOD, DO, TSS, pH, EC), non-significant constituents (Fluoride, Boron, Ammonia, Nitrate, Nitrite, Phosphate)
and significant constituents (TDS, Chloride, Sulphate, Sodium, Potassium, Total Hardness (T.H), Calcium
Hardness (Ca.H), Total Alkalinity (T. Alk.) and Phenolphthalein Alkalinity (Phe. Alk.)). Secondary Data is
derived from Significant data such as Calcium, Magnesium, Carbonate, Bicarbonate, percent sodium, SAR, etc.
for checking Correctness of Analysis and material balance.
The short titles incorporated at TABLES 5-7 are Electric Conductivity (EC) micro mhos/cm; Total
Dissolved Solids (TDS) mg/L; Sum of all cations i.e., significant cations and non- significant cations (ACS);
Sum of all anions i.e., significant anions and non-significant anions (AAS); Sum of weights of all ions or
Calculated TDS with all ions (ACTDS) mg/L; For all ions, Anion cation balance as %diff. (AACD); Sum of
major cations or significant cations (MCS); Sum of major anions or significant anions (MAS); Sum of weights of
significant cations and significant anions (MCTDS) mg/L; Significant cations and significant anion balance as
%diff. (MACD).
TDS by calculation = 0.6 (Alkalinity) +Na+
+K+
+Ca2+
+Mg2+
+Cl¯ +SO4
2
¯ +SiO3
2
¯ +NO3¯ +F¯ +PO4
3
¯
The anion and cation sums, when expressed as milliequivalents (meq.) per liter, must balance because all potable
waters are electrically neutral i.e. around 7.0 pH. The test is based on the percentage difference {defined as
%difference = ((Σ cations – Σ anions)/( Σ cations + Σ anions))}. The typical acceptance criteria based on 0-3.0,
3.0-10.0 and 10.0-800 ranges of anion sums lies +0.2, +0.2 and +0.5, respectively.
Measured EC and ion sum: Both the anions and cations should be 1/100 of the measured EC value. The
acceptable criteria are 100 * anion (or cation) sum, meq/L = (0.9-1.1) EC. Calculated TDS to EC ratio
acceptable criteria for the ratio of calculated TDS to EC is as follows: Calculated TDS / conductivity ≈ 0.55 –
0.7. Measured TDS to EC ratio acceptable criterion is ≈ 0.55 – 0.7.
5.1. Action to be taken in conducting Analysis
If the %difference is not in acceptable range, it indicates that some measurement of ions is missing to be
identified and to be analyzed. It indicates reanalysis. The measured TDS should be higher than the calculated
one because a significant contributor may not be included in the calculation. The acceptable range is Measured
TDS / Calculated TDS < 1.2 for potable waters.
If the measured value is less than the calculated one, the higher ion sum and measured value are suspect; the
sample should be reanalyzed. If the measured solids concentration is more than 20% higher than the calculated
one, the low ion sum is suspected and selected constituents should be reanalyzed. If measured EC and ion sum
ratio does not meet the criterion, that sum is suspect; reanalyze the sample.
Calculated TDS to EC ratio ≈ 0.55 – 0.7, and falls below 0.55 or above 0.7, the lower ion sum or the higher
ion sum is suspected; reanalyze it, respectively. If reanalysis causes no change in the lower ion sum, an
unmeasured constituent, may be present at a significant concentration. If poorly dissociated Calcium and
9. Yanamadurru Drain Water Quality Assessment…
www.theijes.com The IJES Page 100
S16 2020 570 48.2 307.8 21.9 630 330 480 132.3 72.9 480.0 51.5 5.3
S17 2300 700 64.3 421.6 29.3 670 299 500 119.8 90.2 500.0 57.8 7.1
S18 20670 9222 1006 7640.6 48.7 3140 469 400 188.0 649.1 400.0 84.1 59.3
TABLE 7 represents the ions of heavy metals indicating minor constituents. Most of results are with in the
scope of validation with little deviations in some parameters such as TSS and Sulphates; especially sample S6
that is indicating low TDS and EC may be result of sampling, field conditions and analysis part.
Table 7: Ions of heavy metals indicating minor constituents
Station
code #
Lead
(Pb)
Iron
(Fe)
Zinc
(Zn)
Nickel
(Ni)
Copper
(Cu)
Chromium
(Cr)
Cadmium
(Cd)
S1 ND ND 0.062 ND 0.015 ND 0.003
S2 ND ND 0.139 ND 0.002 ND ND
S3 ND ND 0.029 ND ND ND ND
S4 ND ND 0.035 ND ND ND ND
S5 0.035 0.019 0.04 ND 0.003 ND 0.01
S6 ND ND 0.074 ND ND ND ND
S7 ND 0.037 0.021 ND ND ND ND
S8 ND 0.118 0.039 ND ND ND ND
S9 ND 0.046 0.034 ND ND ND ND
S10 ND 0.153 0.014 ND ND ND ND
S11 ND 0.107 0.254 ND ND ND ND
S12 ND ND 0.386 ND ND ND ND
S13 ND ND 0.023 ND ND ND ND
S14 ND 0.061 0.043 ND ND ND ND
S15 ND 0.076 0.026 ND ND ND ND
S16 ND 0.005 0.024 ND ND ND ND
S17 ND 0.017 0.652 ND ND ND ND
S18 0.052 0.03 0.162 ND ND ND 0.021
# ND refers the value at below detectable range and to be treated as Zero for all practical purposes.
VII. DATA ANALYSIS, DISCUSSIONS AND CONCLUSIONS
There is a web of branch canals originated from Dowaleswaram anicut on River Godavari and Yerrakaluna
Reservoir surround Yanamadurru drain facilitating drainage system and hence it has many inlets with control to
prevent back flow. The monitoring is started in the afternoon section of a sunny day and due to high chlorophylls
activity the DO concentrations at all monitoring points showing greater than 4.8 mg/L irrespective of BOD and
COD concentrations.
Fig. 6 is showing the redundancy of analysis data with respect to (a) Sum of Cations verses Sum of Anions
(MCS vs. MAS), (b) Total Dissolved Solids verses Calculated TDS (TDS vs. CTDS) indicating the accuracy of
analysis.
Samples are grouped S1-7 with separate entity for S5 are as Veyyur Canal stretch (Gr.1). Samples S8, S10,
S14-18 are as Yanamadurru before confluence with River Gosthani, Garagaparru to Upputeru stretch (Gr.2) and
S9, S11–13 are as River Gosthani stretch (Gr.3).
0
50
100
150
200
250
300
350
0 50 100 150 200 250 300 350 400 450
MCS
MAS
0
5000
10000
15000
20000
0 5000 10000 15000 20000 25000
TDS
CTDS
(a) (b)
Fig. 6: Data redundancy in respect to (a) MCS vs. MAS, (b) TDS vs. CTDS
7.1. Gr.1 sampling points
Gr.1 sampling points, S1-7 are in the order from the Yanamadurru Drain starting points to Garagaparru (V)
except S5 that is discharged through pipe line into drain near Kesavaram (V) from fish/prawn hatcheries between
S4 and S6. Hence, S5 is referred separately. The range and average of pH for Gr.1 are 6.7-7.5 and 7.1,
respectively, representing S1 (7.3) >S2 (7.0) <S3 (7.1) >S4 (6.9) <S6 (7.5) >S7 (6.7 pH). From S1-7, decrease
of pH found with up and downs along the stretch at Gr.1 points indicates increase of acetic nature. Gradual
increase of EC and TDS from acceptable criteria (<500 mg/L) crossing the permissible limit in the absence of
10. Yanamadurru Drain Water Quality Assessment…
www.theijes.com The IJES Page 101
alternate source (>2000). The trend of TDS is S1 (210) < S2 (360) < S3 (520) < S4 (560) < S6 (1240) < S7
(2120 mg/L) and S5 (8078) joins between S4–6 to the drain. The trends of EC is S1 (312) < S2 (529) < S3 (695)
< S4 (759) < S6 (1695) < S7 (1220 mg/L) and S5 (11540). The BOD and COD fluctuate ranging from 3.1 –
42.0 and 8 – 116 mg/L, respectively, with small deviations support decrease in drain quality while moving
downstream. DO is ranging 5.4 – 7.5 mg/L indicate the aeration capability of the drain to support aerobic aquatic
life. Chloride, Sodium, Potassium, Total Hardness and Total Alkalinity trends are showing gradual increase of
Gr.1 points. TSS values are supporting the same trends except at S6.
7.2 Gr.2 sampling points
Gr.2 sampling points S8, S10, S14-18 from Yanamadurru B/C of River Gosthani, Garagaparru – Upputeru
confluence stretch. Yanamadurru drain, just before and after confluence of River Gosthani is 6.5pH while River
Gosthani B/C is 6.8pH. River Gosthani water after confluence reached in Yanamadurru drain upstream point S8
also and used for irrigation agricultural fields.
TDS trends: S8(2060)<S10(2100)<S14(2200)>S15(2060)>S16(2020)<S17(2300)<<<<S18 (20670)
The trends of EC, TH, TA, Chlorides and Sulphate followed the above sequence.
COD and BOD trends with reference to TABLE 5: S8<<S10>>S14>>S15<S16<S17>>>S18
7.3. Gr.3 sampling points
Gr.3 sampling points, S9, S11–13 indicate the stretch of River Gosthani B/C with Yanamadurru drain. S9
indicate B/C with Yanamadurru drain and also after confluence of M/s. Deltapaper Mills (P) Ltd showing less
TDS (in the acceptable range of discharge standards) than other points in the River Gosthani Stretch. The
upstream points S11 and S12 indicate discharges from aquaculture fields and at upstream side S13 the TDS is in
the acceptable range of discharge standards. The discharges from M/s. Deltapaper Mills (P) Ltd are around
11MLD and the flow from upstream is supposed to be 5MLD with 2910mg/L TDS in the River Gosthani
indicate dilution of TDS before its confluence with Yanamadurru Drain. Hence, the farmers surrounding the
confluence are draining River water before confluence for agricultural irrigation purpose. Opposite to B/C of
Yanamadurru with River Gosthani, in upstream side, there is MSW and other Solid water dump on the bank and
there are prawns and waste processing industries. Value of pH before and after confluence is 6.5 and it is 6.8pH
at River Gosthani indicating putrefication / acidic waste discharges to Yanamadurru drain nearer to the River
Gosthani confluence. Further, Sodium, TH, CaH, Chloride and Sodium increased, and abnormal increase of
COD and TSS, after confluence of River Gosthani in Yanamadurru drain indicating there is some effluent
discharges into drain which are to be identified and regulated. Bhimavaram town MSW dump to the
Yanamadurru drain found at large quantities after Garagaparru streatch. The waters of Yanamadurru drain are
changing from class A to D when reaching Garagaparru Village and irrigation hazard quality rating is
“Medium”.
7.4. Action Taken
A preliminary report is communicated to executive officers for taking measures to identify polluting inlet
channels and implementing remedial measures in co-operation with other departments.
VIII. REMEDIAL MEASURES
The solid waste dump opposite bund of Yanamadurru near confluence of River Gosthani at Garagaparru is
to be cleared and checked for wastewater inlets. Aquaculture on uplands from Bhimavaram Town and the fields
drain lines joining to Yanamadurru drain and River Gosthani are to be restricted. The aquaculture on uplands
spoils the ground water and agriculture field and hence penalization is to be imposed on defaulters. Bhimavaram
town MSW dump into Yanamadurru drain and the existing MSW dump within Yanamadurru drain which is to
be removed and restriction is to be imposed on solid waste dump to the drain in its bunds along the stretch.
The complainant‟s proposal of parallel pipe line for industrial and aquaculture discharges, which supports
tremendous industrial growth and indiscriminate discharges without proper treatment spoils the coastline. If it is
for aquaculture waste disposal, it is not supported due to spoil of agriculture land and ground water permanently.
The industries are to be restricted to adopt proper treatment facilities for treating their effluents as per CPCB
discharge standards. The treatment facilities and efficiency [10] show that proper maintenance and operation
would serve for treating pollution of incoming water to acceptable safe levels.
Some of villager‟s report is that at high tide times, the sea waters (brackish water) through Upputeru reaches
up to Kesavaram (V) in the Yanamadurru drain which attracts further study on the influence of sea water and self
purification capabilities of the drain. It is suggested to track the pollution levels of the stretches of Yanamadurru
drain and implement remedial measure River Gosthani may be monitored at regular intervals by the regulating
agencies.
11. Yanamadurru Drain Water Quality Assessment…
www.theijes.com The IJES Page 102
IX. ACKNOWLEDGEMENT
The authors acknowledged the sense of gratitude to Dr. Phani Kumar G.N, Chairman, Andhra Pradesh
Pollution Control Board for guidance and opportunity. The authors acknowledged the Member Secretary,
APPCB for support. The authors acknowledged B.Madusudhana Raav, JCEE, ZO, Visakhapatnam for logistics
and providing support. The authors acknowledged P.Somsunder, Senior Environmental Scientist, APPCB, Zonal
Laboratory, Visakhapatnam for extending his co-operation in sampling and analysis. The authors acknowledged
Zonal Laboratory, Visakhapatnam staff members for their participation in analysis. The authors expressed the
sense of gratitude to other staff members of the APPCB for providing information and support.
REFERENCES
[1]. APHA (American Public Health Association), 16th (1985), 20th (1998) and 21st Edition (2005): titled “Standard Method for
Examination of water and wastewater”
[2]. “Guide Manual: Water and Wastewater Analysis” published by the CPCB, New Delhi
[3]. Book Title: Standard Methods for the examination of water and wastewater, Pub: Americal Public Health Association, 16th
1985, 20th 1998 and 21st 2005 Edn. Sec. 1030 E. Checking Correctness of Analysis.
[4]. “Guide Manual: Water and Wastewater Analysis” pub. by the CPCB, New Delhi.
www.cpcb.nic.in/upload/Latest/Latest_67_guidemanualw&wwanalysis.pdf,
[5]. IS 11624 (1986): Guidelines for the quality of irrigation water [FAD 17: Farm Irrigation and Drainage Systems]
[6]. C. K. Jain1, A. Bandyopadhyay1 and A. Bhadra2, Guidelines for evaluation of irrigation water quality, J. Indian Water Resour.
Soc., 32 (2012). Assessment of Ground Water Quality for Irrigation Purpose, District Nainital, Uttarakhand, India
http://www.iwrs.org.in/journal/july2012/2july.pdf.
[7]. T.Vidya Sagar, International Journal of Innovative Research in Science, Engineering and Technology, Vol. 4, Issue 10, October
2015, ISSN(Online) : 2319-8753 ISSN (Print) : 2347-6710. Water Quality of Some Moderately Polluted Lakes in GHMC –
India. DOI:10.15680/IJIRSET.2015.0410061.
[8]. Guidelines for Water Quality Management, CENTRAL POLLUTION CONTROL BOARD, PARIVESH BHAWAN, EAST
ARJUN NAGAR, DELHI. Website : http://www.cpcb.nic.in
[9]. Book Title: Standard Methods for the examination of water and wastewater, Pub: Americal Public Health Association, 16th
1985, 20th 1998 and 21st 2005 Edn. Sec. 1030 E. Checking Correctness of Analysis.
[10]. T.Vidya Sagar. Int. Journal of Engineering Research and Application, ISSN: 2248-9622, Vol. 6, Issue 3, (Part - 2) March 2016,
pp.28-43