Analysing the attitude of students towards robots when lectured on programming by robotic or human
•Download as PPTX, PDF•
1 like•108 views

TEEM'16 - Track 1 Computational thinking in pre-university education Authors: Miguel Ángel Conde; Camino Fernández Llamas; Francisco Javier Rodríguez-Lera; Francisco Javier Rodríguez-Sedano; Vicente Matellan; Francisco J. García-Peñalvo https://youtu.be/0HV2QFsay8k

Recommended
Recommended
More Related Content
Viewers also liked
Viewers also liked (16)
Similar to Analysing the attitude of students towards robots when lectured on programming by robotic or human
Similar to Analysing the attitude of students towards robots when lectured on programming by robotic or human (20)
More from Technological Ecosystems for Enhancing Multiculturality
More from Technological Ecosystems for Enhancing Multiculturality (20)
Recently uploaded
Recently uploaded (20)
Analysing the attitude of students towards robots when lectured on programming by robotic or human
- 1. Analyzing the Attitude of Students Towards Robots when Lectured on Programming by Robotic or Human Teachers
- 2. Introduction
- 3. Introduction
- 4. Introduction Negative Attitudes towards Robots Scale (NARS) Robot Anxiety Scale (RAS)
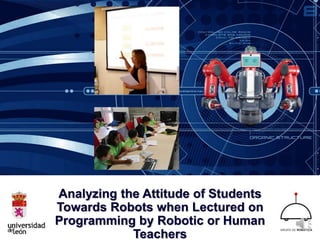
- 5. Experiment HumanTeacher • Programming teacher • >10 years experience • University level RobotTeacher • Industrial robot • Two arms with seven-degree- of-freedom • Torso topped by a head
- 7. Experiment
- 8. Experiment
- 10. Data analysis Negative Attitudes towards Robots Scale (NARS) Interaction with Robots Social Influence of Robots Emotional Interactions with Robots Robot Anxiety Scale (RAS) Communication with Robots Robots’ Behavior Robots’ Discourse
- 11. Data analysis Item ALL STUDENTS No Yes NS NK/NA I1 24.8 50.0 22.9 2.4 I2 53.8 29.5 9.0 7.7 I3 56.7 21.0 21.4 1.0 I4 72.4 9.0 15.7 2.8 I5 87.6 4.8 5.7 2.0 I6 77.1 9.0 11.0 2.9 I7 61.4 17.1 19.0 2.4 I8 29.5 32.9 34.4 7.9 I9 26.2 48.1 21.4 4.3 I10 45.7 23.3 25.2 5.7 I11 27.1 43.3 23.8 5.7 I12 8.1 68.6 19.0 4.3 I13 17.1 48.6 29.0 5.2 Item ALL STUDENTS N al S Q AL I14 30.5 28.1 24.3 8.1 9.0 I15 54.8 20.0 11.0 6.2 8.1 I16 30.1 28.1 18.1 12.9 11.0 I17 29.6 19.0 19.0 17.1 15.2 I18 31.5 19.5 22.9 9.0 17.1 I19 18.1 13.3 17.6 27.1 23.8 I20 20.5 22.9 24.8 17.6 14.3 I21 27.1 22.4 22.4 10.0 18.1 I22 28.1 24.3 20.5 12.9 14.3 I23 19.6 15.2 20.0 21.0 24.3 I24 25.3 20.5 19.0 13.3 21.9 Frequency distribution for NARS Items (NS= Not Sure; NA= Not Answering) Frequency distribution for RAS Items (N=Nothing; al= a little; S=Something; Q=Quite; AL = A Lot)
- 12. Data analysis Levene Sig NH NB XH XB t Item 1 0.328 96 114 1.01 0.788 1.04 0.733 -0.318 0.751 Item 2 0.408 96 114 0.60 0.852 0.75 0.935 -1.168 0.244 Item 3 0.733 96 114 0.61 0.838 0.71 0.849 -0.821 0.413 Item 4 0.735 96 114 0.47 0.794 0.44 0.828 0.241 0.810 Item 5 0.726 96 114 0.19 0.529 0.20 0.613 0.111 0.911 Item 6 0.412 96 114 0.36 0.796 0.42 0.797 -0.512 0.609 Item 7 0.088 96 114 0.80 0.878 0.45 0.813 2.996 0.003 Item 8 0.186 96 114 0.07 0.824 1.13 0.901 -0.497 0.620 Item 9 0.827 96 114 1.11 0.780 0.97 0.825 1.264 0.208 Item 10 0.593 96 114 0.93 0.976 0.89 0.963 0.342 0.810 Item 11 0.092 96 114 1.13 0.866 0.99 0.800 1.167 0.244 Item 12 0.005 96 114 1.22 0.699 1.16 0.560 0.401 Item 13 0.094 96 114 1.19 0.850 1.25 0.738 -0.610 0.542 Results of the comparison of average values for the group that has a human teacher and the one that has Baxter for NARS Items
- 13. Results 87-89% do not feel very nervous just standing in front of a robot . Interaction with Robots 47-48% are not especially worried about the future role of robots in our society. Social Influence of Robots 43-48% feel comforted being with robots that have emotions. Emotional Interactions with Robots NARS
- 14. Results Students seem not to be worried about the behavior of robots during a conversation. Communication with Robots Younger students seems to worry when they are interacting with robots. Robots’ Behavior Younger students are more worried about talking properly with robots than older ones. Robots’ Discourse RAS
- 15. Conclusion
- 16. Conclusion
Editor's Notes
- Six months coming to class each day for classes Jill Watson, a professor of the course 'online' on software design. Jill answered questions, gave explanations, raised doubts ... Jill was such a good teacher that even a student of the Technological University of Georgia would nominate as the best teacher of the university. There was nothing to suspect that behind responses Jill it really was a robot. I'm going to talk about the attitude of students towards robots in educational environment.
- Nowadays there are many projects that aim to promote computational thinking in students to teach computing, exploring different programming environments, developed tools, and generated material to these students. Several of these projects uses robots for this goal.
- We are interested on exploring the relationships between age and previous experience using IT-technology for the acceptance of robots as teachers. In particular, this work analyses the performance of a group of students when the same classes were taught by a robot or by a human teacher. These students have participated in a technology campus at the University of leon.
- In this paper we will focus in the attitude towards robots. We are used Two standardized tests to obtain this goal. We have proposed NARS scale to evaluate these attitudes in different experiments. Also we have studied the RAS scale to measure people’s anxieties. The RAS was developed to determine human anxiety toward robots evoked in real and imaginary HRI situations.
- In order to evaluate students’ attitude towards robots we designed an experiment where the same computational concepts are taught by a robot and by a human teacher. The human teacher was a programming teacher with more than ten years of experience in programming courses at university level. The robot teacher was a Baxter robot. Baxter is an industrial robot that consists of two seven degree-of-freedom arms attached to a torso topped by a head made up by a display.
- The experiment was organized in two different scenarios; one with a human teacher and another with a robot teacher. The same script was used in both. First, teachers gave a brief lecture using the same outline and the same slides. Then, teachers explained the exercises that students should carry out. Last, students would make the exercises and fill a questionnaire.
- For showing the repetition, Baxter takes a ball from a ramp and drops it on a box repeatedly, weather there is a ball or not. For showing the condition, Baxter takes a ball from a spot only if there is a ball on that spot. At the end of the explanation, both teachers would explain the exercises to be performed by students.
- For practicing both repetition and condition, a practical exercise was proposed. Problem had to be solved using Scratch programming environment because they have been learning about it in the Summer Camp where they were participated. The exercise consisted of building a swimming pool in a Minecraft world. Minecraft was chosen because it is a very popular game among children, it has clearly recognizable graphics and uses different types of blocks.
- The total number of students that participated in the experiment was 210 , 114 of the them had Baxter as a teacher and the 96 remaining had a human teacher. Students' age range was from 6 to 16. Experiment results have been analyzed as a whole and also by groups. Groups division were made according to Spanish Educational Law: Primary1 from 6 to 9 years old, Primary2 from 10 to 13 and Secondary from 13 to 17 years old.
- The NARS questionnaire has been used in similar analysis of robotic systems for education and measures the psychological states reflecting opinions that people used to have about robots. Presents three types of questions: Negative Attitude toward Interaction with Robots. Negative Attitude toward the Social Influence of Robots. Negative Attitude towards Emotional Interactions with Robots. The RAS questionnaire measures robot anxiety, which is defined as “emotions of anxiety or fear preventing individuals from interaction with robots having functions of communications in daily-life”. The RAS questionnaire presents also three subscales: Negative Attitude toward Communication with Robots. Negative Attitude toward Robots' Behavior. Negative Attitude toward Robots' Discourse.
- A summary of the frequency answers to NARS que can be seen in the following tables. These tables show the distributions of the different answers for each item. In the paper you can see the distributions of the different answers for each item organized by groups defined by age. It is possible to see differences in the attitudes towards robots between the students’ answers depending on the age group.
- Table shows the results of the statistical analysis of the NARS (Items 1-13) answers when comparing the human lectured group vs. the robot lectured one. It also includes statistics about the number of students that interacts with the human teacher and with Baxter Robot, the average value of the item for each group, the standard deviation, the contrast variable and the bilateral signification.
- Now we can see the results about the NARS questionnaire. First we analyse the Interaction with the robot. In this case most of the students feel comfortable interacting with robots. It should be noted that most of the students assert they do not feel very nervous just standing in front of a robot. About the social influence of robots, the results show that students are not especially worried about the future role of robots in our society or about how they would evolve. In the case of emotional interaction with robots, the students feel comforted being with robots that have emotions. This could be caused by cultural influence.
- The results about the RAS questionnaire about the communication with robots show that students seem not to be worried about the behavior of robots during a conversation, or if they are understanding what we are telling to them. About robots’ behavior and how robots move, the strong they are, or what they are going to do when you are interacting with them seems to worry younger students. Finally about robots’ discourse, the percentages of answers for this group are balanced in most ages, although it is possible to see that younger students are more worried about talking properly with robots than older ones. This can be explained because they have interacted less with technology in school and because they have less knowledge about the possible ways to talk with a robot.
- In conclusion, we have found some differences that we attribute to the ignorance about how real robots work. When the students interact with a real robot, they are aware of their current limitations and their fears are alleviated. The other goals of the paper are related to the factors that affect the perception of students towards robots. The results showed low evaluations to robots as teachers. What will happen in the future? I don’t know.