This document describes a thesis presented by Tewodros Adaro to Addis Ababa University for a Master of Science degree in Physics. The thesis investigates using spectroscopic pH measurement with the dye phenol red. It provides background on absorption spectroscopy and Beer's law. The experimental section details preparing buffer solutions, phenol red solutions, and measuring absorption spectra of phenol red in buffers and samples. Results show the color response of phenol red to pH and absorption spectra in buffers and spring waters. The dissociation constant of phenol red is determined and used to calculate pH values, which are compared to stated values with an error of 0.005 pH units.

![7
List of tables
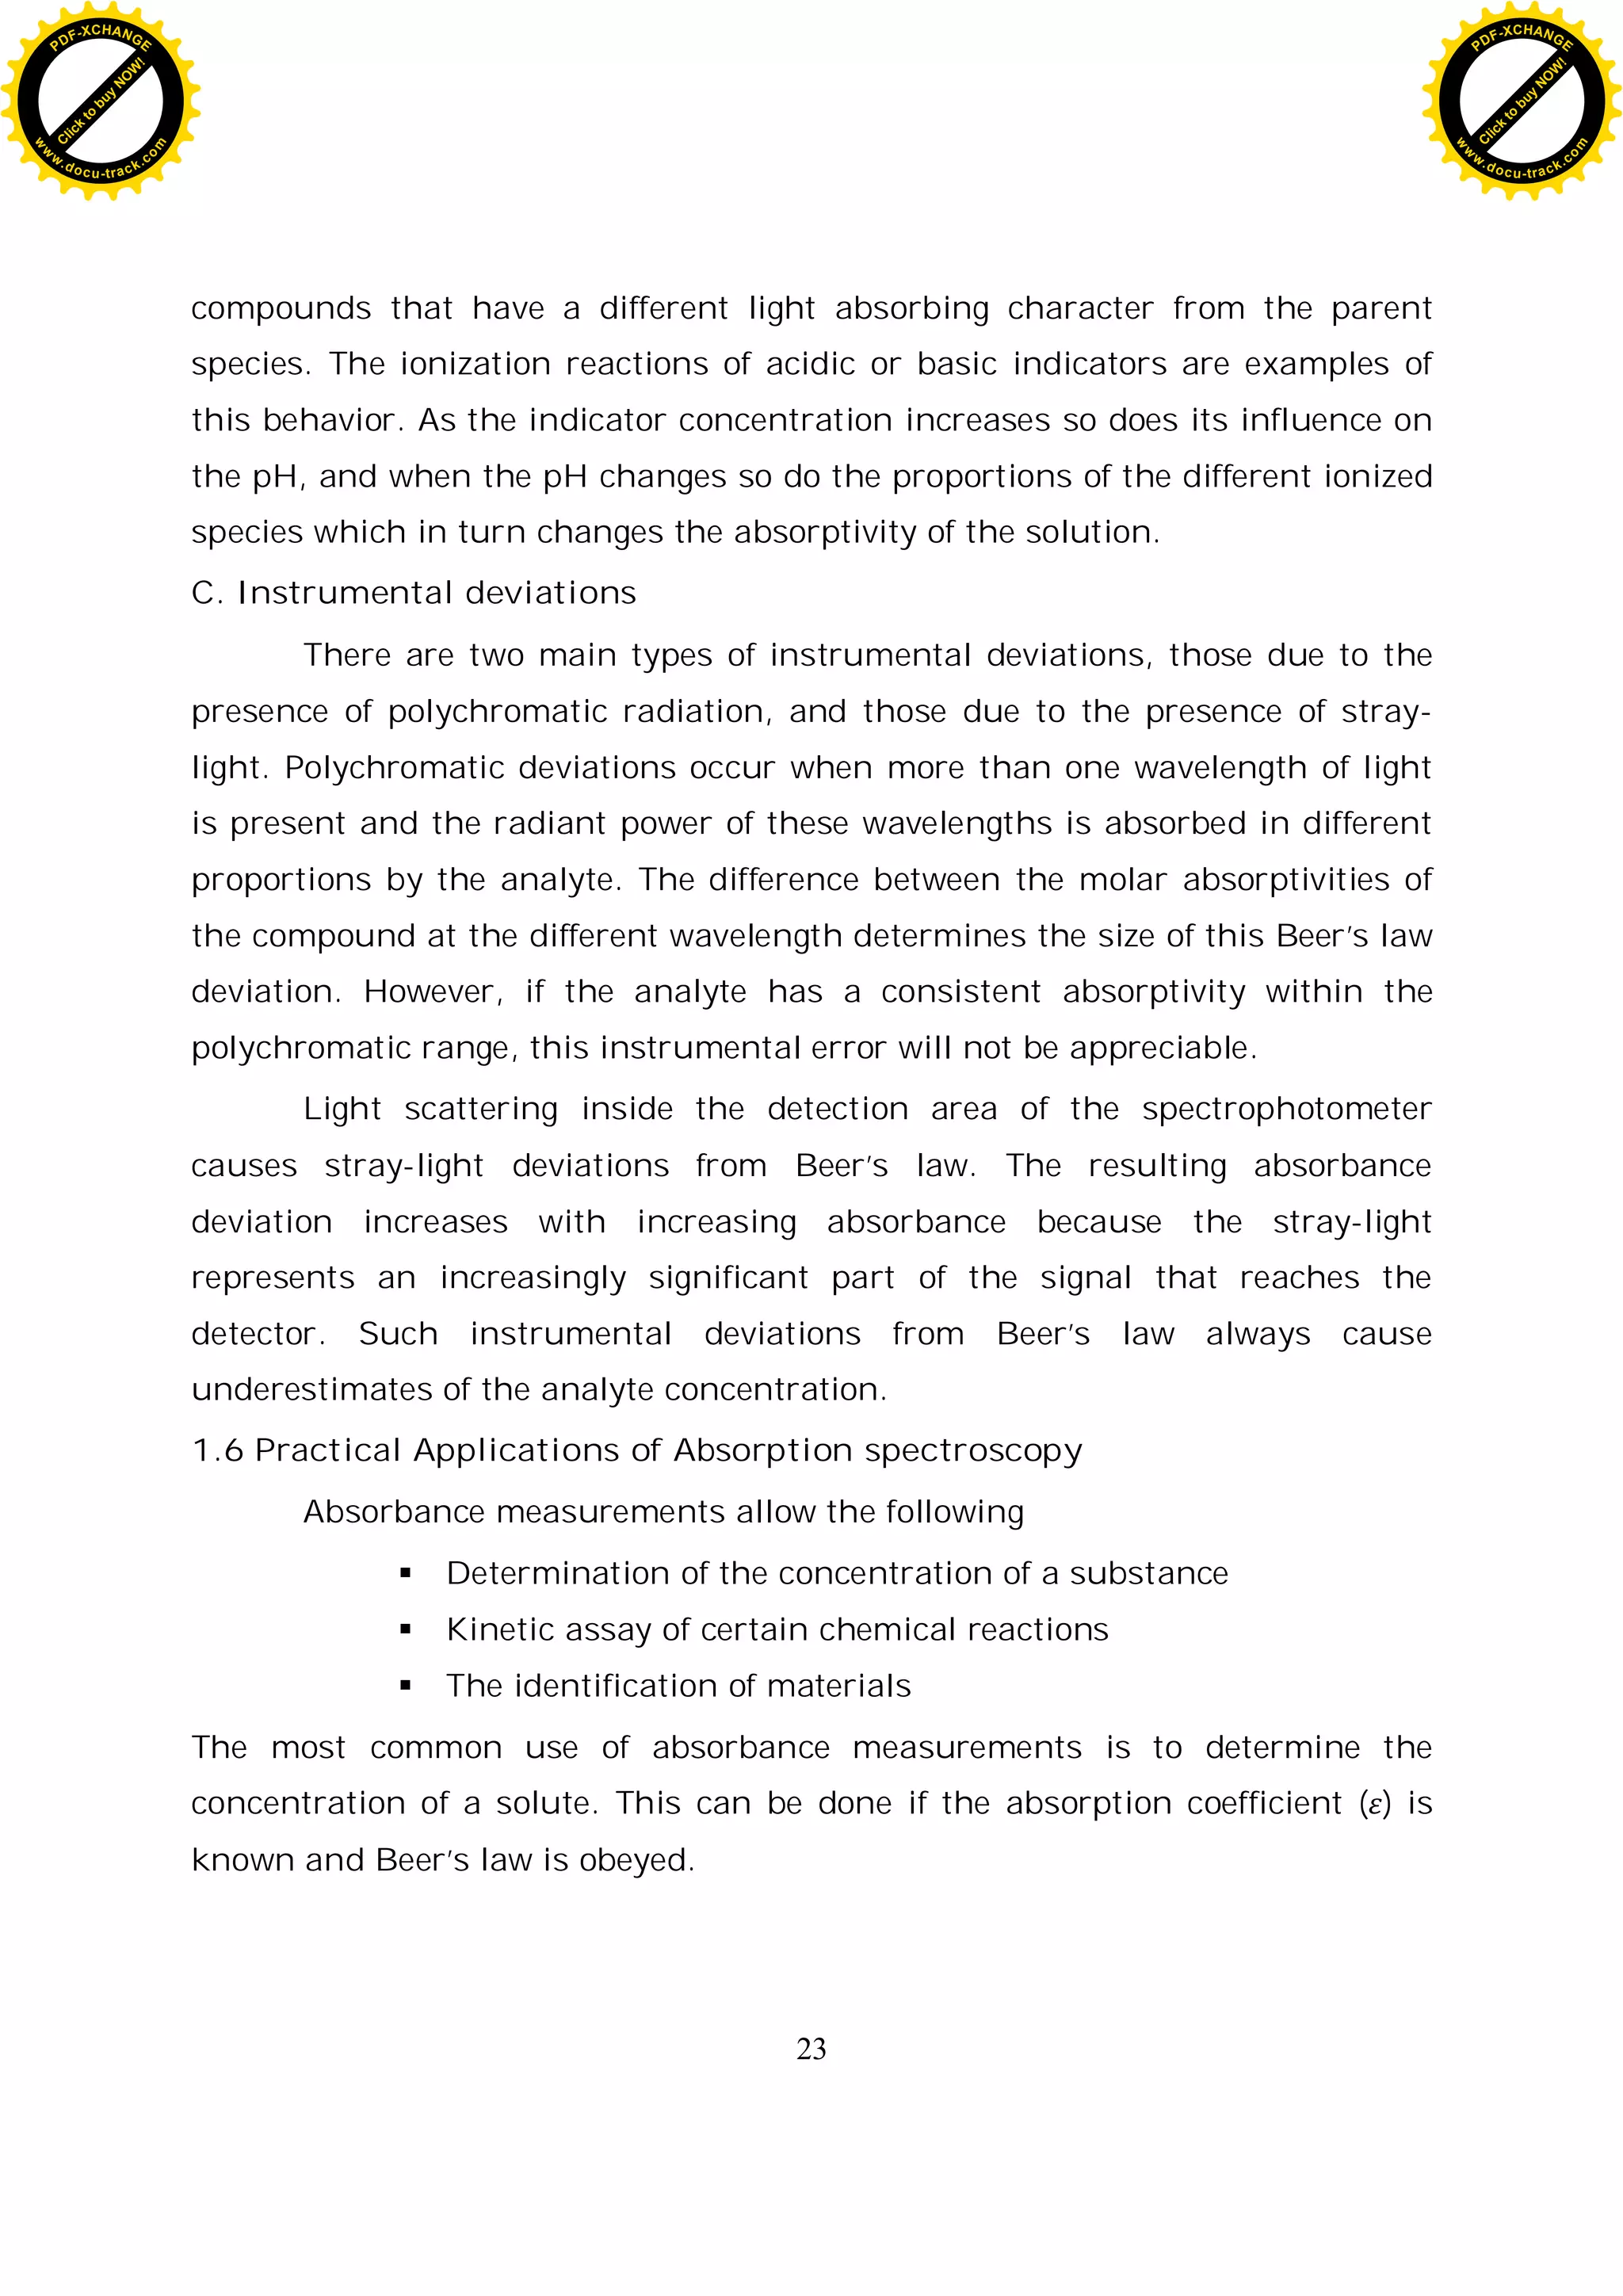
Table-2.1 color of different indicators dye 19
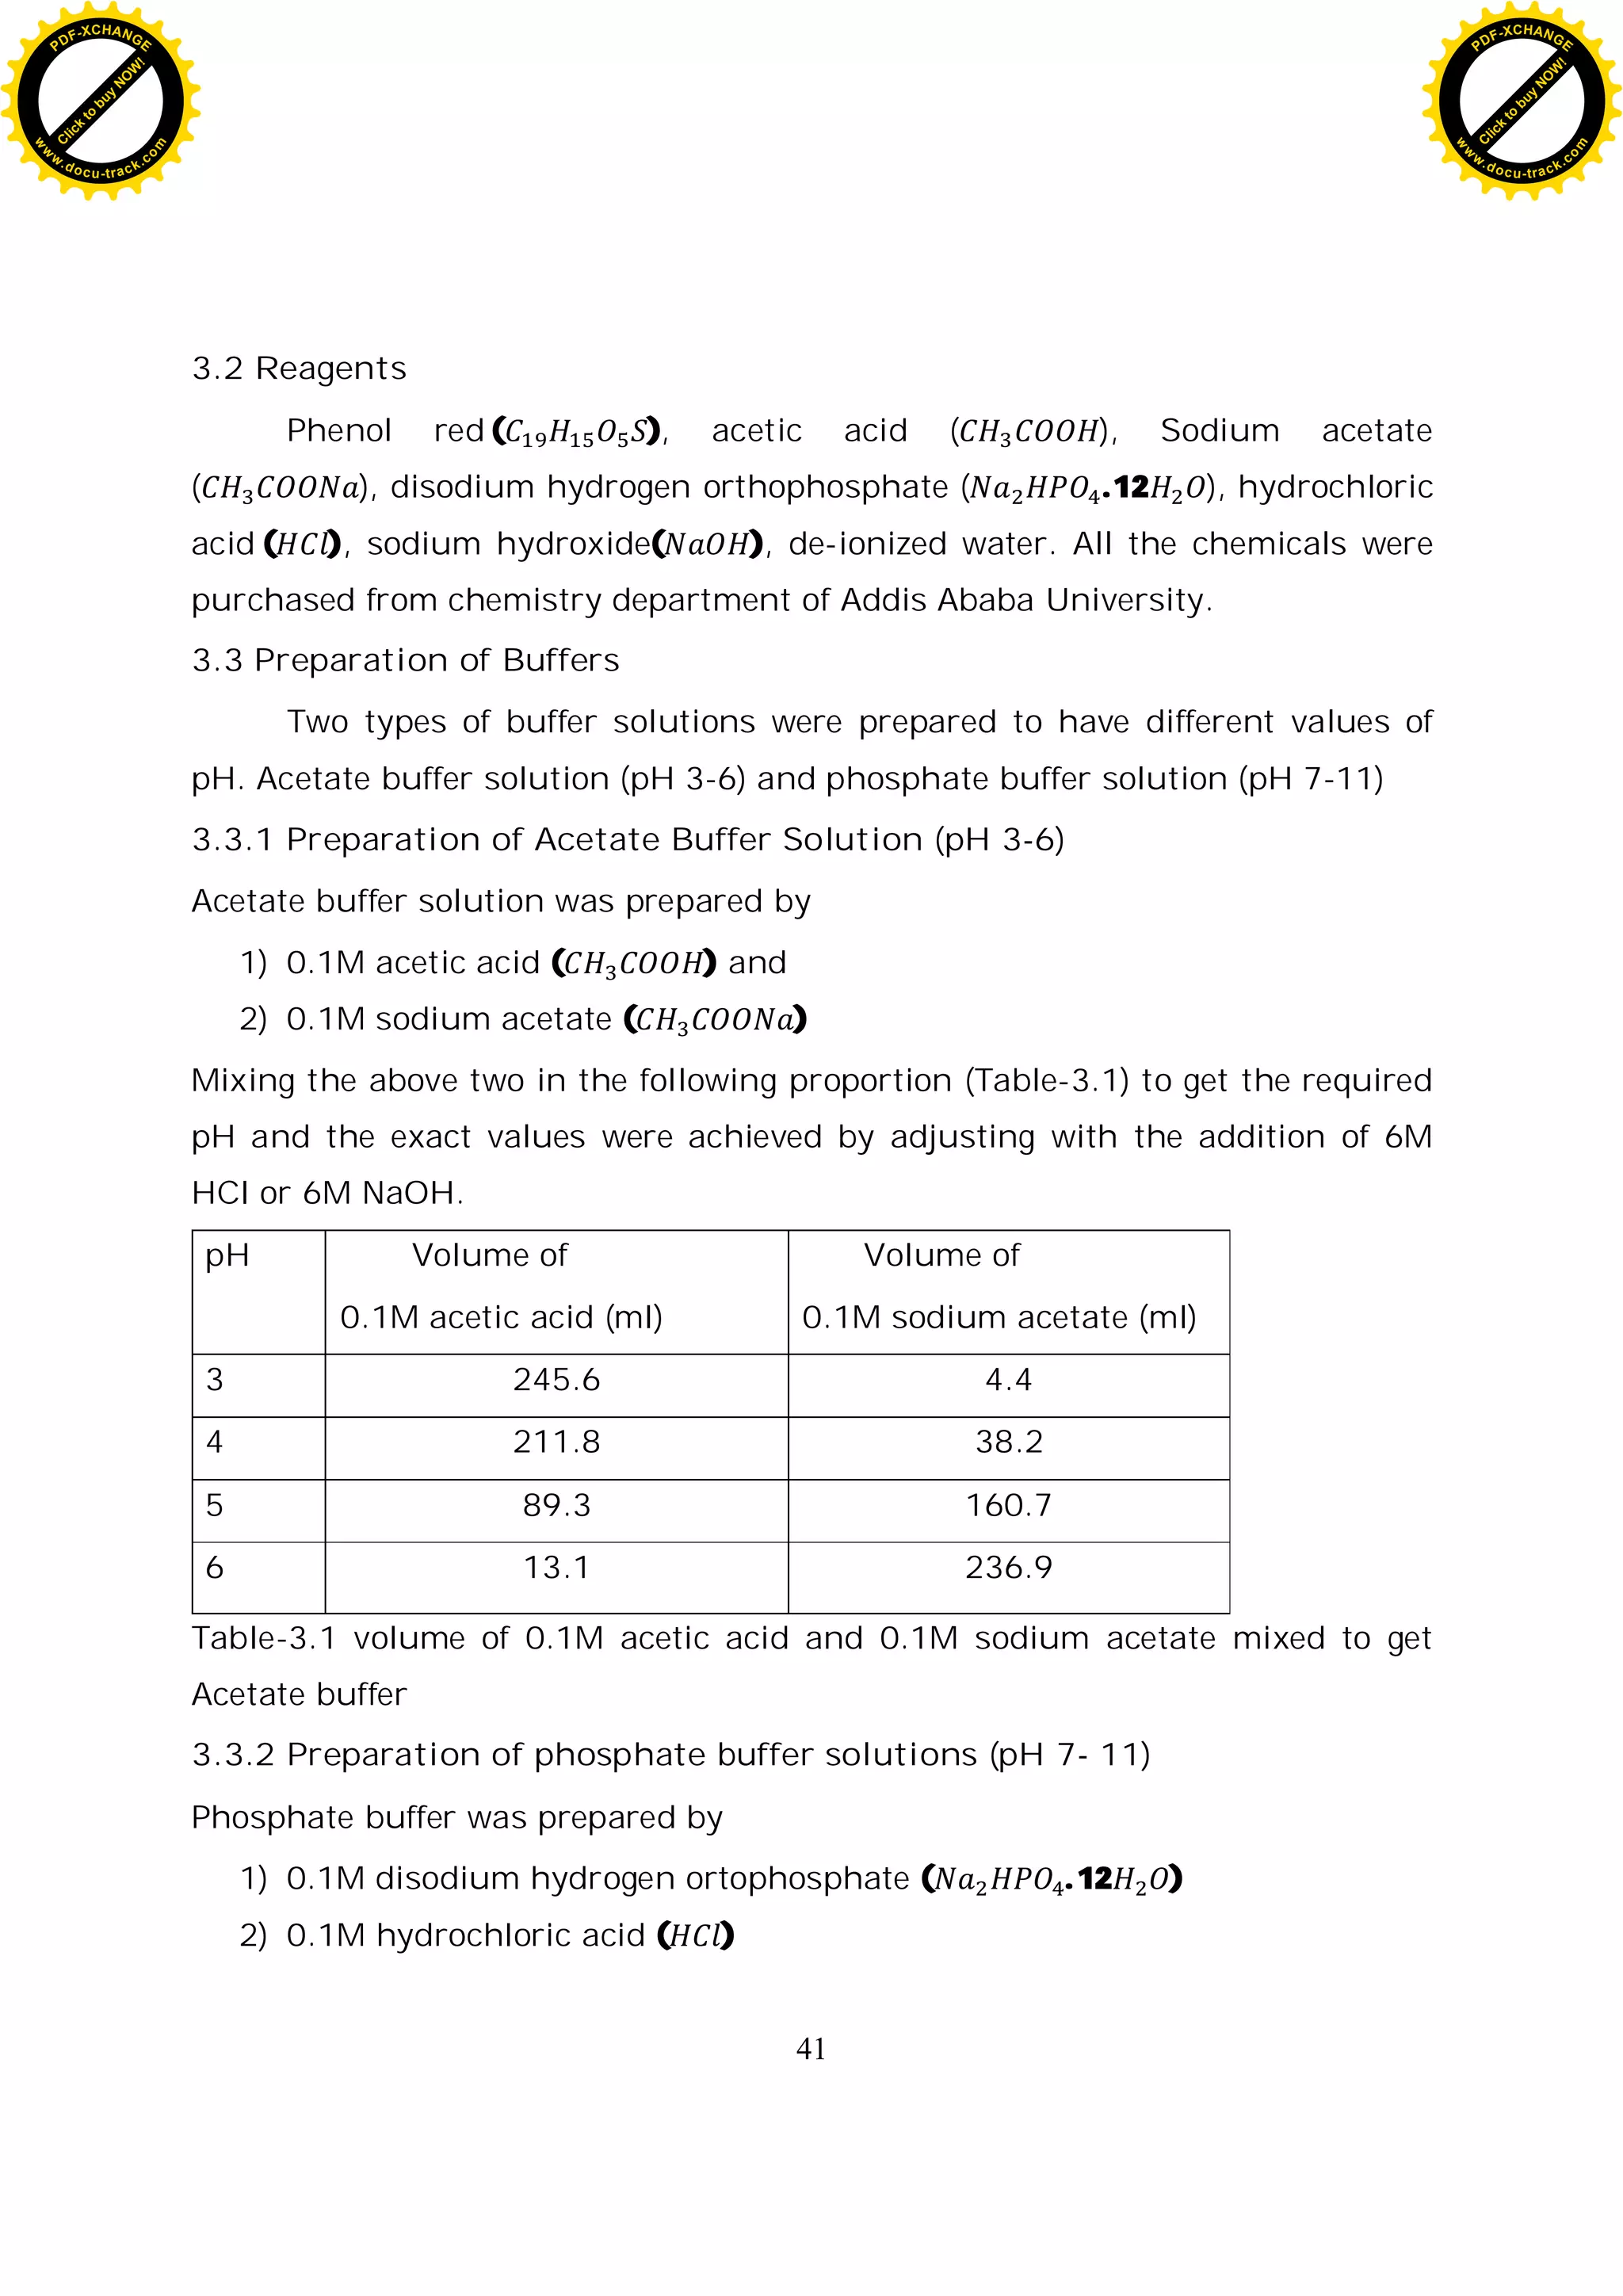
Table-3.1 volume of 0.1M acetic acid and 0.1M sodium acetate
mixed to get Acetate buffer 32
Table-3.2 volume of 0.1M disodium hydrogen orthophosphate,
0.1M hydrochloric acid and 0.1M sodium hydroxide
to get Phosphate buffer 33
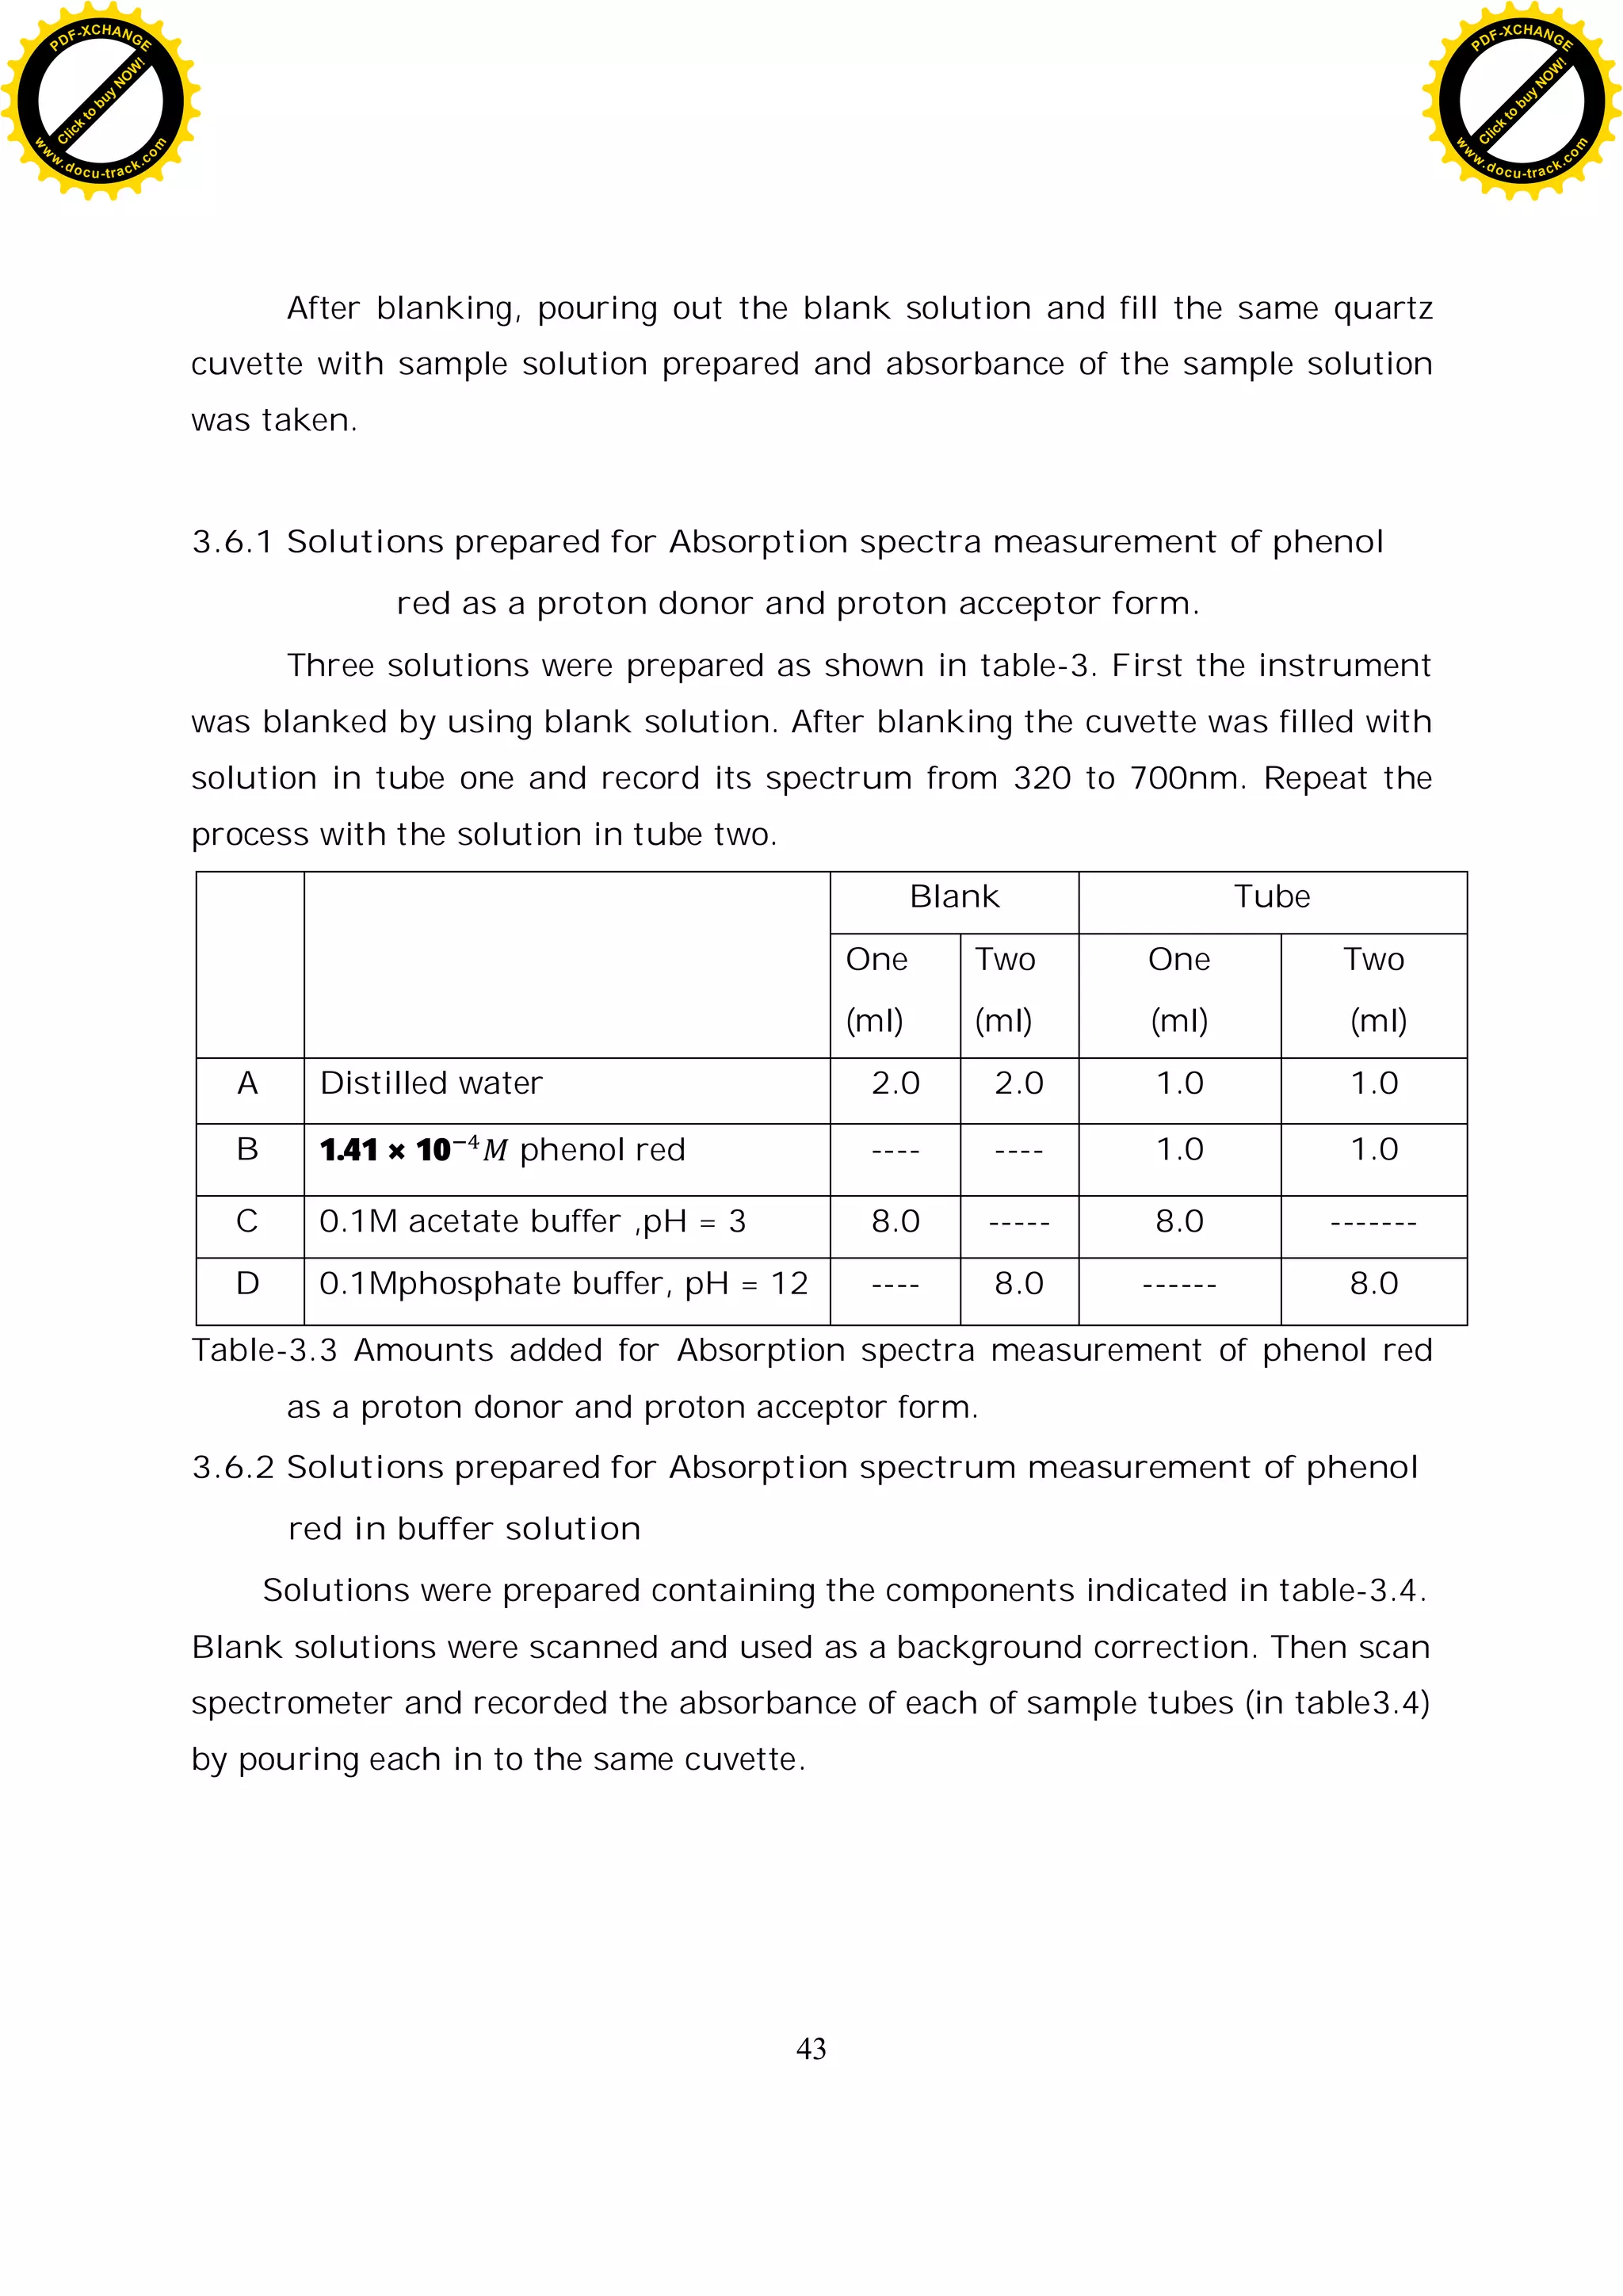
Table-3.3
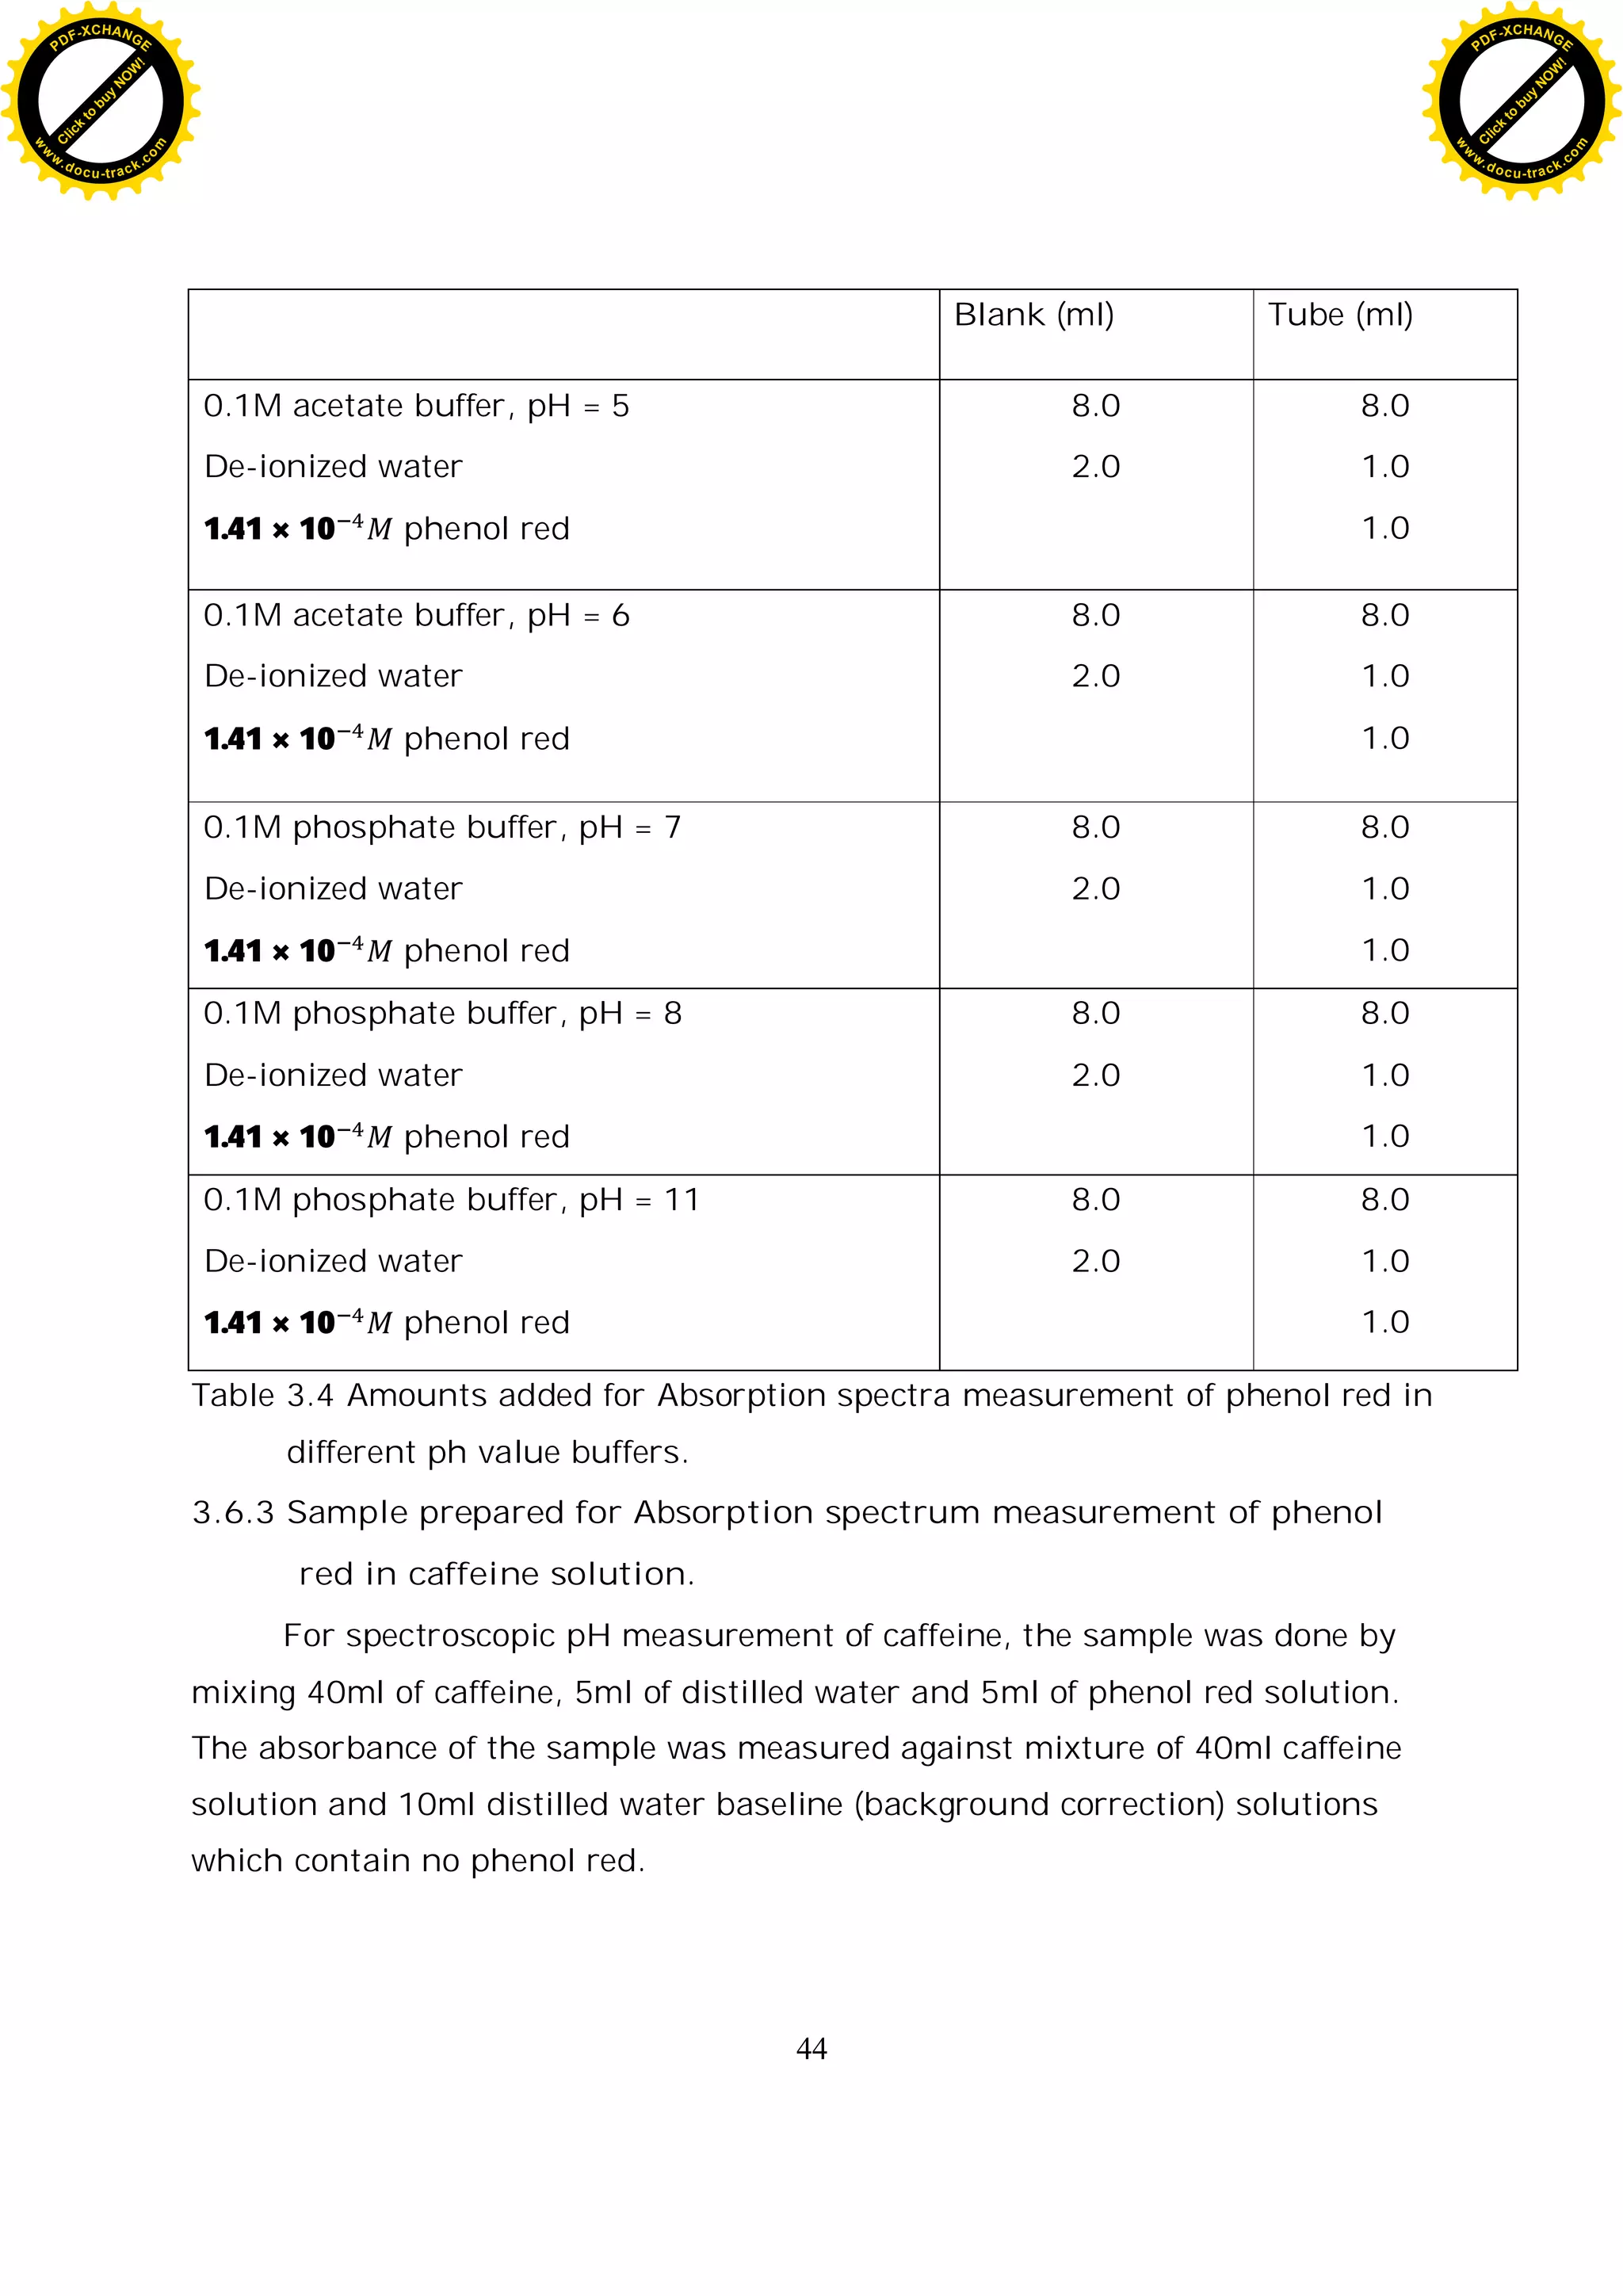
Table-3.4
Table 4.1 absorbance of phenol red at = 432.0nm and
= 558.4nm in pH=3.0 and pH=12 buffer solutions 38
Table 4.2 absorbance of phenol red at = 432.0nm and
= 558.4nm in pH 5,6,7,8 and11 buffer solutions 39
Table 4.3 absorbance of phenol red at = 432.0nm and
= 558.4nm in five types of packed drinking spring-water. 40
Table 4.4 calculated value of log
[ ]
[ ]
for various pH value of
buffer solution. 46
Table 4.5 calculated pH values for packed drinking spring-water 48
Table 4.6 calculated pH and standard deviation (sd) values
for packed drinking spring-water 48
Table 4.7 comparison in pH of spectroscopically calculated and
the stated values for spring-water. 49
List of figures
Fig-1.1 Transitions to excited state 8
Fig-1.2 Light absorption and transmission by phosphate-molybdenum
blue compound. Schematic diagram showing maximum light
absorption (and minimum light transmition) at =640nm. 11
C
l
i
c
k
t
o
b
u
y
N
O
W
!
PDF-XCHANGE
w
w
w
.docu-track.c
o
m
C
l
i
c
k
t
o
b
u
y
N
O
W
!
PDF-XCHANGE
w
w
w
.docu-track.c
o
m](https://image.slidesharecdn.com/tewodrosadaro-220410151640/75/Spectroscopic-pH-Measurement-Using-Phenol-Red-Dye-7-2048.jpg)
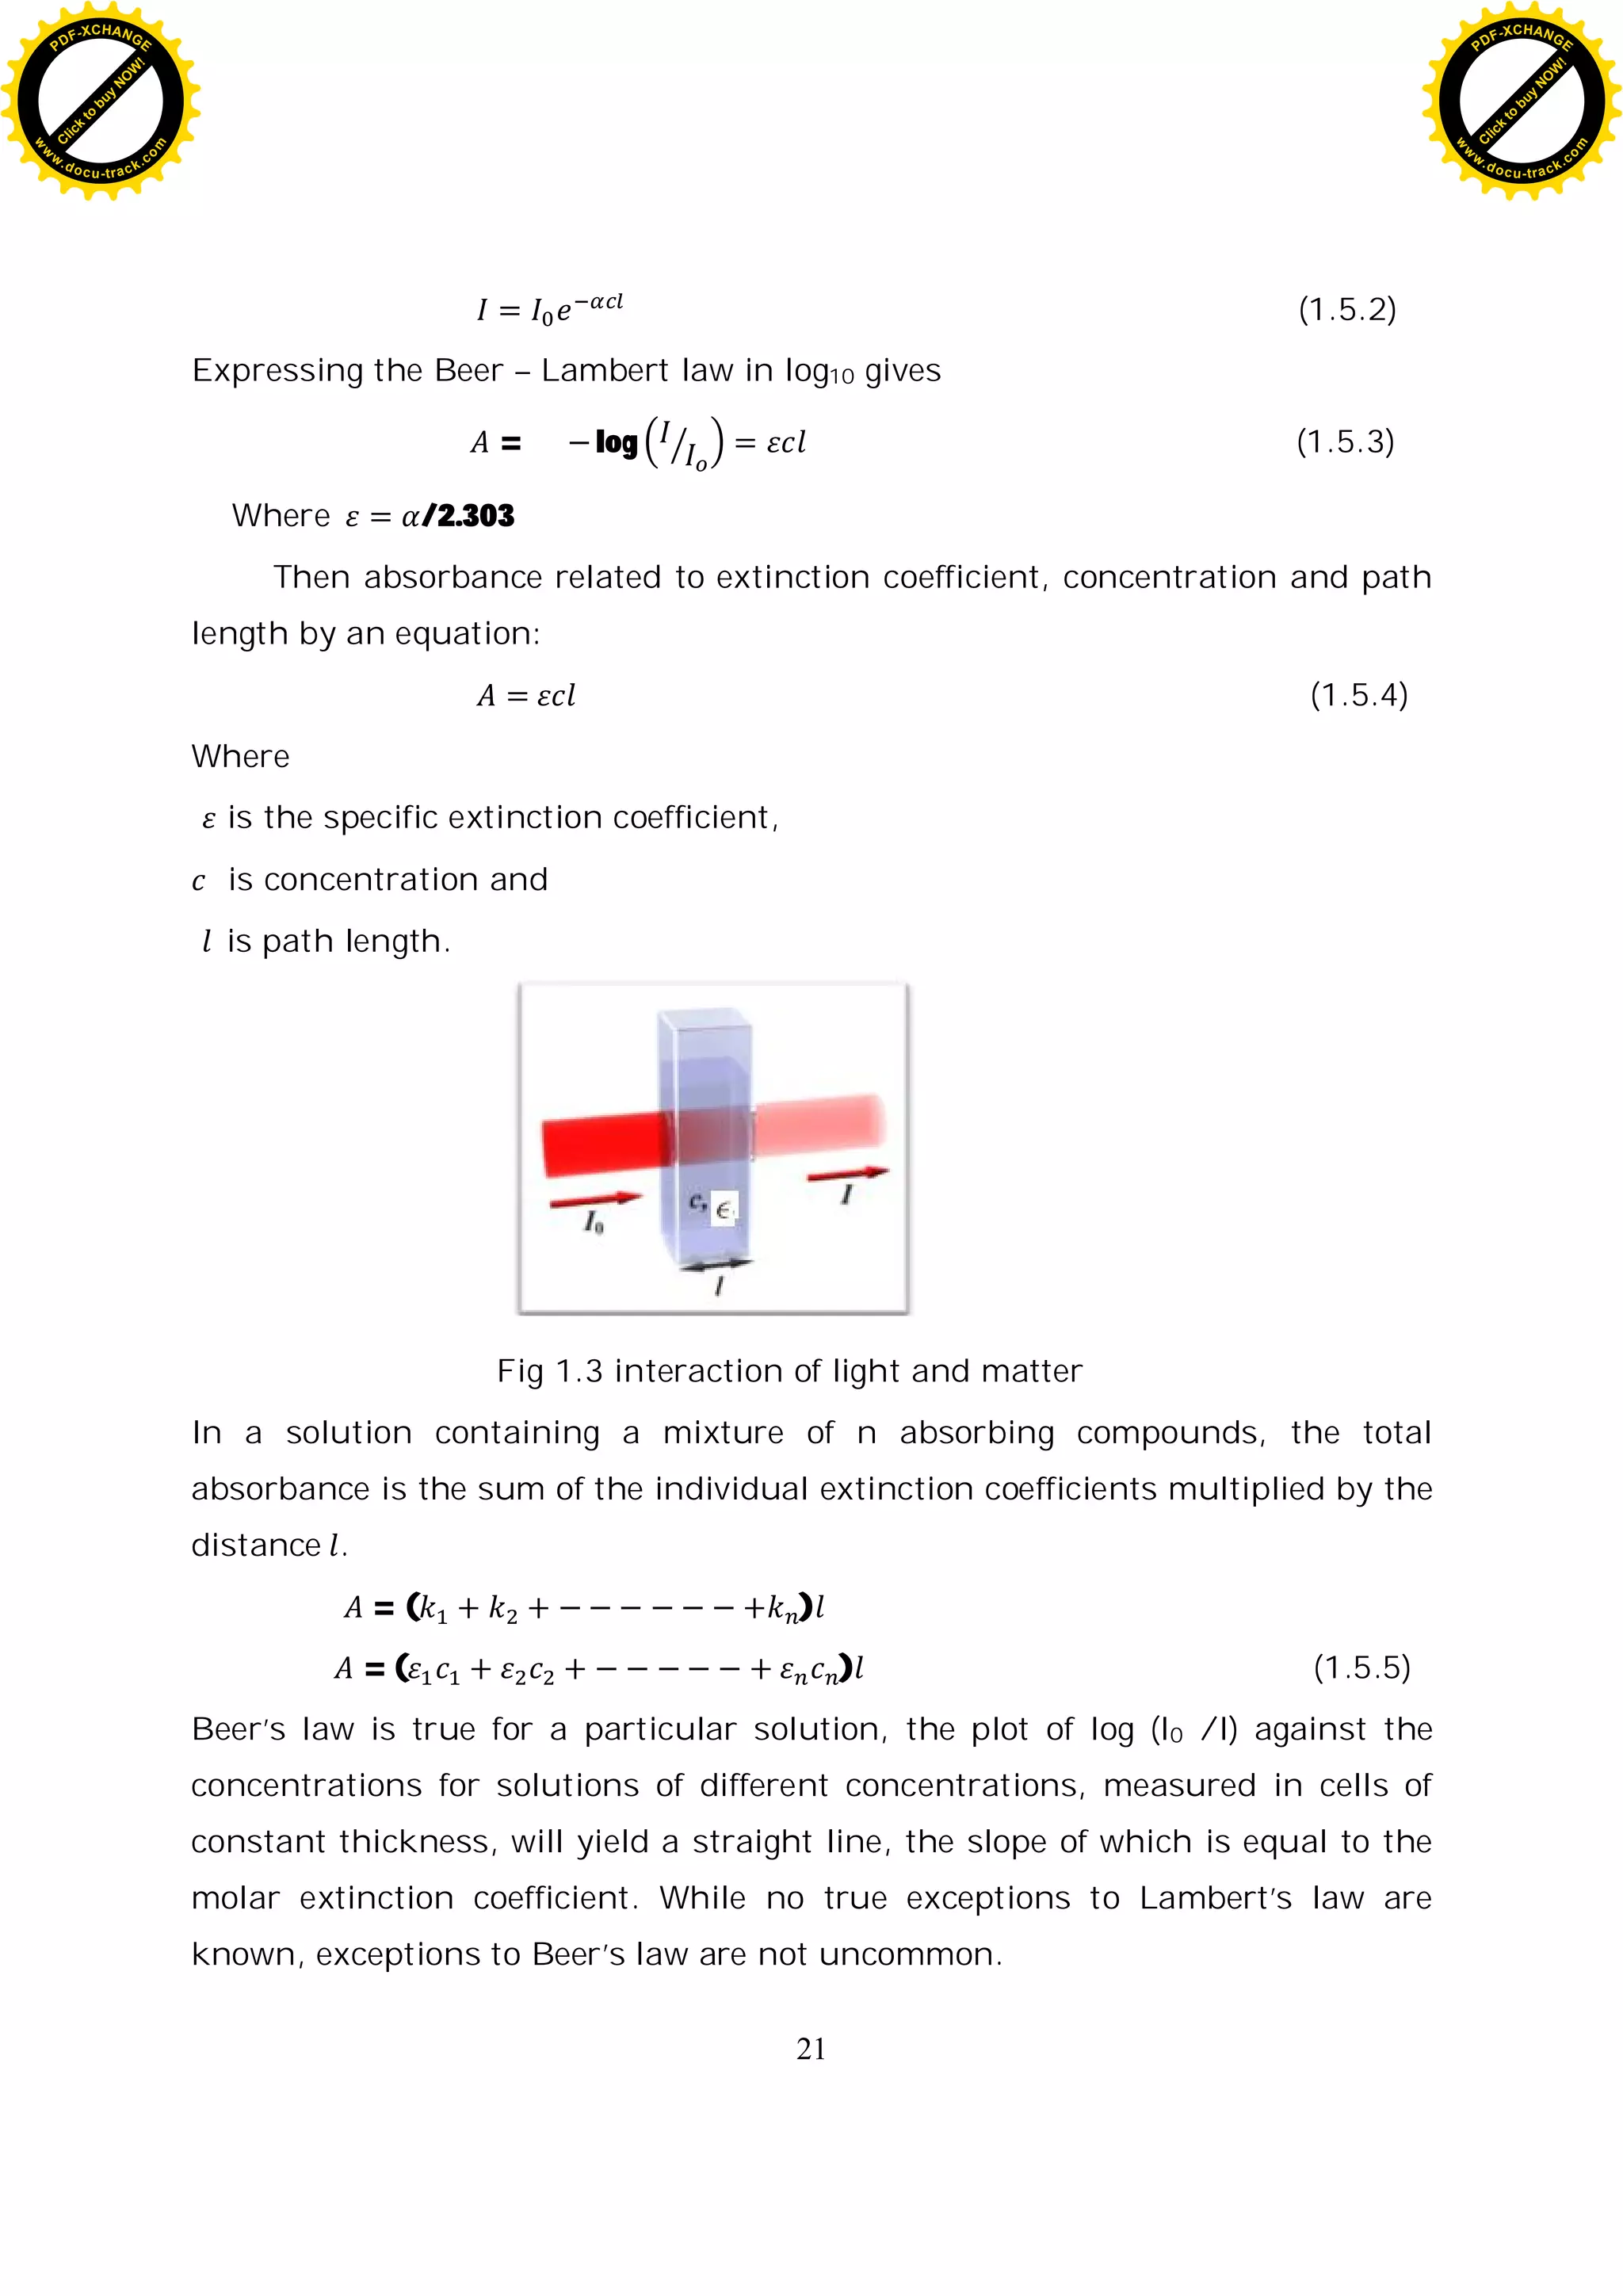
![8
Fig-1.3 Interaction of light and matter 12
Fig-2.1 (a) Color response of phenol red at different pH value
(b) Powder form of phenol red
(c) chemical structure of phenol red. 20
Fig-3.1. Basic Experimental set up of spectrometer 31
Fig-4.1 Absorption spectrum of pure acidic and
pure basic form of phenol red 37
Fig-4.2 Absorption spectrum of phenol red
in different pH value buffer solution 38
Fig-4.3 Absorption spectrum of phenol red
in different packed spring water 39
Fig-4.4 Spectra of (a) the undissociated and (b) the dissociated
form of phenol red 42
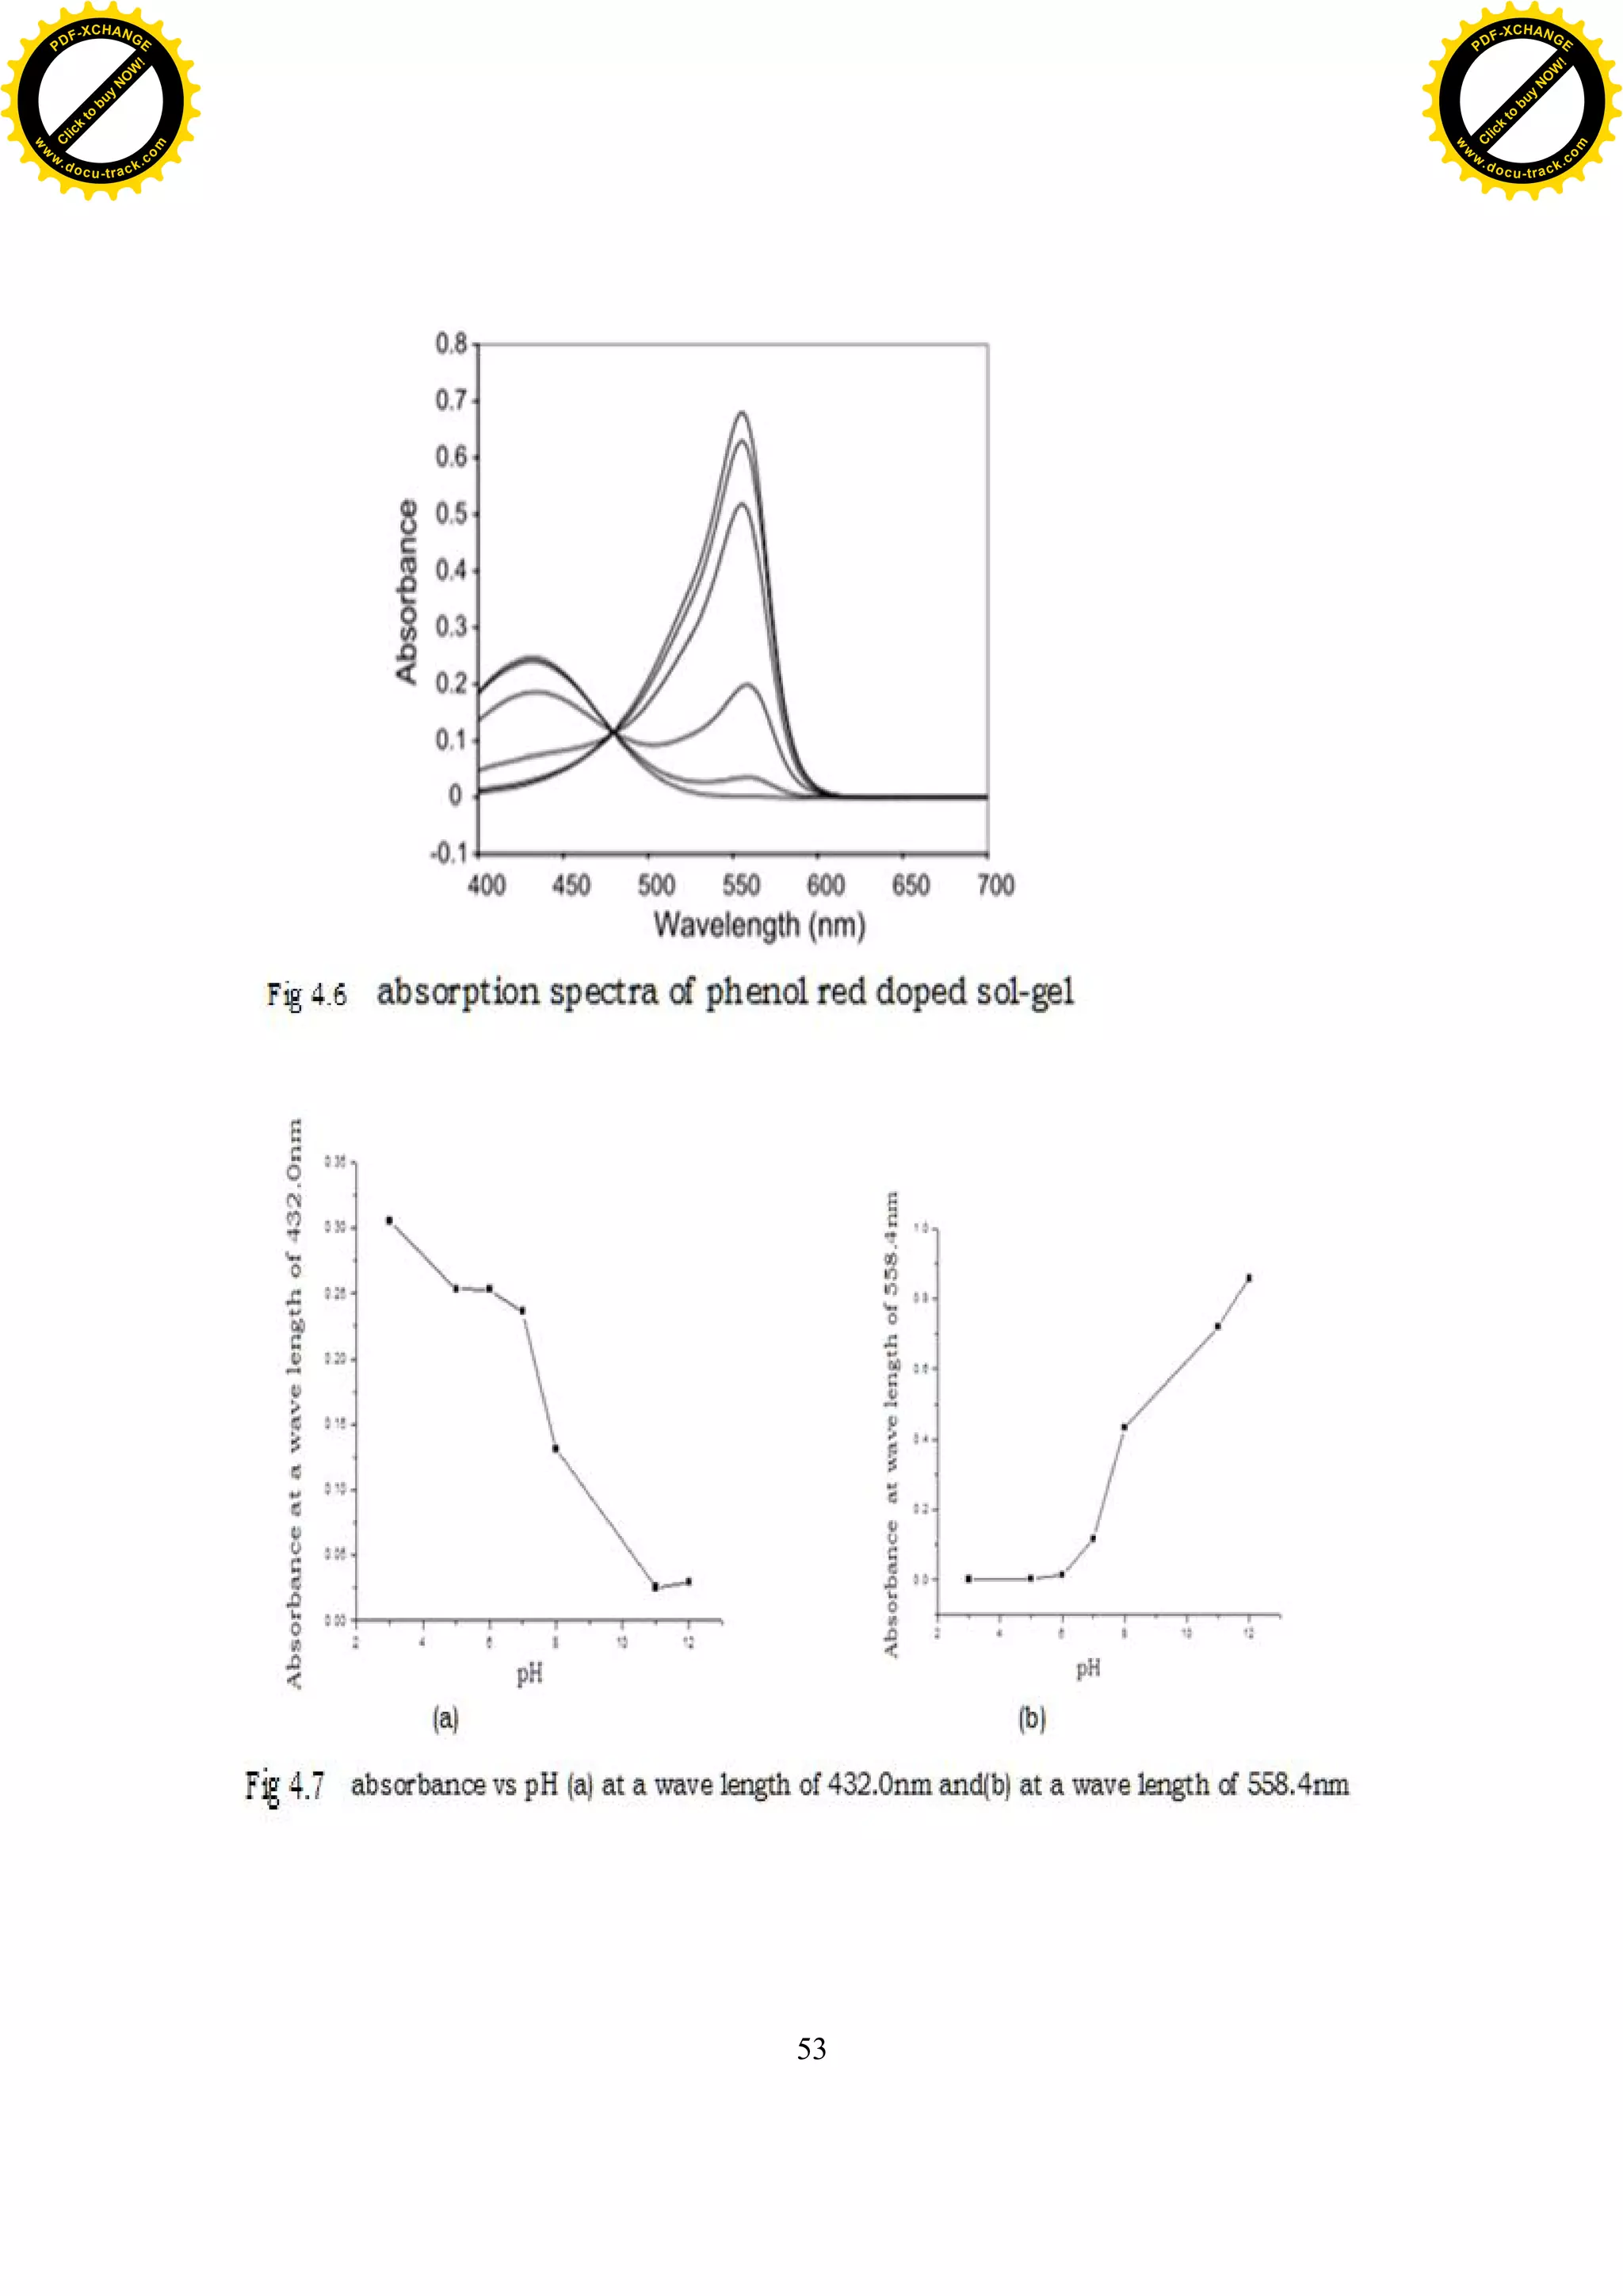
Fig-4.5 Absorption spectra of phenol red doped sol-gel 43
Fig-4.6 Absorbance vs pH (a) at a wave length of 432nm and
(b) at a wave length of 558.4nm 43
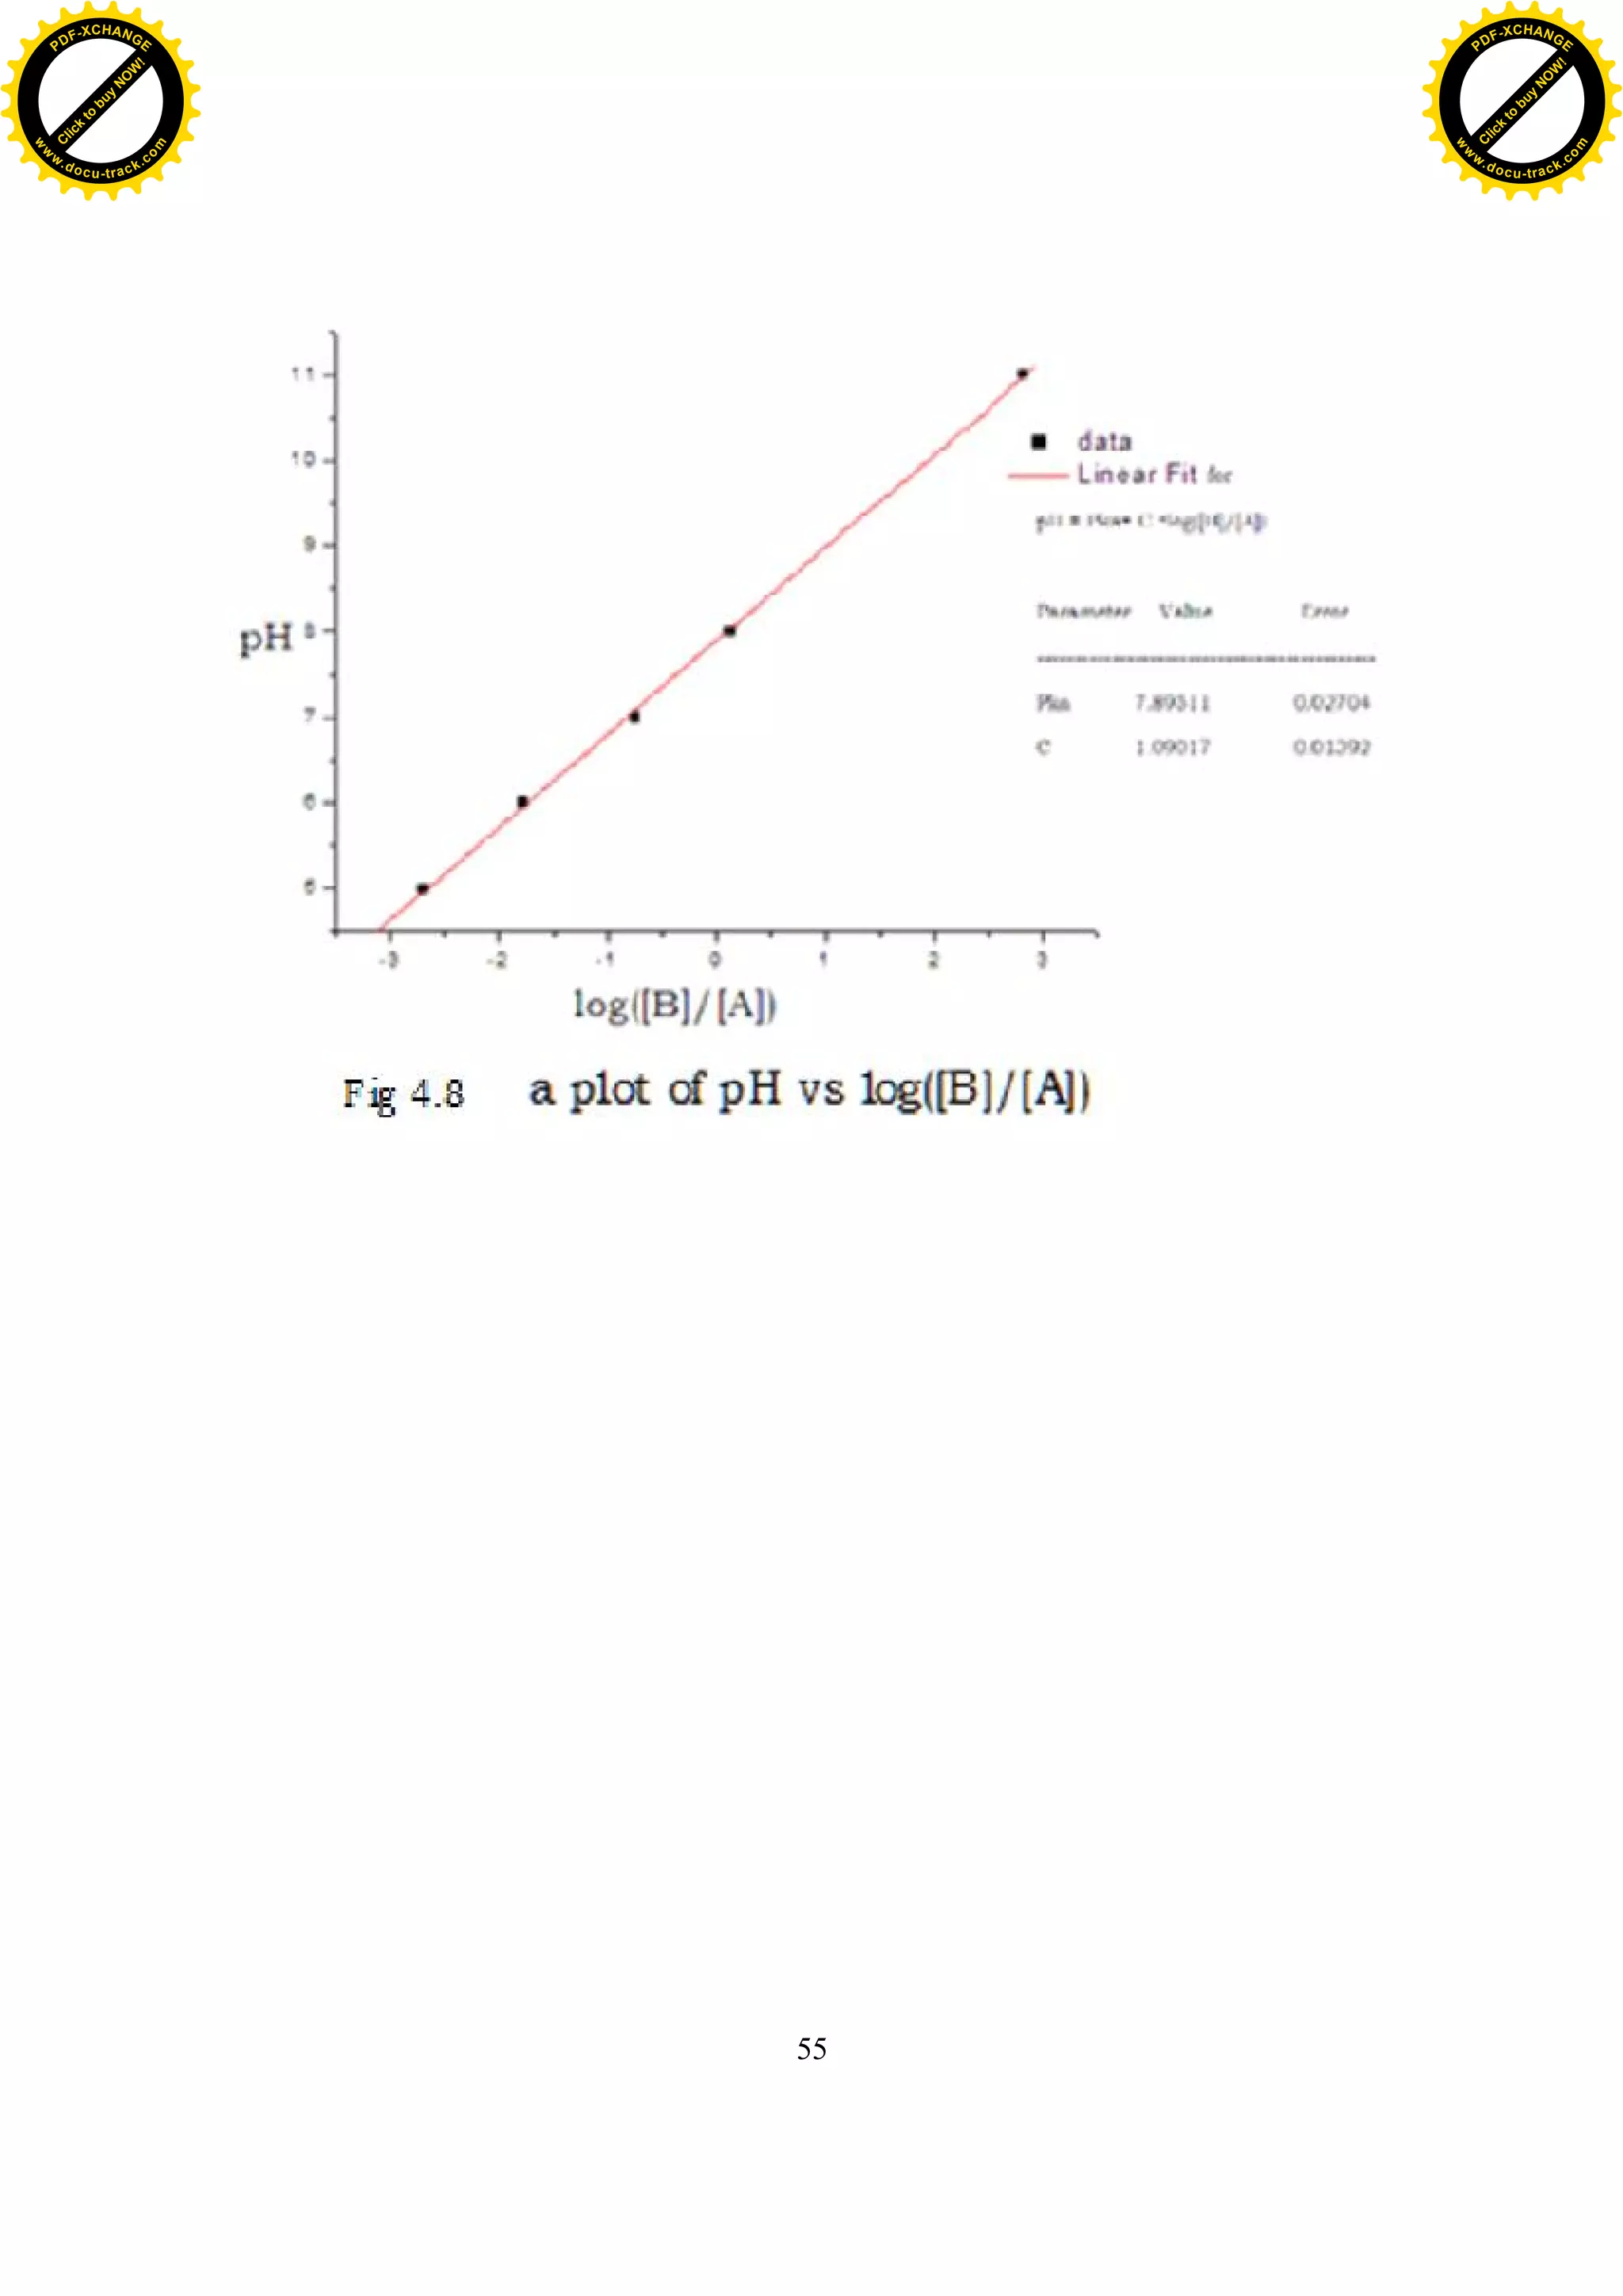
Fig-4.7 A plot of pH vs log
[ ]
[ ]
. 45
C
l
i
c
k
t
o
b
u
y
N
O
W
!
PDF-XCHANGE
w
w
w
.docu-track.c
o
m
C
l
i
c
k
t
o
b
u
y
N
O
W
!
PDF-XCHANGE
w
w
w
.docu-track.c
o
m](https://image.slidesharecdn.com/tewodrosadaro-220410151640/75/Spectroscopic-pH-Measurement-Using-Phenol-Red-Dye-8-2048.jpg)
![10
Introduction
Accurate measurement of pH is important in several diverse field, such as
process control, reaction equilibrium and kinetics, environmental research to
monitor sea water chemistry and natural water quality, biomedical research
and in oilfields [1]. Measurement of pH is one of the most important and
frequently used tests in water chemistry . Practically every phase of water
supply and waste water treatment need pH determination e.g. acid-base
neutralization, water softening, precipitation, coagulation, disinfection, and
corrosion control, is pH dependent. pH is used in alkalinity and carbon dioxide
measurements and many other acid base equilibra.
The International Union of Pure and Applied Chemistry (IUPAC) have issued
guidelines for the standard potentiometric technique for pH measurements.
These methods and calibrating standards are, however, recommended only for
278-3230k, 0.101325Mpa and ionic strengths below 0.1mol/kg water [2]. The
reasons for these measurement constraints are the uncertainty in liquid
junction potential and reference electrode stability at high temperature,
pressure and ionic strength and the lack of calibrating standards.
Spectroscopic measurement of pH with very high accuracy using pH-
sensitive dye is a well established laboratory technique for ambient conditions
since the early 1900s [3, 4]. More recently, this technique has been shown to
improve precision for seawater pH measurements [19]. Using equimolal tries
buffers for total pH scales; dye equilibrium dissociation constant was
characterized at 0.010325Mpa pressure as a function of temperature (2930K to
3030K) and salinity over the narrow salinity range characteristics of sea water
(30 to37 salinity ranges corresponding to ionic strength of~0.53 to0.66 mol/kg
water). Yao and Byrne [5] have also applied this technique for fresh water pH
measurement, where potentiometric methods can prove to be problematic.
Using phosphate buffers, the dye equilibrium dissociation constant was
characterized at 0.101325Mpa pressure as a function of temperature (2830k to
3030k) and ionic strength (0 to .016 mol/ kg water). The Davies equation,
C
l
i
c
k
t
o
b
u
y
N
O
W
!
PDF-XCHANGE
w
w
w
.docu-track.c
o
m
C
l
i
c
k
t
o
b
u
y
N
O
W
!
PDF-XCHANGE
w
w
w
.docu-track.c
o
m](https://image.slidesharecdn.com/tewodrosadaro-220410151640/75/Spectroscopic-pH-Measurement-Using-Phenol-Red-Dye-10-2048.jpg)
![11
which is valid at low ionic strengths, was used to calculate the activity
coefficients. Marty et al. [6] describe an autonomous spectroscopic pH sensor
for in situ measurements of natural waters that have low ionic strength (~0.001
mol/kg water) and temperature range of 277-2930k. E.Wang et al. [7] describe
a fast and long term optical sensors for pH based on sol-gels that the sensor
has a response time of less than 20s, the response completely reversible and its
life time is over 12 months.
These references cite the advantage of the spectroscopic technique with
respect to low-drift, reproducibility, and rapidness of the measurement as
compared to the standard glass electrodes. Furthermore, since the
measurement depends only on the molecular properties of the indicator dye,
once the dye equilibrium dissociation constants have characterized, it eliminate
the need for calibration prior to every measurement.
The spectroscopic method depends up on the direct determination of the
ratio of molecular species (neutral molecule) to ionized species. In this respect,
the data are no more different from those obtained by potentiometric titration;
the thermodynamics of ionic and anionic interaction do not depend on the
experimental method used to determine them [8]. For this purpose, the
spectrum of non-ionized species is obtained, using a buffer solution whose pH
is so chosen that the compound to be measured is present wholly as this
species. This spectrum is compared with that of pure ionized species similarly
isolated at another suitable pH. By using this at various pH values,
intermediate between those at which the spectra of the two species were
obtained. This is possible because a series of two component mixture is formed
in which the ratio of the two species depends solely up on pH at which the
solution is optically measured [8].
Dissociation constant of substances can be determined by several
different methods. The potentiometric, chromatographic, electrophoretic
methods also have been used widely. But a method based on spectrometry has
been still used widely by the help of improving computer programs [8]. In most
C
l
i
c
k
t
o
b
u
y
N
O
W
!
PDF-XCHANGE
w
w
w
.docu-track.c
o
m
C
l
i
c
k
t
o
b
u
y
N
O
W
!
PDF-XCHANGE
w
w
w
.docu-track.c
o
m](https://image.slidesharecdn.com/tewodrosadaro-220410151640/75/Spectroscopic-pH-Measurement-Using-Phenol-Red-Dye-11-2048.jpg)
![15
of the visible spectrum. The color of objects which are not self-luminous and
which are seen by light reflected or transmitted by the object is usually the
result of selective absorption of portions of the visible spectrum. Many colorless
substances, such as benzene and similar hydrocarbons, selectively absorb
within the ultraviolet region of the spectrum, as well as in the infrared.
1.3 Absorption spectroscopy
Absorbance spectroscopy, commonly referred to as spectrophotometery,
is the analytical technique based on measuring the amount of light absorbed
by a sample at a given wave length [9]. spectrophotometery ,particularly in the
VIS and UV portions of the electromagnetic spectrum ,is one of the most
versatile and widely used techniques in chemistry and the life sciences.
Molecular absorption spectroscopy in the ultraviolet (UV) and visible (VIS)
is concerned with the measured absorption of radiation in its passage through
a gas, a liquid or a solid, the wave length region generally used is from 190 nm
to about 1000nm ,and the absorbing medium is at room temperature.
A molecule or part of a molecule that can be excited by absorption is called
chromophores. Organic chromophores which absorbs strongly in the UV or
visible portions or the spectrum.
Molecular excitation energy is usually dissipated as heat (kinetic energy)
by the collision of the excited molecules with another molecules (e.g. a solvent
molecule), as the molecule returns to the ground state. In other cases, the
excitation energy is dissipated by the emission of light in a process called
“fluorescence”. In both cases, the intensity of the light transmitted by a
collection of chromospheres is less than the intensity of the incident light.
An excited molecule can possess only one of a set of discrete amounts
(quanta) of energy described by the laws of quantum mechanics. These
amounts are called the “energy levels” of the molecule. In UV/VIS
spectrophotometery, the major energy levels are determined primarily by the
possible spatial distributions of the electrons and are called electronic energy
levels, and to a lesser extent by viberational energy levels, which arise from the
C
l
i
c
k
t
o
b
u
y
N
O
W
!
PDF-XCHANGE
w
w
w
.docu-track.c
o
m
C
l
i
c
k
t
o
b
u
y
N
O
W
!
PDF-XCHANGE
w
w
w
.docu-track.c
o
m](https://image.slidesharecdn.com/tewodrosadaro-220410151640/75/Spectroscopic-pH-Measurement-Using-Phenol-Red-Dye-15-2048.jpg)
![17
Fig-1.1 Transitions to excited state
Molecules which absorb photons of energy corresponding to wave lengths
in the range 190 nm to about nm, exhibit UV/VIS absorption spectra the
quantized internal energy ( )of as molecule in its electronic ground or excided
state can be approximated , with sufficient accuracy for analytical purposes, by
the following equation
(1.3.2)
is the electronic energy
is the vibrational energy
the rotational energy
Absorption of a photon results in a change of electronic energy,
accompanied by changes in the vibrational and rotational energies. Each
vibronic transition, i.e. a particular electronic plus vibrational transition,
corresponds to an absorption band consisting of rotational lines. In liquids and
solids, the rotational lines are broad and overlap so that no rotational structure
is distinguishable [9].
C
l
i
c
k
t
o
b
u
y
N
O
W
!
PDF-XCHANGE
w
w
w
.docu-track.c
o
m
C
l
i
c
k
t
o
b
u
y
N
O
W
!
PDF-XCHANGE
w
w
w
.docu-track.c
o
m](https://image.slidesharecdn.com/tewodrosadaro-220410151640/75/Spectroscopic-pH-Measurement-Using-Phenol-Red-Dye-17-2048.jpg)
![20
1.5 Beer- Lambert law
This law refers to the effect of the concentration of the absorbing medium,
that is, the mass of absorbing material per unit of volume, on the absorption.
This relation is of prime importance in describing the absorption of solutions of
an absorbing solute, since the solute’s concentration may be varied over wide
limits, or the absorption of gases, the concentration of which depends on the
pressure.
According to Beer’s law, each individual molecule of the absorbing material
absorbs the same fraction of the radiation incident upon it, no matter whether
the molecules are closely packed in a concentrated solution or highly dispersed
in a dilute solution. The relation between the intensity of a parallel
monochromatic beam which emerges from a plane parallel layer of absorbing
solution of constant thickness and the concentration of the solution is an
exponential one, of the same form as the relation between intensity and
thickness expressed by Lambert’s law.
In 1852 Beer determined that the absorption coefficient of a compound is
linearly related to its concentration diluted in a non-absorbing medium (Beer,
1852)[10].
(1.5.1)
Where is known as the specific absorption coefficient substituting for µ
in the Lambert-Bouguer law gives what is known as Beer-Lambert law.
C
l
i
c
k
t
o
b
u
y
N
O
W
!
PDF-XCHANGE
w
w
w
.docu-track.c
o
m
C
l
i
c
k
t
o
b
u
y
N
O
W
!
PDF-XCHANGE
w
w
w
.docu-track.c
o
m](https://image.slidesharecdn.com/tewodrosadaro-220410151640/75/Spectroscopic-pH-Measurement-Using-Phenol-Red-Dye-20-2048.jpg)
![24
In practice, we do not generally rely on published values of because
this quantity may be very sensitive to idiosyncrasies of reagent preparation and
instrument design[9].
C
l
i
c
k
t
o
b
u
y
N
O
W
!
PDF-XCHANGE
w
w
w
.docu-track.c
o
m
C
l
i
c
k
t
o
b
u
y
N
O
W
!
PDF-XCHANGE
w
w
w
.docu-track.c
o
m](https://image.slidesharecdn.com/tewodrosadaro-220410151640/75/Spectroscopic-pH-Measurement-Using-Phenol-Red-Dye-24-2048.jpg)
![25
CHAPTER TWO
1. pH measurement by absorption spectroscopy
2.1 Activity and the Definition of pH
2.1.1 Hydrogen ion activity
pH was originally defined by Sørensen in 1909 in terms of the
concentration of hydrogen ions (in modern nomenclature) as log
where is the hydrogen ion concentration in mol dm–3, and = 1 mol dm–3 is
the standard amount concentration. Subsequently, it has been accepted that it
is more satisfactory to define pH in terms of the relative activity of hydrogen
ions in solution.
log log (2.1.1)
Where is the relative (molality basis) activity and is the molal activity
coefficient of the hydrogen ion H+ at the molality , and is the standard
molality. The quantity pH is intended to be a measure of the activity of
hydrogen ions in solution. However, since it is defined in terms of a quantity
that cannot be measured by a thermodynamically valid method, eq. 2.1.1 can
be only a notional definition of pH[2].
Because of ionic interactions in all but very dilute solutions, it is
necessary to use the “activity” of an ion and not its molar concentration. Use of
the term pH assumes that the activity of the hydrogen ion, , is being
considered. The approximate equivalence to molality [ ] can be presumed only
in very dilute solutions (ionic strength< 0.1).
The pH value of a highly dilute solution is approximately the same as the
negative common logarithm of the hydrogen ion concentration.
2.2 Buffer solution
A buffer solution is an aqueous solution consisting of a mixture of a weak
acid and its conjugate base or a weak base and its conjugate acid. It has the
property that the PH of the solution changes very little when a small amount of
C
l
i
c
k
t
o
b
u
y
N
O
W
!
PDF-XCHANGE
w
w
w
.docu-track.c
o
m
C
l
i
c
k
t
o
b
u
y
N
O
W
!
PDF-XCHANGE
w
w
w
.docu-track.c
o
m](https://image.slidesharecdn.com/tewodrosadaro-220410151640/75/Spectroscopic-pH-Measurement-Using-Phenol-Red-Dye-25-2048.jpg)
![26
acid or base is added to it. Buffer solutions are used as a means of keeping pH
at a nearly constant value in wide variety of chemical application [11].
2.2.1 Buffering agent
A buffering agent adjusts the PH of a solution. The function of a buffering
agent is to drive an acidic or basic solution to a certain pH state and prevent a
change in this pH, Buffering agents have variable properties. Some are more
soluble than others; some are acidic while others are basic. As pH managers,
they are important in many chemical applications, including agriculture, food
processing, medicine and photography.
A. What a buffering agent is
Buffering agents can be either the weak acid or weak base that would
comprise a buffer solution. Buffering agents are usually added to water to form
buffer solutions. They are the substances that are responsible for the buffering
seen in these solutions. These agents are added to substances that are to be
placed into acidic or basic conditions in order to stabilize the substance. For
example, buffered aspirin has buffering agent, such as , that will maintain
the pH of the aspirin as it passes through the stomach of the patient. Another
use of a buffering agent is in anti acid tablets, whose primary purpose is to
lower the acidity of the stomach.
B. How a buffering agent works
The way buffering agents work is seen in how buffer solutions work.
Using Henderson–Hasselbakh equation we get an equilibrium expression
between the acid and conjugate base. As a result we see that there is little
change in the concentrations of the acid and base so therefore the solution is
buffered. A buffering agent sets up this concentration ratio by providing the
corresponding conjugate acid or base to stabilize the pH of that which it is
added to.
C
l
i
c
k
t
o
b
u
y
N
O
W
!
PDF-XCHANGE
w
w
w
.docu-track.c
o
m
C
l
i
c
k
t
o
b
u
y
N
O
W
!
PDF-XCHANGE
w
w
w
.docu-track.c
o
m](https://image.slidesharecdn.com/tewodrosadaro-220410151640/75/Spectroscopic-pH-Measurement-Using-Phenol-Red-Dye-26-2048.jpg)

![29
group is lost, resulting in the yellow negatively charged ion denoted as . At
still higher pH, the phenol's hydroxide group loses its proton, resulting in the
red ion denoted as .
In several sources, the structure of phenol red is shown with the sulfur
atom being part of a cyclic group, similar to the structure of phenolphthalein.
However, this cyclic structure could not be confirmed by X-ray crystallography.
(a)
(b) (C)
Fig.2.1. (a) color response of phenol red at different pH value (b) powder
form of phenol red (c) chemical structure of phenol red.
2.4 Determination of pH of indicator dye
pH indicator dyes are weak acid, and their dissociation equilibrium can
be represented as shown[1,20,21]
(2.4.1)
Phenol red(pH indicator)
below pH
6.8
above pH
8.2
6.8 8.2
C
l
i
c
k
t
o
b
u
y
N
O
W
!
PDF-XCHANGE
w
w
w
.docu-track.c
o
m
C
l
i
c
k
t
o
b
u
y
N
O
W
!
PDF-XCHANGE
w
w
w
.docu-track.c
o
m](https://image.slidesharecdn.com/tewodrosadaro-220410151640/75/Spectroscopic-pH-Measurement-Using-Phenol-Red-Dye-29-2048.jpg)
![30
Fig 2.2. Dissociation of phenol red
The fraction of the dye existing in the acid (A) and base (B) form depends on the
pH of the solution. The individual spectra of these two forms are different and,
hence, the measured dye spectrum (which is a mole-fraction weighted
combination of the acid and base spectra) changes as the fraction of each form
with pH. The equilibrium constant for equation (2.4.1) is specified by
=
[ ]
[ ]
(2.4.2)
Multiplying both side by –log10
log log log
[ ]
[ ]
+ log + log
[ ]
[ ]
(2.4.3)
Were log ; is the thermodynamic equilibrium constant for the dye
dissociation (e.q.2.4.1), and is a function of temperature and pressure;[A],[B]
are concentration of the acid and base form of the dye in the dye-sample
mixture, respectively; and are activity coefficients of the acid and base
forms of the dye, and a function of temperature, pressure and ionic strength of
solution. a is activity.
This equation is more commonly written as
+ log
[ ]
[ ]
(2.4.4)
C
l
i
c
k
t
o
b
u
y
N
O
W
!
PDF-XCHANGE
w
w
w
.docu-track.c
o
m
C
l
i
c
k
t
o
b
u
y
N
O
W
!
PDF-XCHANGE
w
w
w
.docu-track.c
o
m](https://image.slidesharecdn.com/tewodrosadaro-220410151640/75/Spectroscopic-pH-Measurement-Using-Phenol-Red-Dye-30-2048.jpg)
![31
log (2.4.5)
Because includes the activity coefficients, it is no longer only
function of pressure and temperature, but also a function of ionic strength.
For any given pH, the dye spectrum is a mole fraction weighted linear
combination of the acid-only and base-only spectra. Using two-wave length
measurements, one can determine the concentration ratio of base-to-acid form
as below.
= [ ] + [ ] (2.4.6)
According to the additivity of Beer-Lambert law
[ ] [ ] (2.4.7)
[ ] [ ] (2.4.8)
And defining
= (2.4.9)
Simultaneously solving equations (2.4.7) and (2.4.8) yields
[ ] = (2.4.10)
[ ] =
1
(2.4.11)
And the concentration ratio becomes
C
l
i
c
k
t
o
b
u
y
N
O
W
!
PDF-XCHANGE
w
w
w
.docu-track.c
o
m
C
l
i
c
k
t
o
b
u
y
N
O
W
!
PDF-XCHANGE
w
w
w
.docu-track.c
o
m](https://image.slidesharecdn.com/tewodrosadaro-220410151640/75/Spectroscopic-pH-Measurement-Using-Phenol-Red-Dye-31-2048.jpg)
![32
[ ]
[ ]
=
1
(2.4.12)
Where
are wave length at which maximum absorbance of pure acid and
base form of the dye respectively.
are absorbance measured at a wave lengt respectively.
is optical path length
T is total dye concentration in solution–dye mixture.
are molar absorption coefficents at wave length for A,B
rspectively.
is absorbance ratio defined by equation(2.4.9)
The base-to-acid concentration ratio can also be obtained by reggration
using spectral A values at more than two wave length of the dye spectra when
available [1]
Equation (2.4.4) and (2.4.12) may now be combined to give
+ log (2.4.13)
Where the e-values are the ratio the molar absorption coefficients defined by
equations (2.4.19 to 2.4.21)
The individual spectra of pure acid and base form of the dye are
obtained from dye solution in extreme pH values (above 3 to 4 units away from
the ) were the dye exists only in the acid or base form [1]. These end points
spectra are used to determine the molar absorption coefficients in equation
C
l
i
c
k
t
o
b
u
y
N
O
W
!
PDF-XCHANGE
w
w
w
.docu-track.c
o
m
C
l
i
c
k
t
o
b
u
y
N
O
W
!
PDF-XCHANGE
w
w
w
.docu-track.c
o
m](https://image.slidesharecdn.com/tewodrosadaro-220410151640/75/Spectroscopic-pH-Measurement-Using-Phenol-Red-Dye-32-2048.jpg)
![33
(2.4.13). The two spectra represent the absorptions spectra for the proton
donor ( ) and proton acceptor ( ) forms of indicator. For example, for indicator
phenol red the proton donor form has an absorption maximum ( ) between
400nm and 450nm, while the acceptor form has an absorption maximum
( ) between 500nm and 600nm. Note that at the absorption maximum for
the proton acceptor form, the donor form absorbs light very weakly and it is
vice versa [17].
Consider concentration of dye solution is equal for both pure acid and base
form of the dye. Thus
[ ] = [ ] (2.4.14)
Applying Beer-Lambert for pure acid and base forms the dye at two
wave length .
[ ] (2.4.15)
[ ] (2.4.16)
[ ] (2.4.17)
[ ] (2.4.18)
Where
are maximum absorbance of pure acid and base form of the
dye at wave length respectively.
are absorbance of pure acid and base form of the dye at wave
length respectively.
According to equation (2.4.14) pure acid and base form of the dye are
equal. Applying this equation to equation (2.4.15) to (2.4.17) the ratio of molar
absorption coefficients in equation (2.4.13) becomes
= = (2.4.19)
C
l
i
c
k
t
o
b
u
y
N
O
W
!
PDF-XCHANGE
w
w
w
.docu-track.c
o
m
C
l
i
c
k
t
o
b
u
y
N
O
W
!
PDF-XCHANGE
w
w
w
.docu-track.c
o
m](https://image.slidesharecdn.com/tewodrosadaro-220410151640/75/Spectroscopic-pH-Measurement-Using-Phenol-Red-Dye-33-2048.jpg)


![40
CHAPTER THREE
3. Experimental
3.1 Basic of UV/VIS Spectrometer
3.1.1 Instrumental component
There are five essential components required for most absorption
spectrometers. [18]
These are;
a. A source or sources of radiation covering the required wave – length
range.
b. A means for selecting a narrow band of wave length- the device used for
this is called the monochrometer.
c. Facilities for holding the cells or cuvettes containing the sample
solution and the blank in the monochromated radiation beam.
d. A device or devices capable of measuring the intensity of the radiation
beam transmitted through the cells- this is the detector and is usually a
photo detector.
e. A display or output device to record the measured value.
3.1.2 General arrangement experimental set up of spectrometer
The general arrangement of these components for a simple single beam
spectrometer is shown in figure 3.1below
Fig3.1. Basic Experimental set up of spectrometer
C
l
i
c
k
t
o
b
u
y
N
O
W
!
PDF-XCHANGE
w
w
w
.docu-track.c
o
m
C
l
i
c
k
t
o
b
u
y
N
O
W
!
PDF-XCHANGE
w
w
w
.docu-track.c
o
m](https://image.slidesharecdn.com/tewodrosadaro-220410151640/75/Spectroscopic-pH-Measurement-Using-Phenol-Red-Dye-40-2048.jpg)
![42
3) 0.1M sodium hydroxide ( )
Mixing the above three in the following proportion (Table-3.1), we get the
required pH and the exact values were achieved by adjusting with the addition
of 6M HCl or 6M NaOH.
pH Vol. of phosphate (ml) Vol. of 0.1M (ml) Vol. of 0.1M (ml )
7 189 61 -
8 238.8 11.2 -
9 238.7 11.3 -
10 241.6 - 8.4
11 241.3 - 8.7
Table-3.2 volume of 0.1M disodium hydrogen orthophosphate,0.1M
hydrochloric acid and 0.1M sodium hydroxide to get Phosphate buffer
3.4 Preparation of phenol red stock solution
Phenol red stock solution ( ) was prepared by dissolving
10mg of phenol red in 100ml of distilled water [7].
3.5 preparation caffeine sample solution
1.85x10⁻⁴M caffeine sample solution was prepared by dissolving 9.0mg of
caffeine in 250ml distilled water.
3.6 Measurements
The pH of the buffer solutions checked using a digital pH meter (portable pH
meter pH-13) calibrated at 20 ± 2 °C with standard buffers solutions of pH 7.0
and 4.0. Absorbance measurements were made by a UV/Vis spectrometer
Lambda-19. Absorption spectra were taken from 320 to 700nm with 2nm
increment for each form of phenol red solutions.
Before taking absorbance measurements for each phenol red solutions
(having different pH values) the blank is used as a control.
C
l
i
c
k
t
o
b
u
y
N
O
W
!
PDF-XCHANGE
w
w
w
.docu-track.c
o
m
C
l
i
c
k
t
o
b
u
y
N
O
W
!
PDF-XCHANGE
w
w
w
.docu-track.c
o
m](https://image.slidesharecdn.com/tewodrosadaro-220410151640/75/Spectroscopic-pH-Measurement-Using-Phenol-Red-Dye-42-2048.jpg)
![46
CHAPTER FOUR
4. Result and Discussion
4.1 Result
4.1.1 Color response of phenol red solution
Phenol red solution made of phenol red dye powder dissolved in distilled
water has an orange color. It changed to pink when in contact with a pH 8, 11,
12 solutions and changed to yellow when in contact with a pH 3, 5, 6 and
caffeine and water like yes for life solutions and red in the rest four packed
drinking spring-water.
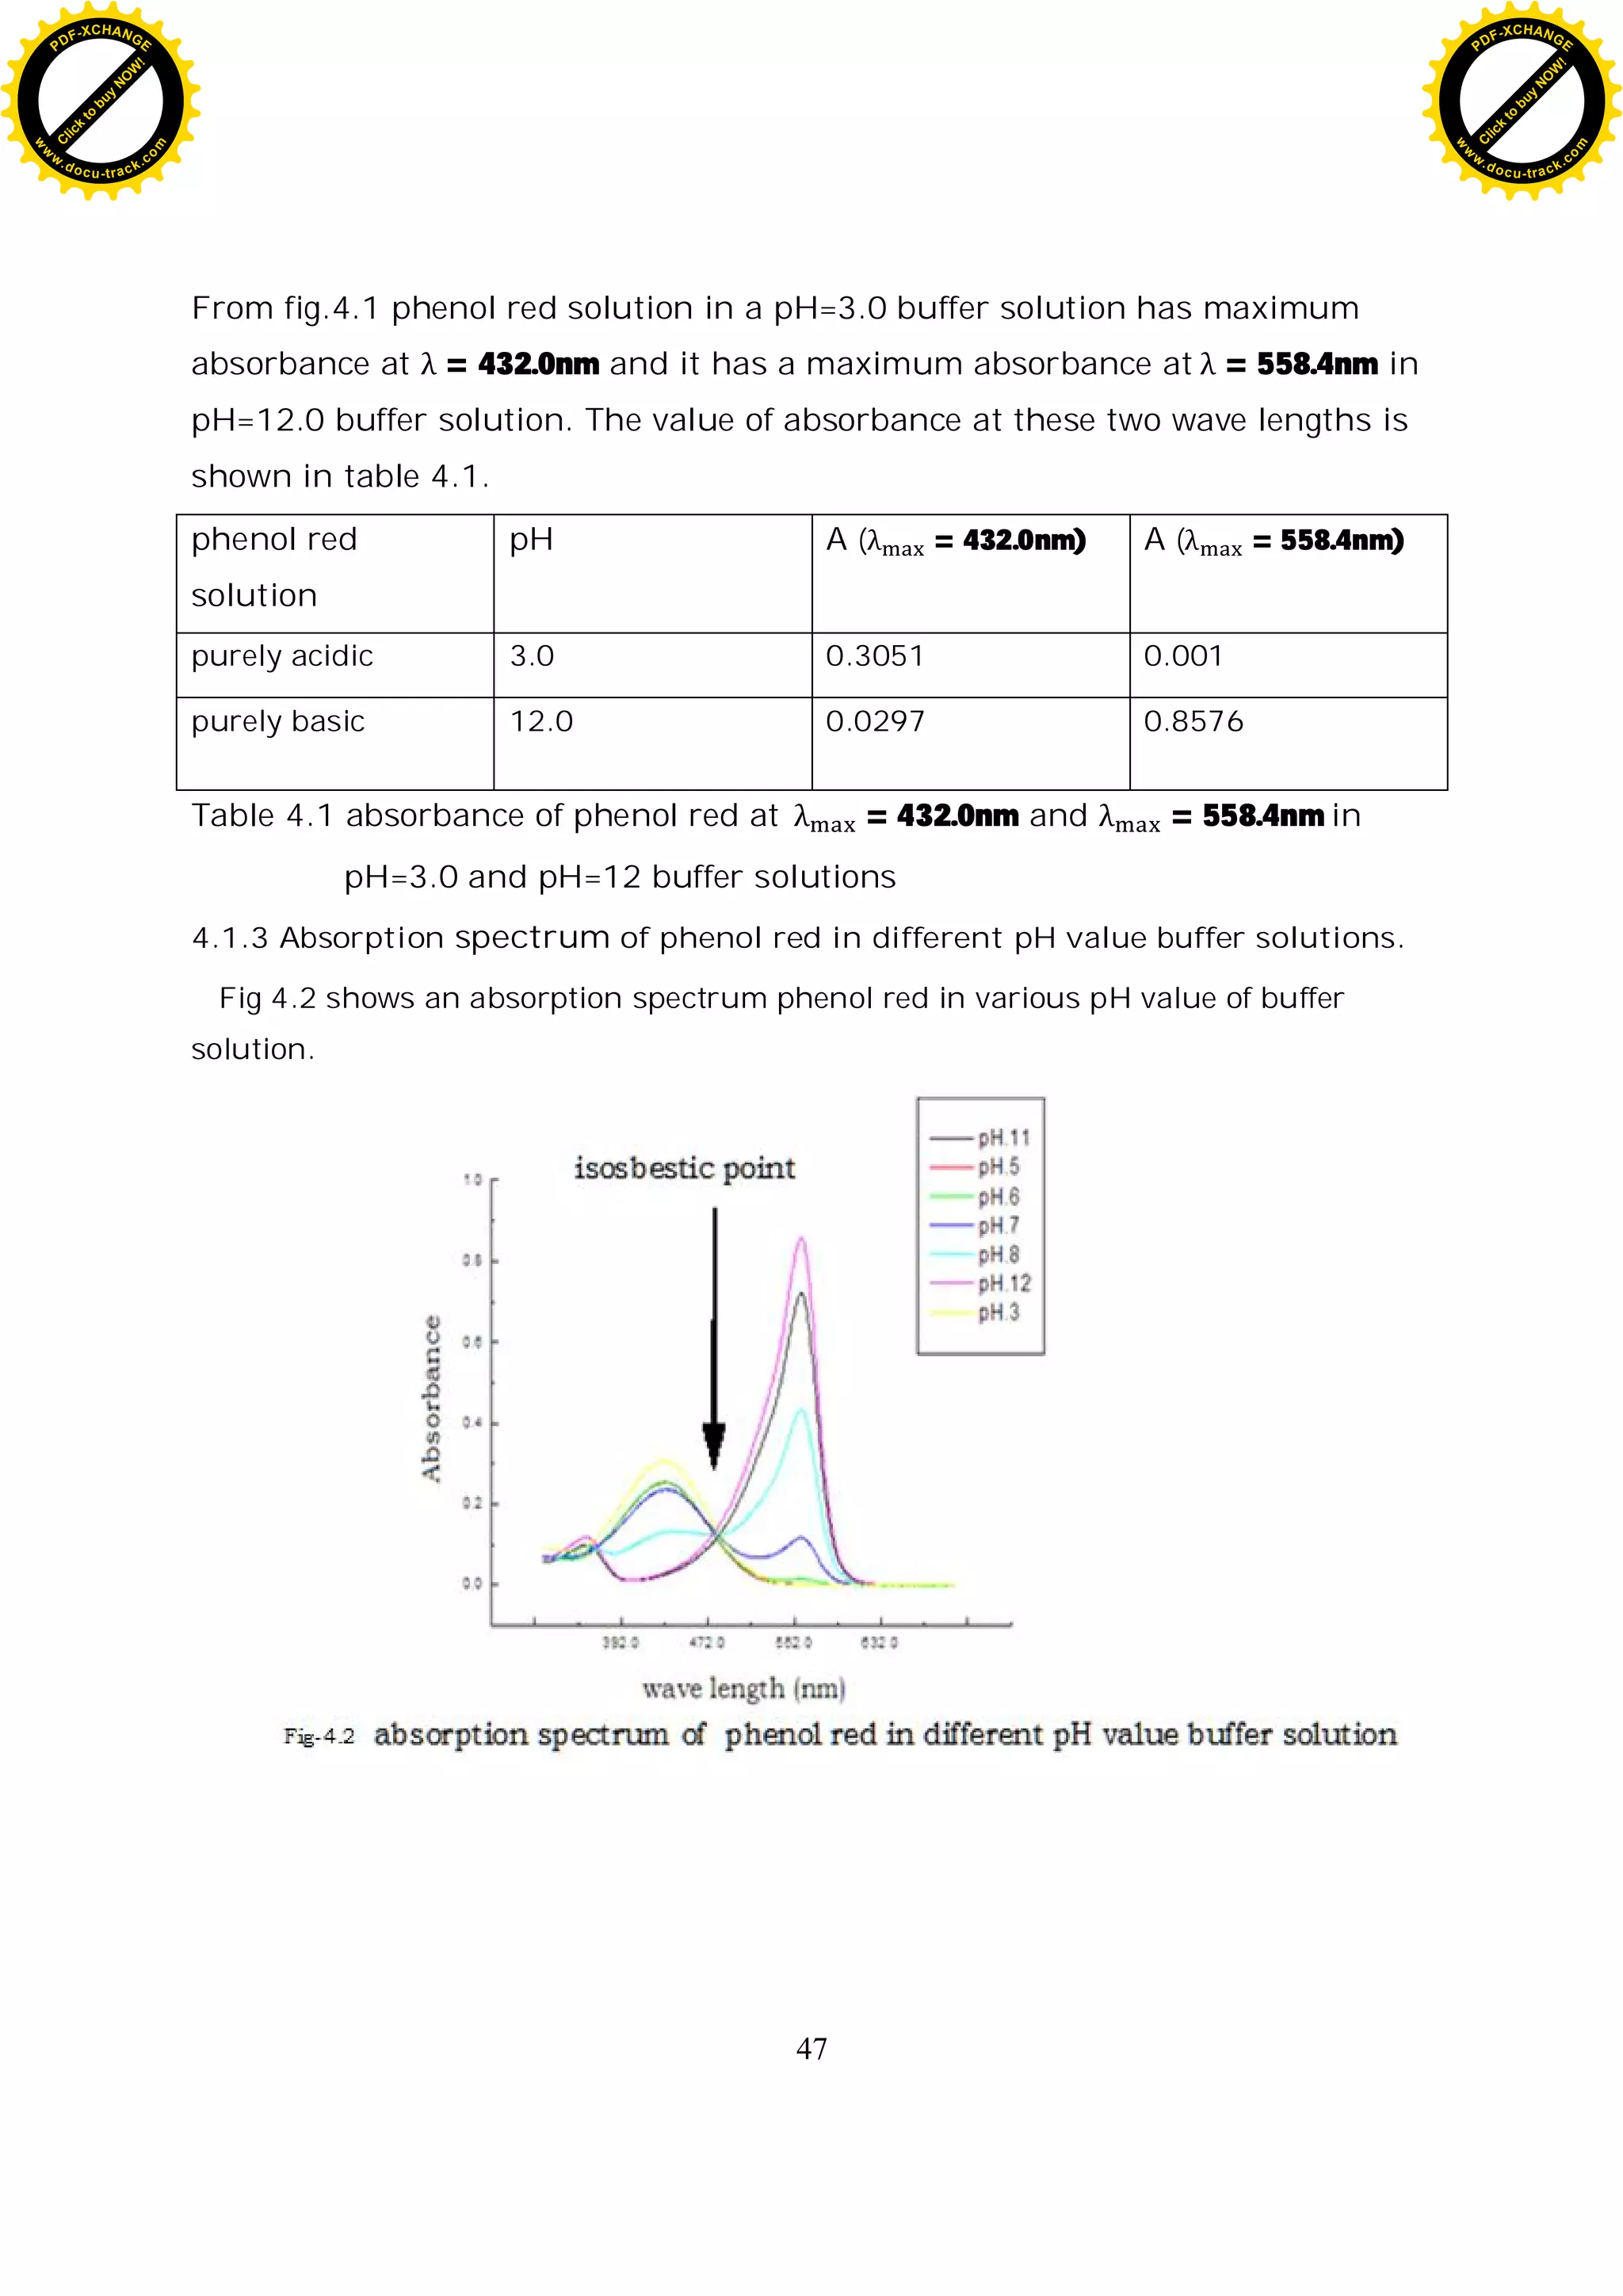
4.1.2 Absorption spectrum of pure acidic and basic form of phenol red
Fig.4.1 shows an absorption spectrum of totally protonated (pure acid form)
and totally deprotonated form (pure basic form) of phenol red in two extreme
pH value buffer solutions. Spectral changes are the results of acid-based
equilibria. These changes are completely reversible with the variation in pH.
When we have two absorbing species which are inter convertible, then their
spectra may overlap. The wavelength at which overlap occurs is called the
isosbestic point, and the absorbance at this wave length is independent of the
position of equilibrium, and depends only on the total amount of the substance
present [18].
C
l
i
c
k
t
o
b
u
y
N
O
W
!
PDF-XCHANGE
w
w
w
.docu-track.c
o
m
C
l
i
c
k
t
o
b
u
y
N
O
W
!
PDF-XCHANGE
w
w
w
.docu-track.c
o
m](https://image.slidesharecdn.com/tewodrosadaro-220410151640/75/Spectroscopic-pH-Measurement-Using-Phenol-Red-Dye-46-2048.jpg)
![51
4.2 Discussion
4.2.1 Response spectra of pure acid (A) and pure base (B) form of phenol red
Fig 4.1 shows the spectra of phenol red in purely acidic (pH=3) and purely
basic (pH=12) solutions. The absorption spectra of phenol red in purely acidic
and basic solutions resemble to the spectra of phenol red in fig 4.5 [12,13].
Absorbance value of phenol red in buffer solutions measured at two wave
length. Purely acidic phenol red solution has maximum absorbance at a wave
length of 432.0nm while, purely basic phenol red solution has maximum
absorbance at a wave length 558.4nm and this absorption peaks are in
agreement with a statement described in chapter two which is, pure acidic
form of phenol red has an absorption maximum ( ) between 400nm to
450nm, While the pure basic form has an absorption maximum ) between
500nm and 600nm.
The reason for the spectral shift is seen by looking at the chemical
species present at two extremes. Fig-4.5 (left) is the species at low pH (acidic)
conditions. There is some resonant structure in the molecule, but noticed that
the three rings are not in conjugation. For the molecule on fig-4.5 (right) at
high pH (basic) conditions, there is more resonance in the structure since the
three rings are now in conjugation with one another (i.e. the electrons are
delocalized across all three rings).This is the reason why the basic structure
absorb light at a longer wavelength than the acid form –it has a greater degree
of conjugation [14].
C
l
i
c
k
t
o
b
u
y
N
O
W
!
PDF-XCHANGE
w
w
w
.docu-track.c
o
m
C
l
i
c
k
t
o
b
u
y
N
O
W
!
PDF-XCHANGE
w
w
w
.docu-track.c
o
m](https://image.slidesharecdn.com/tewodrosadaro-220410151640/75/Spectroscopic-pH-Measurement-Using-Phenol-Red-Dye-51-2048.jpg)
![52
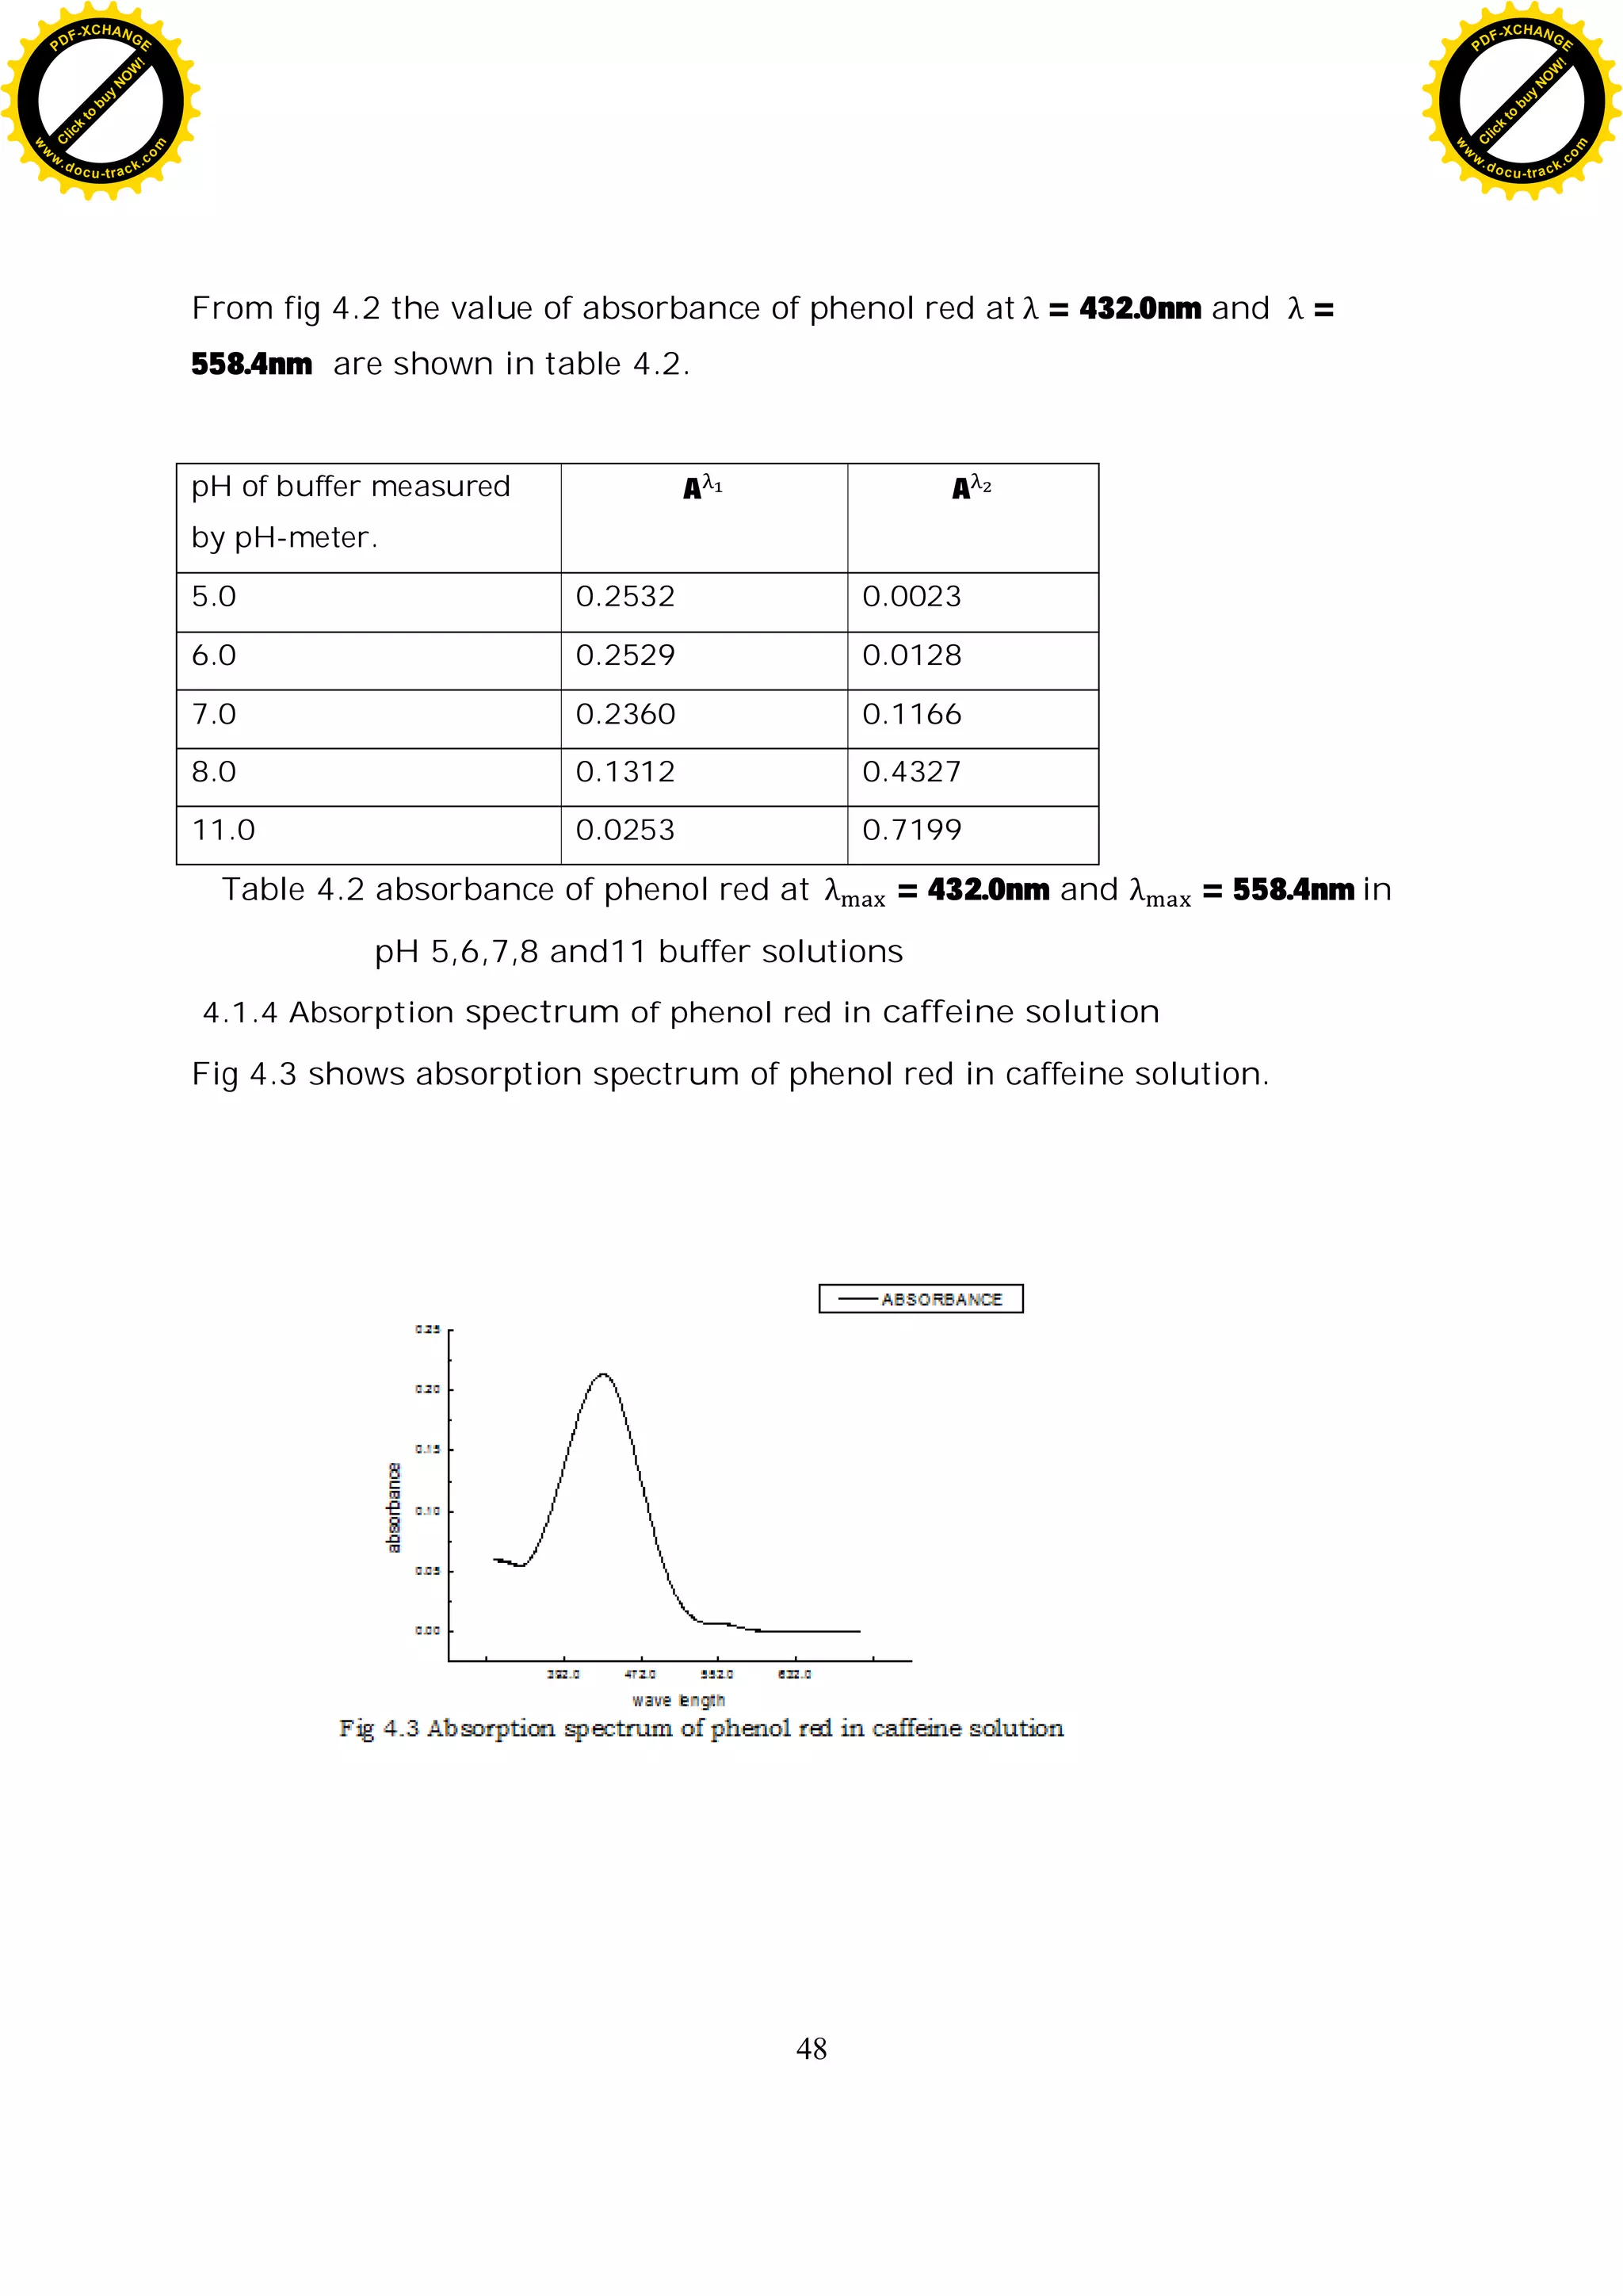
4.2.2 Response spectra of phenol red in buffer solutions
Fig 4.2 shows the spectra of phenol red solution in 3, 5, 6, 7, 8, 11, and pH
value buffer solution. The spectral properties of the dye are strongly
dependent on the pH value. The absorption spectra of phenol red in buffer
solution reassemble to the spectra of phenol red doped sol-gel (fig 4.6)[7]. At
low pH, the absorbance maximum is at 432.0nm, and this peak decreases as
pH of solution increases (fig4.7 (a)), where as the absorbance maximum of
phenol red doped sol-gels is 400nm at low pH. There is only slight red shift of
absorbency maximum in aqueous solution compared to the sol-gels, e.g. the
absorbance maximum are 558.4 and 560 in aqueous solution and in sol-gel,
respectively. In the range of pH 6.00-11.00, the peak at 558.4nm continually
increases with the increased pH (fig4.7 (b)). There is an isosbestic point at
480nm.The absorbance at this point (isosbestic point) is dependent only on the
total indicator concentration because the extinction coefficients of the
protonated and the unprotonated form are equal at this wavelength [15].
C
l
i
c
k
t
o
b
u
y
N
O
W
!
PDF-XCHANGE
w
w
w
.docu-track.c
o
m
C
l
i
c
k
t
o
b
u
y
N
O
W
!
PDF-XCHANGE
w
w
w
.docu-track.c
o
m](https://image.slidesharecdn.com/tewodrosadaro-220410151640/75/Spectroscopic-pH-Measurement-Using-Phenol-Red-Dye-52-2048.jpg)
![54
4.2.3 Phenol red determination
The determination of acidity constants by UV spectroscopy is an ideal
method when the compound is too insoluble for potentiometry or when its
value is particularly low or high. Under suitable conditions, it is the
most accurate method, as all measurements being taken in very dilute
solutions. The spectroscopic technique is based on the fact that, for solutions
containing only the fully protonated or the totally nonprotonated species, there
will be an absorption due to both the free base (neutral molecule) and
conjugate acid. The procedures depends upon the direct determination of the
ratio of neutral molecule to ionized species in series of non-absorbing buffer
solutions of known pH [16].
Absorbance of phenol red in purely acidic and basic form at a wave
length of 432.0nm and 558.4nm are shown in table4.1. Thus, from table 4.1 it
is shown that = 0.8576, = 0.001, = 0.0297 = 0.8576. substituting
these values in equations (2.4.18) to (2.4.20). The ratio of molar absorption
coefficients was calculated. The values are
= = = 0.00328 , = = = 2.81 and = = = 0.0346
These e- values are comparable to the values published by Robert-Baldo. The
e-values are extinction coefficient ratios and are either constants or
functions of temperature, which are published together with the pKa
values for indicator like phenol red (Robert-Baldo et al. 1985). According
to Robert-Baldo e = 0.0038 ,e = 2.6155 and e = 0.04718 [15].
Having obtained the spectra of phenol red in various pH buffer solution
(fig.4.2), the value of log
[ ]
[ ]
was determined (table (4.5)) by using the second
term of equation (2.4.13).
Fig.4.8 shows a plot of pH vs log
[ ]
[ ]
. By least square fitting of (e.q.2.4.13)
to the plot, the value of is determined to be 7.8951±0.0270 (intercept
at log
[ ]
[ ]
= 0 ).
C
l
i
c
k
t
o
b
u
y
N
O
W
!
PDF-XCHANGE
w
w
w
.docu-track.c
o
m
C
l
i
c
k
t
o
b
u
y
N
O
W
!
PDF-XCHANGE
w
w
w
.docu-track.c
o
m](https://image.slidesharecdn.com/tewodrosadaro-220410151640/75/Spectroscopic-pH-Measurement-Using-Phenol-Red-Dye-54-2048.jpg)
![56
pH(pH meter) A A A [B]
[A]
log
[B]
[A]
5.0 0.2532 0.0023 0.0091 0.0021 -2.6850
6.0 0.2529 0.0128 0.0506 0.0168 -1.7730
7.0 0.2360 0.1166 0.4940 0.1776 -0.7505
8.0 0.1312 0.4327 3.2980 1.3235 0.1217
11.0 0.0253 0.7199 28.4550 655.05 2.8160
Table 4.5 calculated value of log
[ ]
[ ]
for various pH value of buffer solution.
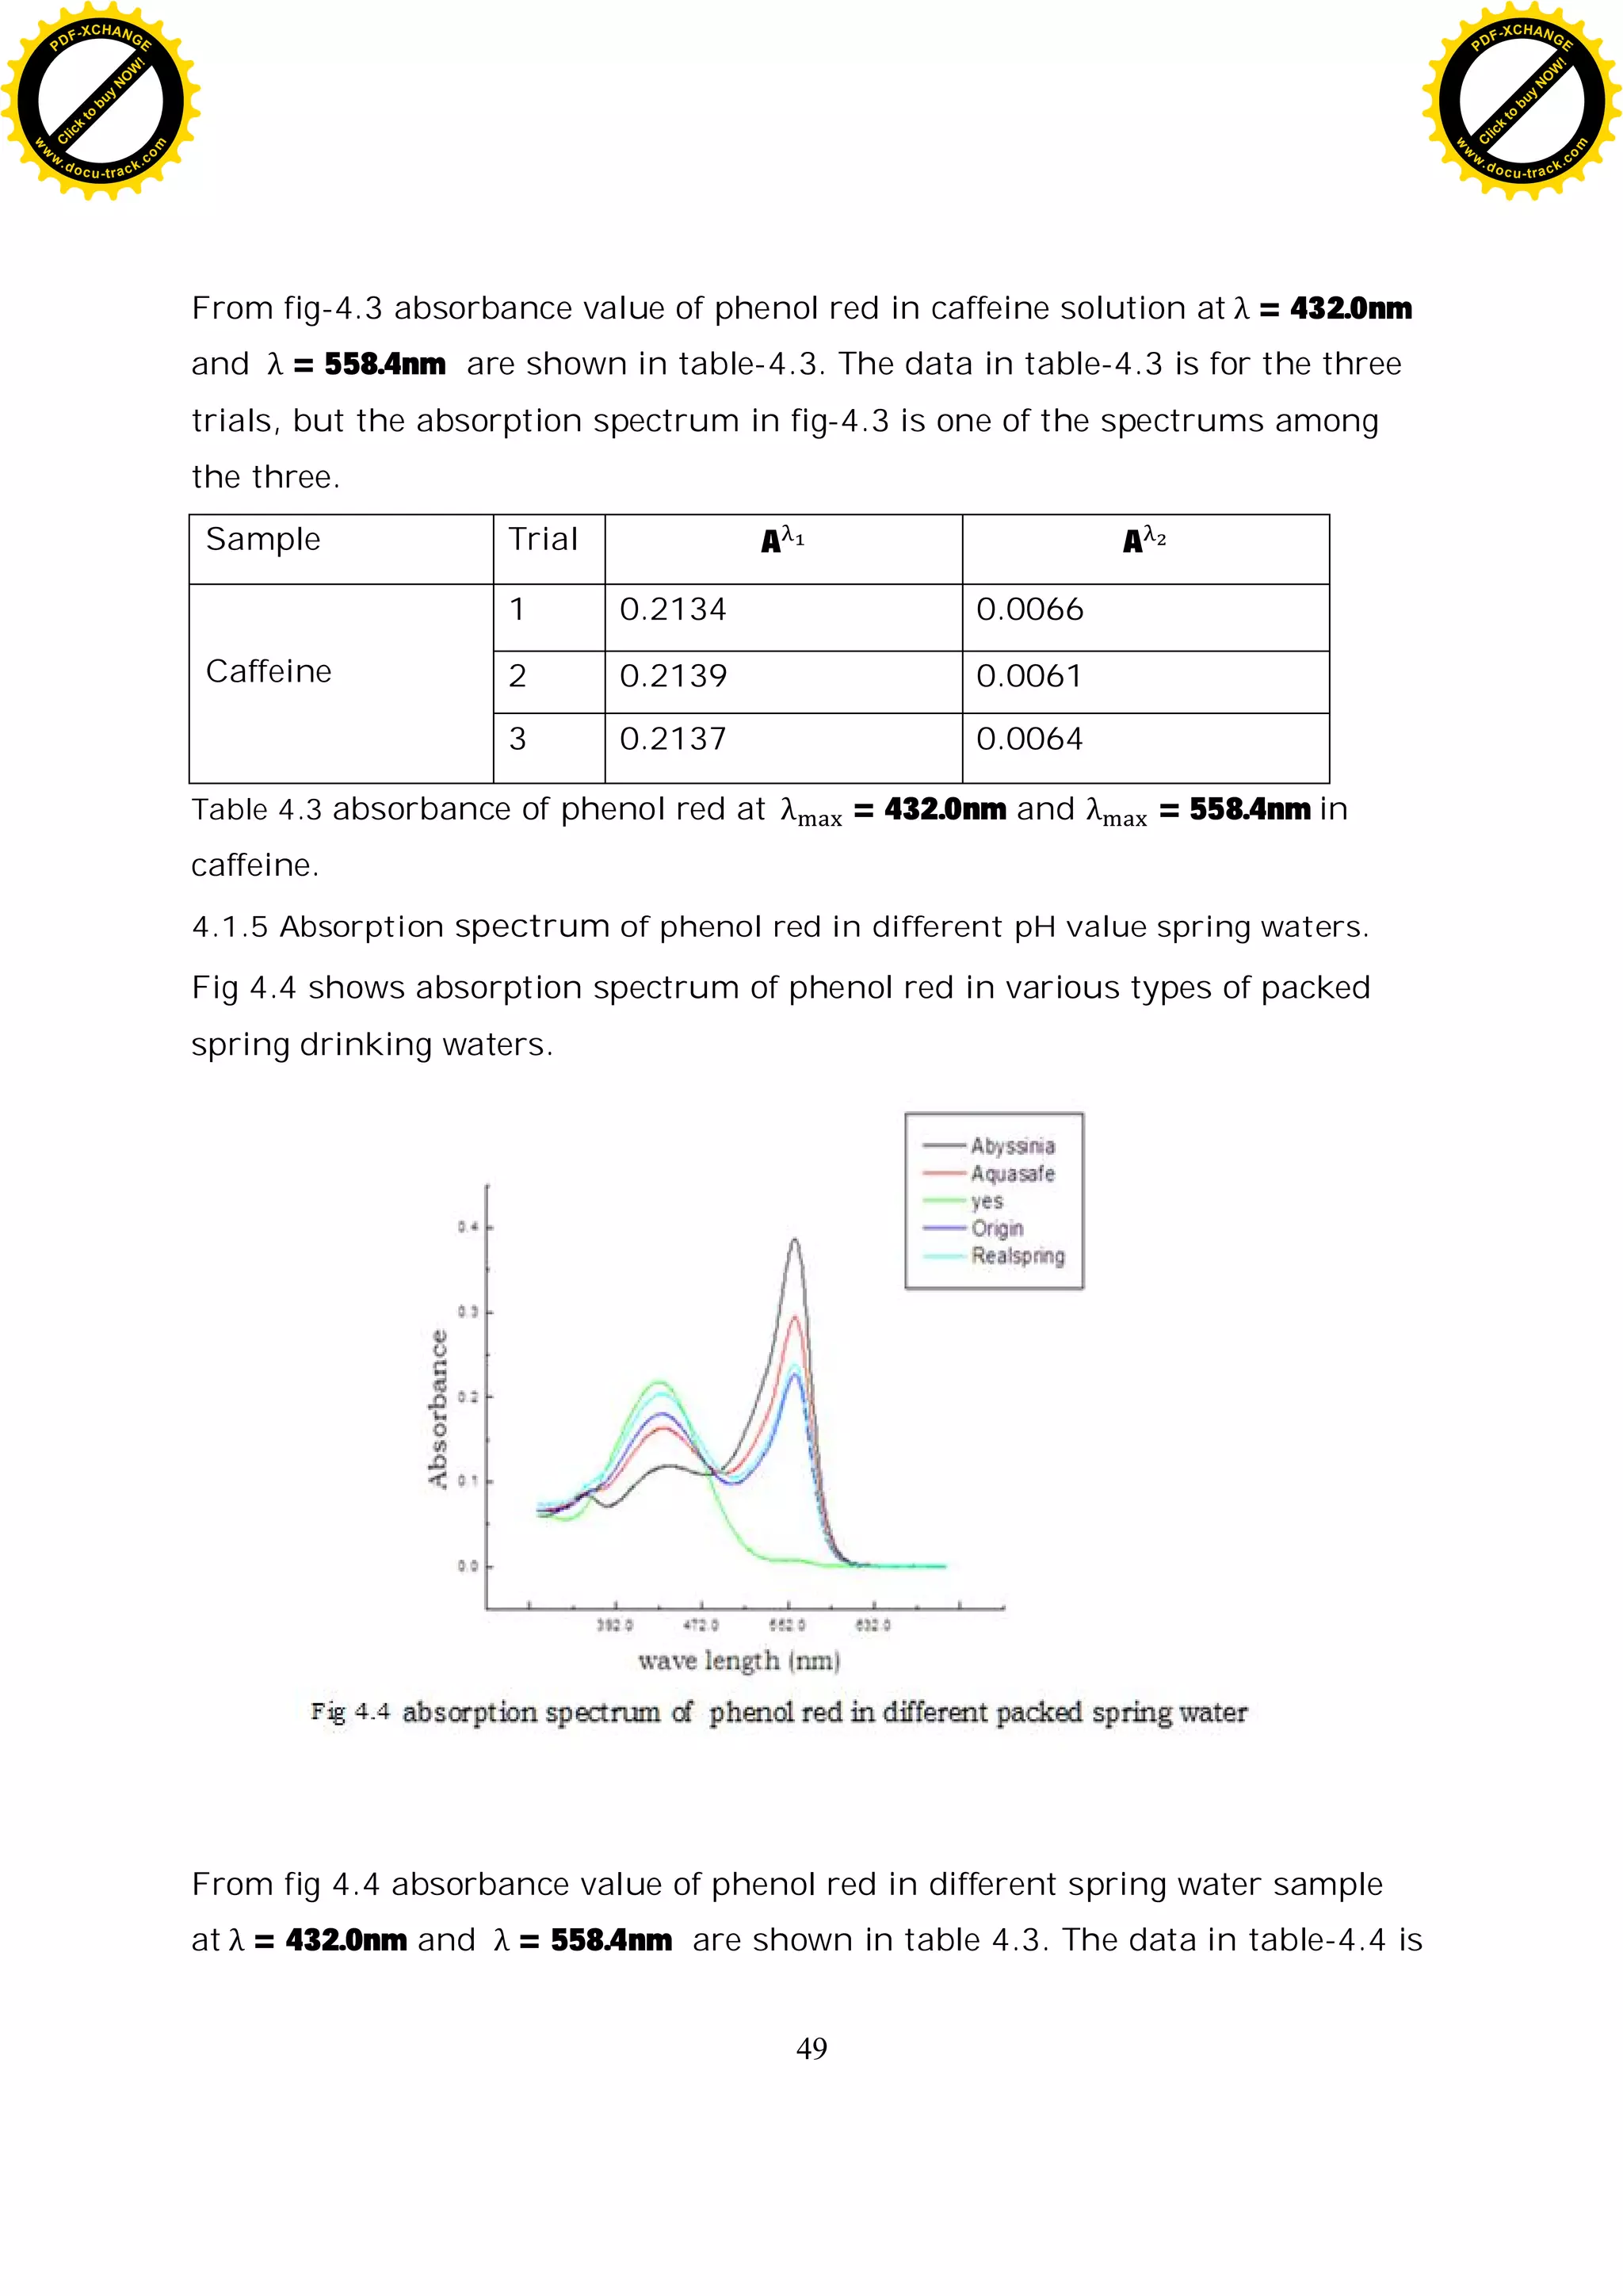
4.2.4 Spectroscopic pH calculation of caffeine.
sample Trial A A A [B]
[A]
log
[B]
[A]
pH
Caffeine
1 0.2134 0.0066 0.0309 0.0777 -1.1096 6.7855
2 0.2139 0.0061 0.0285 0.0709 -1.1488 6.7463
3 0.2137 0.0064 0.0299 0.0768 -1.1146 6.7805
Table 4.6 calculated value of log
[ ]
[ ]
for various pH value of caffeine
The mean pH of caffeine measured spectroscopically is 6.7768 ±0.0005 the
precession of the measurement is 0.0005 pH unit. pH of caffeine is 6.9 and the
difference between the measured and the theoretical value is 0.1232 pH unit.
4.2. Spectroscopic pH calculation of packed drinking spring-water.
The pH level is a measure of the hydrogen ion content in water. The
higher the concentration, the more acidic the water is. The lower the
C
l
i
c
k
t
o
b
u
y
N
O
W
!
PDF-XCHANGE
w
w
w
.docu-track.c
o
m
C
l
i
c
k
t
o
b
u
y
N
O
W
!
PDF-XCHANGE
w
w
w
.docu-track.c
o
m](https://image.slidesharecdn.com/tewodrosadaro-220410151640/75/Spectroscopic-pH-Measurement-Using-Phenol-Red-Dye-56-2048.jpg)
![58
Water sample Trial A A A [B]
[A]
log
[B]
[A]
pH
Abyssinia
springs
1 0.1194 0.4050 3.3920 1.3663 0.1355 8.0307
2 0.1189 0.4084 3.4348 1.3859 0.1417 8.0368
3 0.1166 0.2932 3.3191 1.3331 0.1249 8.0199
Aqua safe 1 0.1367 0.3217 2.3533 0.9104 -0.0407 7.8544
2 0.1357 0.3226 2.3773 0.9206 -0.0359 7.8592
3 0.1353 0.3250 2.4021 0.9311 -0.0310 7.8641
Yes for a better
life
1 0.2479 0.0107 0.0432 0.0142 -1.8469 6.0483
2 0.2474 0.0109 0.0441 0.0145 -1.8372 6.0579
3 0.2476 0.0114 0.0461 0.0153 -1.8164 6.0787
Origin 1 0.1559 0.2402 1.5407 0.5779 -0.2381 7.6569
2 0.1556 0.2411 1.5495 0.5814 -0.2355 7.6596
3 0.1549 0.2427 1.5668 0.5883 -0.2304 7.6647
Real spring 1 0.1749 0.2042 1.1675 0.4318 -0.3648 7.5303
2 0.1744 0.2053 1.1772 0.4355 -0.3610 7.5341
3 0.1738 0.2063 1.1870 0.4393 -0.3572 7.5379
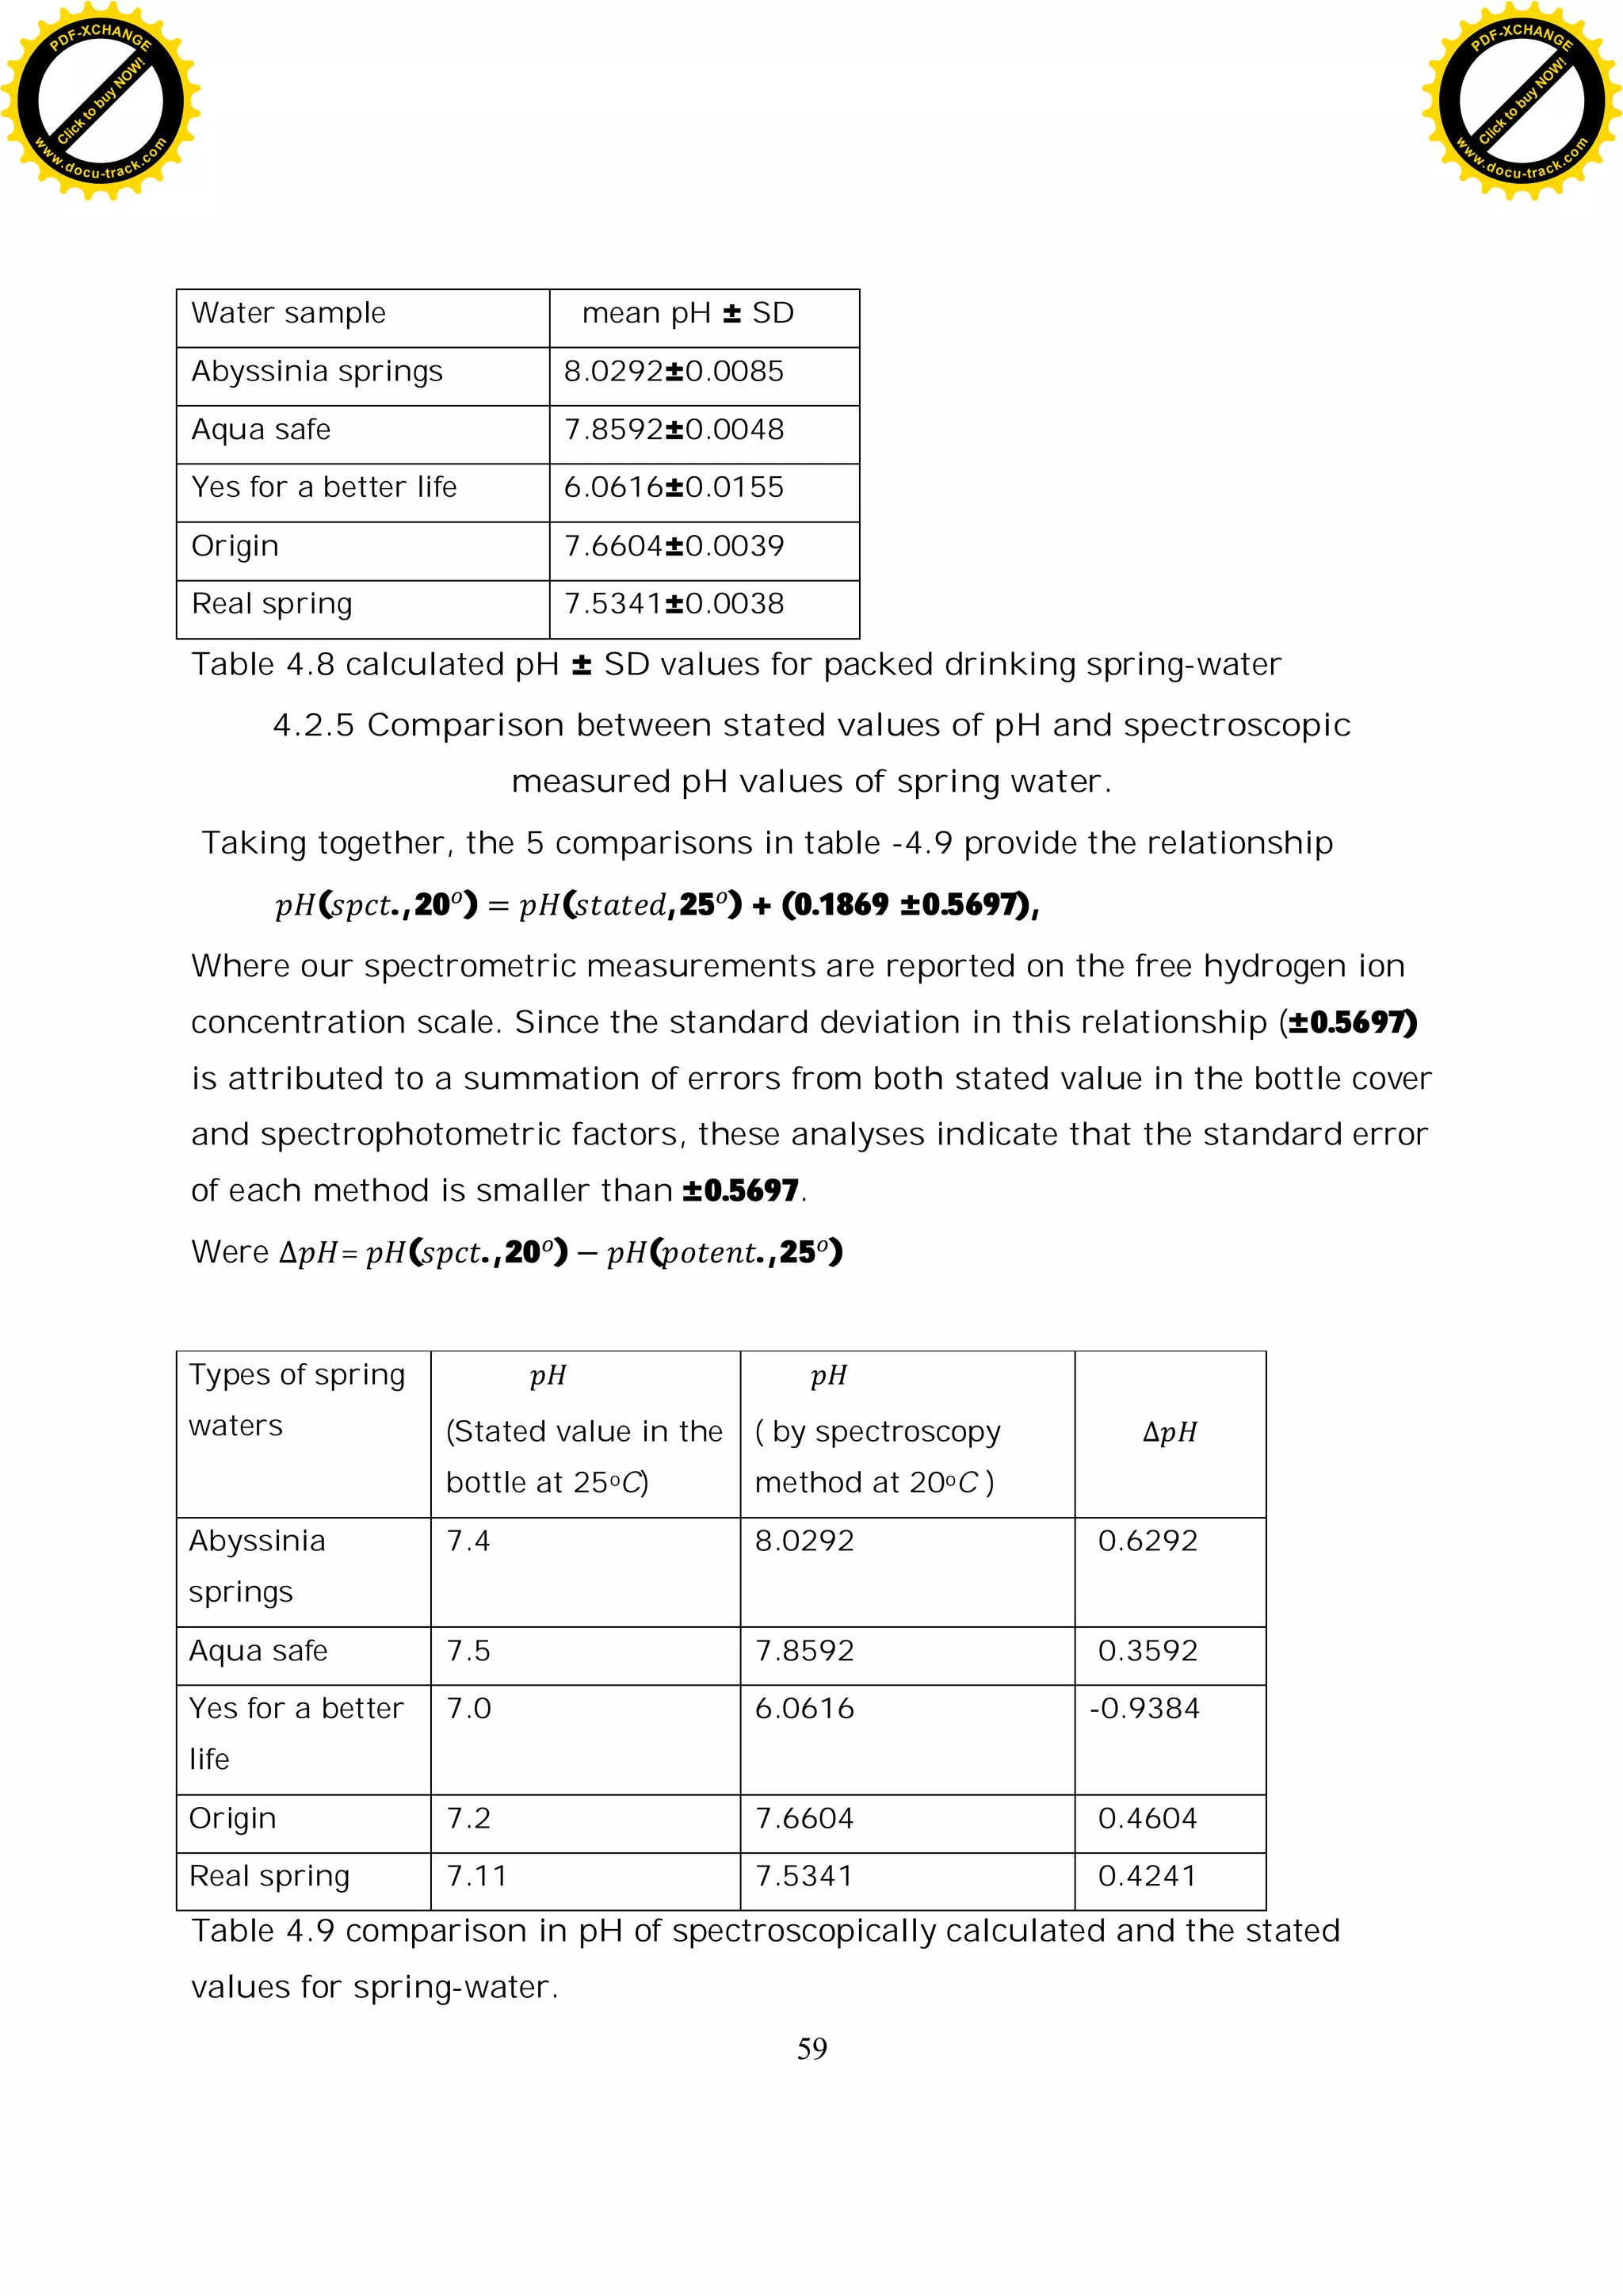
Table 4.7 calculated pH values of five different packed drinking spring-water
The mean pH for each type of packed spring water and the precision in
measurement are shown in table-4.8 below. The average precision of the
measurement is 0.0073 pH unit.
C
l
i
c
k
t
o
b
u
y
N
O
W
!
PDF-XCHANGE
w
w
w
.docu-track.c
o
m
C
l
i
c
k
t
o
b
u
y
N
O
W
!
PDF-XCHANGE
w
w
w
.docu-track.c
o
m](https://image.slidesharecdn.com/tewodrosadaro-220410151640/75/Spectroscopic-pH-Measurement-Using-Phenol-Red-Dye-58-2048.jpg)


![ANTIBIOTICS[PENICILLINS] MEDICINAL CHEMISTRY BY RAVISANKAR](https://cdn.slidesharecdn.com/ss_thumbnails/penicillin-1-ppt-new-130616074411-phpapp02-thumbnail.jpg?width=640&height=640&fit=bounds)


