Downloaded 222 times

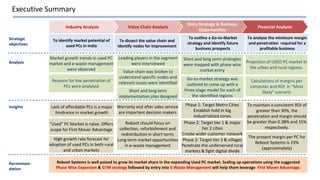


The document outlines a strategic plan for Reboot Systems to capture market share in the expanding used PC market in India, emphasizing a phased entry strategy targeting metro, tier 1, and tier 2 cities. It highlights the potential for growth driven by factors such as low PC penetration and a growing e-waste management market, suggesting a three-stage go-to-market approach. Key recommendations include focusing on collection, refurbishment, and after-sales service while maintaining profitability through adequate margins and market capture rates.


