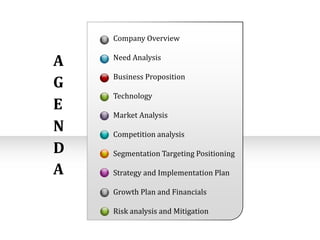
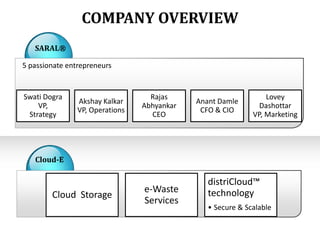
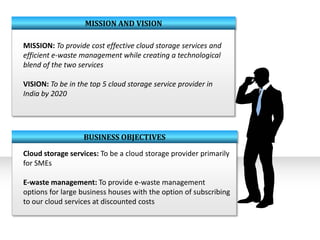
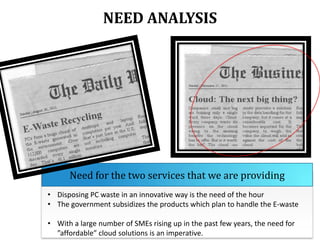
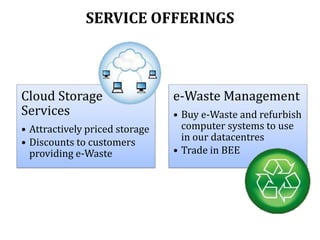
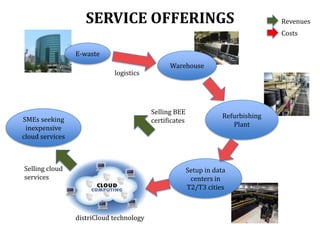
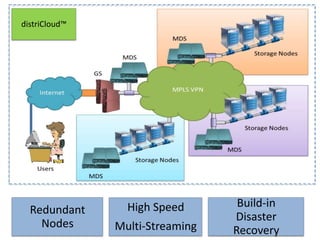
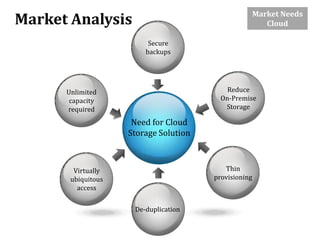
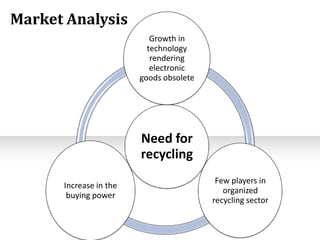
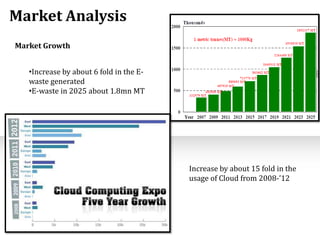
BUSINESS PLAN
SARAL®

Team Members

Akshay Kalkar
Anant Damle
Lovey Dashottar
Rajas Abhyankar
Swati Dogra

Cloud-E

Inspiration
When the cloud can
nurture the
environment, why
should the Internet
cloud be any
different?
Company Overview

A
G
E
N
D
A

Need Analysis
Business Proposition
Technology
Market Analysis
Competition analysis
Segmentation Targeting Positioning
Strategy and Implementation Plan
Growth Plan and Financials
Risk analysis and Mitigation
COMPANY OVERVIEW
SARAL®
5 passionate entrepreneurs

Swati Dogra
VP,
Strategy

Akshay Kalkar
VP, Operations

Rajas
Abhyankar
CEO

Anant Damle
CFO & CIO

Lovey
Dashottar
VP, Marketing

Cloud-E

Cloud Storage

e-Waste
Services

distriCloud™
technology
• Secure & Scalable
MISSION AND VISION
MISSION: To provide cost effective cloud storage services and
efficient e-waste management while creating a technological
blend of the two services
VISION: To be in the top 5 cloud storage service provider in
India by 2020

BUSINESS OBJECTIVES
Cloud storage services: To be a cloud storage provider primarily
for SMEs
E-waste management: To provide e-waste management
options for large business houses with the option of subscribing
to our cloud services at discounted costs
NEED ANALYSIS

Need for the two services that we are providing
• Disposing PC waste in an innovative way is the need of the hour
• The government subsidizes the products which plan to handle the E-waste
• With a large number of SMEs rising up in the past few years, the need for
”affordable” cloud solutions is an imperative.
SERVICE OFFERINGS

Cloud Storage
Services
• Attractively priced storage
• Discounts to customers
providing e-Waste

e-Waste Management
• Buy e-Waste and refurbish
computer systems to use
in our datacentres
• Trade in BEE
SERVICE OFFERINGS

Revenues
Costs

E-waste

logistics

Warehouse

Selling BEE
certificates

SMEs seeking
inexpensive
cloud services

Selling cloud
services

Refurbishing
Plant

Setup in data
centers in
T2/T3 cities

distriCloud technology
distriCloud™

Redundant
Nodes

High Speed
Multi-Streaming

Build-in
Disaster
Recovery
Market Needs
Cloud

Market Analysis
Secure
backups

Reduce
On-Premise
Storage

Unlimited
capacity
required

Need for Cloud
Storage Solution

Thin
provisioning

Virtually
ubiquitous
access
De-duplication
Market Analysis
Growth in
technology
rendering
electronic
goods obsolete

Need for
recycling
Increase in the
buying power

Few players in
organized
recycling sector
Market Analysis
Market Growth
•Increase by about 6 fold in the Ewaste generated
•E-waste in 2025 about 1.8mn MT

Increase by about 15 fold in the
usage of Cloud from 2008-’12
Growth Drivers

India moving to
Cloud

Use of Cloud for
Analytics

Gartner predicts
pick-up of Cloud
from 2012

Spending on Cloud
to increase by
23.6%

Scale-out Storage

20mn obsolete
computers / year

50% of e-Waste
generated in 3 cities
- Mumbai, Delhi and
Bangalore

35% in Western
Region

40% of obsolete PCs
lie unused
Market Analysis

Industry Analysis:
Cloud

Substitutes
MEDIUM

Standard few dominant relatively higher for
Supplier
Competitive
Services are
Only
Large number
Buyer Power
Large Corporation
Power
Products asplayers
differentiated
Rivalry
LOW
customers
of providers
HIGH
LOW
Inputs

Large number of
new entrants
from SMEs

New
Low cost of
Entrantsswitching to this
Low fixed costs
HIGH new technology

Relative lack of
government
restrictions.
Market Analysis
Strength

Weakness

• Fast Changing technology rendering
electronics obsolete
• Rising commodity prices result in
• Increased profitability in recycling
• Increasing availability of new technologies
for efficient and cost effective recycling

• The organised waste and recycling
• Industry has just begun
• Margins in the industry are currently low
• Price fluctuations for recycled materials are
high

e-Waste
Opportunity
• Mandatory requirement from 1 May 2012
• Consolidation by Merger & Acquisitions

Threat
• Competition from Un-organised players.
• Less awareness
• Tougher regulations
COMPETITION ANALYSIS
Cloud Storage
Non-formal Sector
Google Apps
Differentiation +
Cost leadership.

 95% of the e-waste in India is
being recycled in non-formal
sector
 3000 units in and around major
cities engaged in these activities

Amazon Cloud
Focus strategies

Apple iCloud
Innovation

e-Waste

Formal Sector

Only 5 % of the players operate
in this sector in India
SEGMENTATION AND TARGETING
Market Segmentation for Cloud Storage
Social media, Entertainment, Design and PR agencies, Media Houses, Retail, Web
Entrepreneurs, Education & Research, Non-Profit & Government organizations
Targeting
SMEs in the above mentioned segments
Mid market players seeking low cost solutions

Top 10 e-waste
producing
Cities

Market Segmentation for E waste
State owned enterprises (e.g. BSNL, MTNL)
Corporate houses (e.g. HP, IBM)
Micro, small and medium enterprises (MSMEs)
Targeting
Large Corporate Houses like HP, IBM, Dell, etc to leverage on their superior
supply chain and logistics
Tie ups with these large corporate will help us obtain e waste equipment in
bulk and volumes.

Top 10 e-waste
producing States
STRATEGY AND IMPLEMENTATION
Cost Leadership
distriCloud technology (a
patent of the company) will
transfer the cost advantage
to a revenue advantage.

Points of
Differentiation
(POD)

Competitive Edge.
•Unique green initiative
product
•Integrates E-waste mgmt
sector with the cloud sector

Strategy &
Implementation

Points of Parity
(POP)

Revenue Generation
Cloud Storage
BEE Certificates

Competitive Edge
MARKETING STRATEGY – 4PS
Positioning Statement
For the SMEs aspiring to go on
the cloud, CloudE is the most cost
effective cloud solution which is
high performing, secure and
green, because we use the
patented distriCloud technology.

Pricing
Factors:
• Demand Curve :data usage by
the customer
• Costs Drivers
• Environment and sector
• Pricing Type: Cost Plus
MARKETING STRATEGY – 4PS
Promotions
• Social network integration
targeting SME
• ‘Test drive the cloud’ for the
SME
• Free Workshops for the
companies near Pune-Mumbaibangalore-Gujarat
• Discounts in the cloud solutions
to the E-waste suppliers

Place

•Start off with cities with High
SME concentration-Pune,
Mumbai, Gujarat
•Target Tier2 & Tier-3 cities
SALES FUNNEL
Online advertising,
direct mail, email
blasts, direct
advertising, salesman
visits
Leads and enquiries,
direct field qualification
and sale, salesman
visits
Align to customer
needs. Asses
requirement, RFP,
suggest custom solution
Finalize the deal and
close it
SALES TARGET
STRATEGIC ALLIANCES
PC
manufactur
eres
Cloud
Service
Providers

IT
Distributors

Mobile
networking
Providers

Public
Sector
Clients

Cloud-E

Logistics
Provider

Outsourcing

Startups
GROWTH PLANS AND FINANCIALS
Cash Flow

Existing

Millions

YOY Customer base
New Users

₹
160.00
₹ 140.00
₹ 120.00

10000

₹ 100.00
₹ 80.00

5000

₹ 60.00

0

₹ 40.00

2013

2014

2015

₹ 20.00
₹
-

Year

2012 (Year 0)
₹
-20.00

2015

2018

2021

Projected YoY Financials
(₹ million)

₹ 389.21

PAT
₹ 289.01

Revenues
₹ 214.66
₹ 159.42
₹ 87.91

₹ 65.27
₹ 48.47
₹ 36.00
₹ 19.76
₹ 14.79
₹ 13.91
₹ 11.42
2013

2014

2015

*All estimates are pessimistic or
at best realistic

2016

₹
130.43

₹ 118.38
₹ 25.25
2017
Year

₹ 37.83

2018

₹ 59.70

2019

₹ 89.63

2020

2021
GROWTH PLANS AND FINANCIALS
Year
2012 (Year 0)2013
Revenues
0.00
Expenses
0.05
EBITDA
-0.05
Amortization
0.00
EBIT
-0.05
Interest Expense 0.00
PBT
-0.05
Tax
0.00
PAT
-0.05
Cash Flow
-0.80

2014
3.60
1.35
2.25
0.26
1.99
0.09
1.90
0.76
1.14
0.93

2015
4.85
2.06
2.78
0.33
2.45
0.13
2.32
0.93
1.39
1.13

Revenues

2017

₹ 12 Cr

~14k users

2016
6.53
3.31
3.22
0.56
2.66
0.20
2.47
0.99
1.48
1.41

2017
8.79
4.45
4.34
0.78
3.56
0.27
3.29
1.32
1.98
1.91

11.84
6.11
5.73
1.15
4.57
0.36
4.21
1.68
2.53
2.52

Projected P&L
(All figures in ₹
Crores)

36% CAGR
(Revenue)

ROI
~90%

Total
Investment
₹30 Cr

₹ Cr – Debt
8
₹ Cr – Self
12
₹ Cr – VC/PE
10
Risk Analysis and Mitigation
People &
Culture

Financial

Macro
Economic

Scalability

Skilled
people in
T2/3 cities

Insufficient
Cash flows

Policy
Changes & IT
Acts

Expansion to
multiple
Locations

Training &
Performance
Pay

Keep Low
Financial
Leverage

Connect with
Lobby

Planned
expansion to
select T2/3
cities
Milestones

2014

2015

Brand Building
Greener
solutionsCloudE

3 years
experience

Complete Sales
and Marketing
team formation

Providing
solutions to the
Govt.
Associations

2016
Strategic
Alliance:
Computer
Manufacturers
THANK YOU

Cloud-E: Cloud Services from e-waste

  • 1.
    BUSINESS PLAN SARAL® Team Members AkshayKalkar Anant Damle Lovey Dashottar Rajas Abhyankar Swati Dogra Cloud-E Inspiration When the cloud can nurture the environment, why should the Internet cloud be any different?
  • 2.
    Company Overview A G E N D A Need Analysis BusinessProposition Technology Market Analysis Competition analysis Segmentation Targeting Positioning Strategy and Implementation Plan Growth Plan and Financials Risk analysis and Mitigation
  • 3.
    COMPANY OVERVIEW SARAL® 5 passionateentrepreneurs Swati Dogra VP, Strategy Akshay Kalkar VP, Operations Rajas Abhyankar CEO Anant Damle CFO & CIO Lovey Dashottar VP, Marketing Cloud-E Cloud Storage e-Waste Services distriCloud™ technology • Secure & Scalable
  • 4.
    MISSION AND VISION MISSION:To provide cost effective cloud storage services and efficient e-waste management while creating a technological blend of the two services VISION: To be in the top 5 cloud storage service provider in India by 2020 BUSINESS OBJECTIVES Cloud storage services: To be a cloud storage provider primarily for SMEs E-waste management: To provide e-waste management options for large business houses with the option of subscribing to our cloud services at discounted costs
  • 5.
    NEED ANALYSIS Need forthe two services that we are providing • Disposing PC waste in an innovative way is the need of the hour • The government subsidizes the products which plan to handle the E-waste • With a large number of SMEs rising up in the past few years, the need for ”affordable” cloud solutions is an imperative.
  • 6.
    SERVICE OFFERINGS Cloud Storage Services •Attractively priced storage • Discounts to customers providing e-Waste e-Waste Management • Buy e-Waste and refurbish computer systems to use in our datacentres • Trade in BEE
  • 7.
    SERVICE OFFERINGS Revenues Costs E-waste logistics Warehouse Selling BEE certificates SMEsseeking inexpensive cloud services Selling cloud services Refurbishing Plant Setup in data centers in T2/T3 cities distriCloud technology
  • 8.
  • 9.
    Market Needs Cloud Market Analysis Secure backups Reduce On-Premise Storage Unlimited capacity required Needfor Cloud Storage Solution Thin provisioning Virtually ubiquitous access De-duplication
  • 10.
    Market Analysis Growth in technology rendering electronic goodsobsolete Need for recycling Increase in the buying power Few players in organized recycling sector
  • 11.
    Market Analysis Market Growth •Increaseby about 6 fold in the Ewaste generated •E-waste in 2025 about 1.8mn MT Increase by about 15 fold in the usage of Cloud from 2008-’12
  • 12.
    Growth Drivers India movingto Cloud Use of Cloud for Analytics Gartner predicts pick-up of Cloud from 2012 Spending on Cloud to increase by 23.6% Scale-out Storage 20mn obsolete computers / year 50% of e-Waste generated in 3 cities - Mumbai, Delhi and Bangalore 35% in Western Region 40% of obsolete PCs lie unused
  • 13.
    Market Analysis Industry Analysis: Cloud Substitutes MEDIUM Standardfew dominant relatively higher for Supplier Competitive Services are Only Large number Buyer Power Large Corporation Power Products asplayers differentiated Rivalry LOW customers of providers HIGH LOW Inputs Large number of new entrants from SMEs New Low cost of Entrantsswitching to this Low fixed costs HIGH new technology Relative lack of government restrictions.
  • 14.
    Market Analysis Strength Weakness • FastChanging technology rendering electronics obsolete • Rising commodity prices result in • Increased profitability in recycling • Increasing availability of new technologies for efficient and cost effective recycling • The organised waste and recycling • Industry has just begun • Margins in the industry are currently low • Price fluctuations for recycled materials are high e-Waste Opportunity • Mandatory requirement from 1 May 2012 • Consolidation by Merger & Acquisitions Threat • Competition from Un-organised players. • Less awareness • Tougher regulations
  • 15.
    COMPETITION ANALYSIS Cloud Storage Non-formalSector Google Apps Differentiation + Cost leadership.  95% of the e-waste in India is being recycled in non-formal sector  3000 units in and around major cities engaged in these activities Amazon Cloud Focus strategies Apple iCloud Innovation e-Waste Formal Sector Only 5 % of the players operate in this sector in India
  • 16.
    SEGMENTATION AND TARGETING MarketSegmentation for Cloud Storage Social media, Entertainment, Design and PR agencies, Media Houses, Retail, Web Entrepreneurs, Education & Research, Non-Profit & Government organizations Targeting SMEs in the above mentioned segments Mid market players seeking low cost solutions Top 10 e-waste producing Cities Market Segmentation for E waste State owned enterprises (e.g. BSNL, MTNL) Corporate houses (e.g. HP, IBM) Micro, small and medium enterprises (MSMEs) Targeting Large Corporate Houses like HP, IBM, Dell, etc to leverage on their superior supply chain and logistics Tie ups with these large corporate will help us obtain e waste equipment in bulk and volumes. Top 10 e-waste producing States
  • 17.
    STRATEGY AND IMPLEMENTATION CostLeadership distriCloud technology (a patent of the company) will transfer the cost advantage to a revenue advantage. Points of Differentiation (POD) Competitive Edge. •Unique green initiative product •Integrates E-waste mgmt sector with the cloud sector Strategy & Implementation Points of Parity (POP) Revenue Generation Cloud Storage BEE Certificates Competitive Edge
  • 18.
    MARKETING STRATEGY –4PS Positioning Statement For the SMEs aspiring to go on the cloud, CloudE is the most cost effective cloud solution which is high performing, secure and green, because we use the patented distriCloud technology. Pricing Factors: • Demand Curve :data usage by the customer • Costs Drivers • Environment and sector • Pricing Type: Cost Plus
  • 19.
    MARKETING STRATEGY –4PS Promotions • Social network integration targeting SME • ‘Test drive the cloud’ for the SME • Free Workshops for the companies near Pune-Mumbaibangalore-Gujarat • Discounts in the cloud solutions to the E-waste suppliers Place •Start off with cities with High SME concentration-Pune, Mumbai, Gujarat •Target Tier2 & Tier-3 cities
  • 20.
    SALES FUNNEL Online advertising, directmail, email blasts, direct advertising, salesman visits Leads and enquiries, direct field qualification and sale, salesman visits Align to customer needs. Asses requirement, RFP, suggest custom solution Finalize the deal and close it
  • 21.
  • 22.
  • 23.
    GROWTH PLANS ANDFINANCIALS Cash Flow Existing Millions YOY Customer base New Users ₹ 160.00 ₹ 140.00 ₹ 120.00 10000 ₹ 100.00 ₹ 80.00 5000 ₹ 60.00 0 ₹ 40.00 2013 2014 2015 ₹ 20.00 ₹ - Year 2012 (Year 0) ₹ -20.00 2015 2018 2021 Projected YoY Financials (₹ million) ₹ 389.21 PAT ₹ 289.01 Revenues ₹ 214.66 ₹ 159.42 ₹ 87.91 ₹ 65.27 ₹ 48.47 ₹ 36.00 ₹ 19.76 ₹ 14.79 ₹ 13.91 ₹ 11.42 2013 2014 2015 *All estimates are pessimistic or at best realistic 2016 ₹ 130.43 ₹ 118.38 ₹ 25.25 2017 Year ₹ 37.83 2018 ₹ 59.70 2019 ₹ 89.63 2020 2021
  • 24.
    GROWTH PLANS ANDFINANCIALS Year 2012 (Year 0)2013 Revenues 0.00 Expenses 0.05 EBITDA -0.05 Amortization 0.00 EBIT -0.05 Interest Expense 0.00 PBT -0.05 Tax 0.00 PAT -0.05 Cash Flow -0.80 2014 3.60 1.35 2.25 0.26 1.99 0.09 1.90 0.76 1.14 0.93 2015 4.85 2.06 2.78 0.33 2.45 0.13 2.32 0.93 1.39 1.13 Revenues 2017 ₹ 12 Cr ~14k users 2016 6.53 3.31 3.22 0.56 2.66 0.20 2.47 0.99 1.48 1.41 2017 8.79 4.45 4.34 0.78 3.56 0.27 3.29 1.32 1.98 1.91 11.84 6.11 5.73 1.15 4.57 0.36 4.21 1.68 2.53 2.52 Projected P&L (All figures in ₹ Crores) 36% CAGR (Revenue) ROI ~90% Total Investment ₹30 Cr ₹ Cr – Debt 8 ₹ Cr – Self 12 ₹ Cr – VC/PE 10
  • 25.
    Risk Analysis andMitigation People & Culture Financial Macro Economic Scalability Skilled people in T2/3 cities Insufficient Cash flows Policy Changes & IT Acts Expansion to multiple Locations Training & Performance Pay Keep Low Financial Leverage Connect with Lobby Planned expansion to select T2/3 cities
  • 26.
    Milestones 2014 2015 Brand Building Greener solutionsCloudE 3 years experience CompleteSales and Marketing team formation Providing solutions to the Govt. Associations 2016 Strategic Alliance: Computer Manufacturers
  • 27.

Editor's Notes

  • #3 Content Background informationSummaryPersonal resources and goalsThe product or serviceThe marketSale and marketing planManagement & organisationDevelopment of the businessBudgetsFinancial requirementsAppendices
  • #8 Setup in T2/T3SourcingControl SystemsControl systems are high-redundancy cutting edge server systems handling all the control logic, system management and monitoringThese shall be sourced from leading server providers like Dell, IBM or HP.Storage NodesThe storage nodes are inexpensive systems, which shall be obsolete/refurbished computers procured through the e-Waste service, These will provide the company very low cost hardware.