1. FACTOR ANALYSIS
We use factor analysis to study complex product or service to identify the major
characteristics considered important by the consumer of the product or service.
Example: Researchers for an automobile company may ask large sample of potential
buyers to report (7 or 10 or 11-point scale), the extent of their agreement or disagreement
with the following factors:
1. The side profile of the car should be sleek.
2. A car’s breaks are its most critical part.
3. Identify safety, exterior styling, interior rooming or economy of operations by
potential customers.
Note: Researchers use interval scale or continuous scale to measure the variables in
respect of the above example.
Factor analysis guide to design the product to meet the needs or expectations of the
prospective consumer or identify the themes that potential customers consider important.
What Factor Analysis does
Using the data from the large sample, factor analysis applies advanced form of
correlation analysis to the responses to a number of statements. The purpose of analysis is
to determine if the responses to several of the statements are highly correlated, i.e.
statements measure some factor commonality among them.
Example: Consider the following statement:
1. A car’s breaks are its most critical part.
2. I want my next car should be equipped with an ‘air bag’
3. A collapsible steering column should be a standard one in all cars.
The above set of statements indicates an underlying concern with the factor of safety.
Factor analysis involves many statements. The statements in any one set are highly
correlated but are not highly correlated with the statement in any other set.
Types of variables used in Factor Analysis
Factor analysis can only applied to:
1. Continuous variables
2. Interval scaled variables
Factor Analysis identifies interdependencies among variables
1. Factor analysis uses more than one variable to identify a class or category that is
important from a marketing standpoint.
2. 2. Factor analysis identifies two or more questions that result in sets of responses
that are highly correlated.
An example of Factor Analysis application, in respect of a compact car:
1. A car’s breaks are its most critical part.
2. I want my next car should be equipped with an ‘air bag’
3. A collapsible steering column should be a standard one in all cars.
4. Four adults should be able to comfortably sit in a compact car.
5. Mileage in a compact car should be, at least, 18 km. per liter of petrol.
Three hundred individuals gave their responses to 100 statements each on a 7-point scale
in respect of the above-mentioned example. There were 100 such distributions, one for
each of the 100 statements.
The researcher applies factor analysis to the data to identify the major characteristics that
potential buyers of the compact cars consider important. In this regard, the following
description treats five factor analysis topics:
1. three important measures
2. the role of correlation
3. the identification of factors
4. the output of factor analysis
5. evaluating how well the fit
Three Important measures
1. The variance
2. Standardised Scores of an individuals responses
3. The role of correlation
Variance: A factor analysis like regression analysis tries to ‘best fit” factors to a
scattered diagram of the data to show that factors explain the variance associated with the
response to each statement.
Regression equation fitted to a scattered diagram of responses to variable ‘y’ and ‘x’
helps to explain the variance observed in the responses to variable y. A user of regression
analysis would like to explain 100% of the variance, in a dependent variable – i.e. get an
R2
= 1.00 -, the user of factor analysis would also like to explain 100% of variance
associated with each statement used in the study.
Standardised Scores of Individual Responses: Answers to some questions may be
recorded on a 7-point scale and some other questions on a 10-point scale. For the purpose
of comparison, the responses to the questions on different scales have to be standardised
as explained below:
3. It is possible to calculate the mean and the standard deviation of all the responses to each
statement. Similarly, an individual’s actual response to a statement can be standardised
by using the following relationship.
Individual’s actual Mean of all 300
response to the responses to the
the statement statement
Individual’s standardised
Score on the statement =
Standard deviation of all the 300
responses to the statement
The individual standardised score is the actual response measured in terms of number of
standard deviations (+ or -), it lies away from the mean. Therefore, each standardised
score is likely to be a value somewhere in the range of +3 and -3 with +3.00 typically
being equated to the ‘agree very strongly’ and -3.00 typically being equated to the
‘disagree very strongly’ response.
The Role of Correlation
The role of correlation in factor analysis can be explained by using fewer than 100
statements. We assume using six statements as mentioned in page No.2, and calculate the
correlation coefficients for all the possible pairs of statements.
To illustrate the role of correlation coefficient factor analysis, we assume two factors
exist in the set of data. Please refer to table 17-2 matrix of correlation coefficients
between pairs of statement for example of two factors and the following explanation:
The correlation coefficient associated with the response to statements 1 and 2 shows
perfect correlation existed between the two statements. There is also very high correlation
resulted from the responses to statement 2 and 3. The responses to statement 4, 5 and 6
are also highly correlated with each other. However, the responses to statements 1, 2 and
3 are highly correlated, but are completely uncorrelated with responses to statement 4, 5
and 6. Similarly, the responses to statements 4, 5 and 6 1, 2 and 3 are highly correlated,
but are completely uncorrelated with responses to statement 1, 2 and 3. From this
findings, the researchers have evidence to suggest that two factors exists in the data – one
factor associated with statement 1,2 , and 3 and another factor with statement 4,5, and 6
Basic concept in the role of correlation
1. The statement in any set need to be highly correlated with each other say r = 0.7
or larger. They need not have to be perfectly correlated.
2. As different sets of statements are relatively uncorrelated with each other, a
separate or direct factor is associated with each set.
The identification of factors
Factors are linear equations of variables (i.e. the statements), measured during the course
of the study. Fig. 17-3 shows a scattered diagram of the standardised scores on two factor
4. analysis variables X1 and X2. The figure also shows two factors fitted to the data. We can
write the equation for the said two factors as follows:
First factor equation : F1 = 0.6 X1 + 0.4 X2
Second factor equation : F2 = 0.4 X1 + 0.6 X2
Thus, each factor is a weighted, linear combination of the two variables being analyzed.
For example, where four factors are involved the terms of variables can be expressed as
X1, X2, X3, and X4.
The important measures used in factor analysis are – the variance associated with the
standardised responses to each statement in the study. Factor analysis selects one factor at
a time using procedures that ‘best fir’ each other to the data. Each additional factor
explains less of the variance than the first factor or any other factors identified
previously. Each factor selected after the first factor must be uncorrelated with factors
already selected. This process continues until the procedure cannot find additional factors
that significantly reduce the unexplained variance in the standard scores.
Factor loadings
Please refer to table 17-3. The 18 numbers located in the six rows and three columns are
called factor loadings, one of the three useful output obtained from a factor analysis.
Please refer to Fig 17-4a for the statements mentioned in table 17-3 for the concept of
high correlation. Factor 1 is highly correlated with the responses to statement X1 (0.84
correlations) and with responses to statement 2 (0.84 correlation).
Please refer to Fig 17-4b for the statements mentioned in table 17-3 for the concept of
how uncorrelated. Here, the statements 1 and 2 are not highly correlated (012 and 0.18
respectively) with factor 2 as illustrated in Fig. 17-4b. Thus, a factor loading is a measure
of how well the factor fits the standardised response to a statement.
Naming Factors and measuring their Importance
From table 17-3:
Factor 1 (F1) is a good fit on the data from statement 1, 2, and 3 but a poor fit on other
statements. Statement 1, 2, and 3 probably measuring the same basic attitude or value
system, confirms that a factor exists. “Economy of operations” was the factor that tied
these statements together in the minds of the respondents.
Researchers now wanted to know whether 300 respondents participated in this study
mostly agreed with or disagreed with the statement 1, 2 and 3. They found the means of
these responses were +0.97, +1.32, and +1.18 respectively for statement 1, 2, and 3,
indicating that most of the respondents agreed with the three statements, the researchers
5. concluded that factor ‘economy of operation” was important in the minds of the compact
car buyers.
Factor 2 (F2), is a good fit on the statements 4 and 5, but a poor fit on other statements.
This factor is different from statements 1, 2, 3 and 6. Researchers concluded that factor
“interior roominess” was important.
Factor 3 is a good fit on statement 6 relating to “safety”.
As there were two and one statement for factor 2 and 3, the researchers were less
confident of identification of F2 an F3.
The researchers concluded “interior roominess” is an important factor with statements 4
and 5 (with the means of +0.91 and +1.22 respectively). As the mean was + 0.07 in
respect of statement 6, the researchers were unable to conclude, that “Safety” was
considered important.
Evaluating How well the data Fits (Second factor)
Communalities indicate the proportion of the variance in the responses to the statement,
which is explained by the three identified factors.
For statement 5, three factors explain 0.89 (89%) but only 0.54 (54%) variance for
statement 3. the table 17-3 shows that three factors explain 75% or more of the variance
associated with statements 1,2,4,5, and 6, but only half of statement 3’s variance.
Researchers use communalities to find out ‘how well the factors fit the data’. As three
factors account for most of the variance stated with each of the six statements, the three
factors fit the data quite well.
Eigen Value (third factor)
Eigen value helps to find out ‘how well a factor fits the data from all of the respondents
on all the statement’. There is an eigen value associated with each of the factors. When a
factor’s eigen value is divided by the number of statements used in factor analysis, the
resulting figure is the proportion of the variance in the entire set of standardised response
scores, which is explained by the factor.
Example:
Factor F1, explains 0.3226 (or 32.26%) of the variance of the standardised scores from all
of the respondents on all six statements. By adding the variance of the standardised
scores for all the three factors, the variance for the entire set of response data is 77.07%
(0.3226 + 0.3090 + 0.1391 = 0.7707 (or 77.07%). This figure can be used as a measure
‘how well, overall, identified factors fit the data’. In general, a factor analysis that
6. accounts for 60-70% or more of the total variance can be considered a good fit to the
data.
Usefulness of Factor analysis
Users of the product or services have difficulty in identifying the characteristics that are
important to them. The advantage of using Factor Analysis helps the researchers to
identify the important characteristics of products or services perfectly that are so
complex.
Problems in using Factor analysis
1. A factor analysis is of little use if the
a. appropriate variables have not been measured, or
b. if the measurements are inaccurate, or
c. if the relationship in the data are nonlinear
2. Deciding how many identified factors one should use in factor analysis. In
example referred in page 5 of this note, the third factor explains an additional
13.91% of the total variance. The addition of this variance substantially increases
the variance from 63.16% to 77.07%. The increase is almost one fourth. The said
increase is reasonable. We may not use the third factor, if the increase explains
only 2 or 3 %. We may not.
3. The third difficulty is to identifying and naming of the factors. For example
‘economy of operation’ in a compact car, we may not know exactly the measure
of this factor.
7. CLUSTER ANALYSIS
We can find the application of cluster analysis in market segment studies. Researchers
use cluster analysis to segment the market based on several attitudes or variables. Cluster
analysis is different from identifying different market segments based on one variable
only (e.g. heavy users, average users, or prefer brand A or prefer brand B).
We can study in cluster analysis the different segments that exist in the total market for
any given product (e.g. sports goods). The analysis identifies clusters of respondents who
have given the same answers to a certain combination of questions. We use interval scale
or continuous scale to measure the variable.
Example: A large sample of users is asked to report their attitudes regarding their
preferences for indoor or outdoor sports, their preference for rugged or easy sporting
activities. Here, we use cluster analysis on the above-mentioned data to see whether total
market consists of a number of different segments.
What Cluster analysis does
Cluster analysis identifies different groups – e.g. the respondents in one cluster are
similar to each other but different from the respondents in any other clusters.
Cluster analysis is applied to data consisting of many variables collected from a large
sample of respondents. The cluster analysis set the procedures, search through the data
and identifies identical or similar answers to certain combination of the questions. These
respondents are formed into one character.
Then search through the data looking for a second set of respondents, who have given
similar answers to some other combination of questions. Thus, the second cluster
respondents are similar but quite different from the First cluster. Similarly, we can
identify third cluster, which is different from the first two clusters. This procedure has to
be continued until all of the clusters have been identified.
Cluster Analysis identifies Interdependencies among variables:
Some of the Multivariate methods – cross-tabulation, LDA (linear Description Analysis)
and AID (Automatic interaction Deduction) are concerned with a single variable to
identify a class or a category into which a respondent belonged.
8. Multiple-variable classification is used whenever it is useful to marketing decision than
single-variable classification. Cluster analysis is concerned with interdependencies
among a number of variables measured in the study, especially with different sub sets of
respondents. This will help researchers to understand when and how the cluster analysis
can be better used.
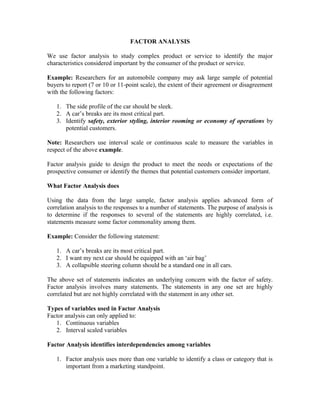
An Example of Cluster analysis
A large sample of sports-active individuals was asked to respond following in a 10- point
scale.
1. Their preference for indoor vs. outdoor sports (variable X1).
2. Their preference for rugged and heavy Vs. Easy and light activities (variable X2).
Please refer to figure 17-1 for plot of data from Sporting Activities and Interests Study.
Each dot in Fig.17-1 represent the score on X1 (vertically) and X2 (horizontally).
Researchers can use this figure 17-1 to look for patterns of responses in the geometrical
space defined by variables X1 and X2. Researchers will look whether the number of
respondents answered two or more questions in the same or similar way.
There were 12 respondents. Respondent No.6 reported a score of eight on variable X1 and
two on variable X2. The scores of other respondents had also been plotted in the Fig.17-1.
There are three clusters with respondents 9, 11, and 12; 6, 7, 8 and 10; and 2, 3, and 4
respectively. Market for sporting equipment can be segmented based on:
a. indoor Vs. outdoor
b. rugged Vs. light activities
• Respondents 9, 11, and 12 are interested in hunting, mountain claiming
and motor cycle racing.
• Respondents 6, 7, 8, and 10 are interested in hiking, fishing and camping.
• Respondent 2, 3, and 4 enjoy in racquetball, indoor tennis and gymnastics.
They are interested in indoor activities which are not too easy, but also not
too rugged.
• Respondent 1 is a bowling enthusiast who preferred easy indoor activity
and
• Respondent 5 prefer rugged activities either indoor or outdoor.
The above-referred example involves only two variables. Another variable X3 is
included; it can be presented in three-dimensional space. If there are four or more
variables, the data can be laid in “n-dimensional space” where ‘n’ represents the number
of variables in the study.
9. Researchers will not be able to visualize if the study involves more than two or more
variables. Under such circumstances, we can use the following procedure to analyze the
data to determine whether the clusters do exist.
1. Developing measures to identify similar respondents and
2. Developing procedure for grouping similar respondents
Distance: A Commonly used Similarity Measure
Researchers must use some measure to identify the similarity between two respondents.
If there is no ideal way to measure the similarity, ‘distance’ between two respondents will
be used as a measure of similarity. Please refer to Fig.17-1, where the distance separating
respondents 7 and 8 is only one unit of variable X2. The distance between respondents 7
and 9 is seven units of variable X2. The distance between respondents 6 and 7 are small
they can be considered more similar than the respondents 7 and 9 as not very similar,
because of large distance. When the distance is small, then group them into one cluster.
Introducing a New Variable Symbol
So far, we have identified a variable with a single subscript viz. X1, X2, X3, ….. We now
need to introduce a new variable symbol with two subscripts X11, X15, … and X21, X25, …
The first subscript identifies the variable number (the score on the variable viz. the score)
and the second subscript identifies a specific respondent. X11 means variable X1 and
respondent No.1. The symbols used to identify the reported scores on variables 1 an2 by
respondents 1, 5, and 6 are given below:
Variable 1 Variable 2
Respondent No. symbol Score symbol Score
1 X11 2 X21 1
5 X15 5 X25 8
6 X16 8 X26 2
The ‘Distance’ formula
We commonly use Euclidean geometry to measure the distance in cluster analysis. The
distance between respondents 1 and 5 will be identified by a symbol D15. The distance
between 1 and 5 in a study where variables X1, X2, X3, …… Xn is calculated with the
following formula:
D15= (X11 - X15)2
+ (X21-X25)2
+ (X31-X35)2
+ … + (Xn1-Xn5)2
The second subscripts associated with each variable (1 and 5) identify that the formula is
being applied to data from respondents 1 and 5. X21 represents the data on variable 2,
10. obtained from respondent 1 and X35 represents the data on variable 3, obtained from
respondent 5.
The distance between respondents 1 and 5 is:
D15= (X11 - X15)2
+ (X21-X25)2
D15= (2- 5)2
+ (1-8)2
D15= 9 + 49 = 7.6
Please refer to table 17.1. Row 1 in column 5 the distance is 7.6 units between respondent
1 and 5. similarly, the distance between 2 and 9 are separated by a distance of 8.1 units as
shown in Row 2 in column 9.
The Single linkage rule:
The respondent will be placed into a group if the distance between the particular
respondent and any other single respondent already in the group is smaller than the pre-
established minimum distance (MD). The single linkage rule considers the following to
form clusters:
1. Pre-establish minimum distance (MD)
2. Form clusters (groups) who are very close by
3. Then include the respondents moderately close by
4. Include the respondents within MD
The procedures to form clusters are illustrated in Fig.17.2 for the data shown in Fig.17-1
and table 17-1.
Usefulness of Cluster Analysis
1. Used to identify different segments in a market based on a number of attitudinal
or behavioral variables as discussed in the above example.
2. Used to study different types of perfume users, different types of husbands,
different types of beer drinkers, and many other potential market segmentations.
Problem in using Cluster analysis
Researchers can encounter certain problems when using the cluster analysis. Careful
thought should be given to the following:
1. The variable to be measured
2. The similarity measure to be used
11. 3. Grouping procedure to be used
4. The selection of MD value
5. How good the Cluster Analysis is?
If minimum distance (MD) value is too large, the respondents who are not having
similarity will be included in the cluster. If minimum distance (MD) value is too small,
many respondents will not be included in any of the clusters.
We cannot perform any statistical test as to what is the ideal number of clusters.
Diagonal
Absolute