SlideShare a Scribd company logo
1 of 213
Presenting Statistical Results for Decision Making
At any enterprise, statistical results can point the way to better
decisions. This is especially true in health care, where trends or
changes in patient care or results can have powerful effects on
health care organizations — clinical effects, and financial
effects. Knowing the facts about trends and changes is crucial to
navigating them, which means that in many ways, statistical
results are powerful tools.
But they’re less powerful if nobody understands them. More
often than not, stakeholders in health care organizations are not
well versed in statistics or data analysis. Especially for these
stakeholders, it’s critical to make careful choices about which
numbers to include — and how to talk about those numbers.
Doing so helps you to present statistical results in a way that’s
understandable and actionable even for those with less data
literacy.
In this activity, you’ll have an opportunity to analyze a health
trend at a large urban hospital, and to decide which results of
the analysis are most important to communicate to the
stakeholders concerned with it.St. Anthony Medical CenterYour
Office
You are an analyst in the Quality Assurance department at St.
Anthony Medical Center, a large hospital in Minneapolis,
Minnesota. You have an email from David Brooks, the manager
of Quality Assurance, in which he explains your next
assignment.
EMAIL FROM DAVID BOOKS- QA MANAGER
Hello! So I’m aware that you’re relatively new around here, but
I’ve got to pull you in on an important project. Here’s the short
version, and I can answer questions later if this isn’t enough
background.
Since you’re in health care, you must know that hospital-
acquired conditions (HACs) are a big deal. Hospitals are
designed from the ground up to minimize them, but the fact is
that hospitals always have a lot of bugs floating around and that
means they’re a constant danger. And while we try to minimize
mistakes, health care professionals are human, and sometimes
mistakes cause real problems.
The hospital’s board is getting worked up about them again,
because we’ve had some high-profile cases where a patient went
home and had to be readmitted because of a mistake or an
infection they picked up while they were here. They’re worried
about PR, of course, but they’re worried about patient
outcomes, and — of course — financial reimbursement and
penalties, too.
What I need you to do is start working on a presentation about
HACs here, specifically as they relate to staffing levels and
skill mix. That presentation should explain our
recommendations to the board. You’ll want to include some
statistics to bolster our case, so take a look at the AHRQ
National Scorecard on Hospital-Acquired Conditions and the
CMS Hospital-Acquired Conditions Reduction Program. Look at
published research about the relationship between HACs and
staffing levels, too.
Let’s get this right; this is our chance to get the board to
understand that HACs will go down if they do what we
recommend.
Go talk to Rick Susskind first; he’s our senior data analyst and
he’s already been working on this. He has completed a data
analysis on this, and he can explain what the variables are.
You’ll have to talk to a few other people too, to get everything
you need.
David
NEXT EMAIL FROM RICK SUSSKIND- Senior Data Anlayst
i! I got your message about the HAC question. I’ve attached a
spreadsheet of the data analysis we’ve got on that.
Here are a few variables that might be unclear:
HAC_Rate: That’s the number of HACs per 1,000 discharges.
You could say it’s the measure for the extent of hospital errors.
Nursing_HPPD: That’s the number of nursing staff hours per
patient day. It’s the hospital’s nurse staffing level.
Skill_Mix: That’s obviously about skill mix, but specifically,
it’s the percentage of nursing staff hours that are provided by
registered nurses, as opposed to other professionals.
ALOS: That stands for average length of stay; it’s the number
of inpatient days per hospital discharge. It’s a measure of how
efficient the hospital is.
Let me know if you have other questions! Oh, you’ll need to
find out how many discharges we have per year. I don’t know
that, but Troy Holland, our vice president of patient services,
will know.
ATTACHMENT: HAC analysis
STAKEHOLDER CONVERSATIONS:
TROY HOLLAND- Vice President of Patient Services
It’s nice to meet you! Yep, I’ve got those discharge stats. I’m
assuming you’re confining your analysis to the last full year? If
so, the number of discharges for last year was 10,000. That
includes both adult and pediatric discharges.
What I don’t have is information about nurse staffing or costs.
For those, you’ll want to talk to Jackie, the chief nursing
officer.
JACKIE SANDOVAL- Chief Nursing Officer
Hello. I understand you need some data about our staff costs
related to nursing. I’ve got three numbers for you.
Our cost per nurse is $72,000. Now, that’s an average of nurses
and registered nurses.
Our cost per registered nurse is $85,000.
Per licensed practical nurse, it’s $52,000. Those numbers
include salary, benefits, and overhead.
You had asked about some other costs, but I don’t have those.
You’ll want to talk to the CFO, Owen Welch.
Owen Welch- Chief Financial Officer
Hey, I’ve only got a couple of minutes but here’s what you
asked about: Our cost per inpatient day is $2,600, and the
penalty per HAC is $5,700.
Follow- Up Email from David Brooks
HACs
From: David Brooks
To: Samantha Billig
Thanks for doing all that running around. Now that you’ve got
the data analysis you need, I’d like you to do some thinking
about what results you’re going to include in the presentation.
Remember, it’s the board, not a bunch of number geeks. You’ll
want to give them the statistical results they need to make a
decision, not just every bit of data we have.
Write down a list of numbers you’re thinking about including in
your presentation. We really need to make a data-driven
recommendation to the board, and I’d really appreciate your
expertise. Thanks!
Reply
January 2019
AHRQ National Scorecard on Hospital-Acquired Conditions
Updated Baseline Rates and Preliminary Results 2014–2017
Summary
Updated and new patient safety data for 2014 through 2017
continue to show a downward
trend in the annual number of hospital-acquired conditions
(HACs). As reported in 2016, from
2010 through 2014, the rate of HACs decreased 17 percent. New
and updated data for 2014 to
2016 show an 11 percent decrease. When preliminary data for
2017 are included, the decrease
in HACs from 2014 to 2017 is 13 percent. From 2010 through
preliminary 2017 data, the
average annual reduction in the overall rate of HACs was
approximately 4.5 percent.
For the trend beginning in 2014, methods were updated and a
larger portion of hospital inpatients
were included in the HAC calculations. The 2014 rate started at
99 HACs per 1,000 hospital
discharges and is estimated at 86 HACs per 1,000 discharges for
2017. In the method previously
used, the 2010 rate was calculated as 145 HACs per 1,000
discharges and the 2014 rate was 121
HACs per 1,000 discharges. Both methods use the same 28
measures of patient safety events,
including many types of hospital-acquired infections, adverse
drug events, and injuries due to
procedures, as well as pressure ulcers/pressure injuries and
falls.
The newly established baseline of 99 HACs per 1,000
discharges in 2014 equates to
approximately 2,940,000 HACs among all hospital inpatients 18
years old and over. The updated
rate for 2017 equates to approximately 2,550,000 HACs. The
final 2017 HAC rate will be
updated and recalculated in the future to take into account
changes seen in seven of the HAC
measures that use ICD-101 data—these data will not be
available until late 2019. However, these
measures are responsible for only 8 to 10 percent of the annual
HACs measured for 2014–2017,
so the final calculations are unlikely to make meaningful
changes to the data.
Based on the HAC reductions seen in 2015, 2016, and 2017
compared with 2014, AHRQ
estimates a total of 910,000 fewer HACs occurred than if the
2014 rates had persisted through
2017. These HAC reductions lead to estimates of approximately
$7.7 billion in costs saved and
approximately 20,500 HAC-related inpatient deaths averted
from 2015 through 2017. Data
reported in 2016 estimated that from 2011 through 2014, HAC
reductions totaled 2.1 million,
and these reductions resulted in approximately $19.9 billion in
cost savings and 87,000 fewer
HAC-related inpatient deaths.2
In the new and updated data for 2014–2017, not all types of
HACs showed similar trends. For
example, measured adverse drug events continued to drop from
2014 to 2017, while measured
pressure ulcers/pressure injuries increased from 2014 to 2015
and then decreased somewhat from
2015 to 2016 and 2017. A similar trend was seen for physician-
diagnosed catheter-associated
urinary tract infections.
1 ICD-10 = International Classification of Diseases, 10th
Revision. The ninth revision is referred to as ICD-9.
2 See the AHRQ HAC report at
https://www.ahrq.gov/professionals/quality-patient-
safety/pfp/2014-final.html.
https://www.ahrq.gov/professionals/quality-patient-
safety/pfp/2014-final.html
AHRQ National Scorecard on Hospital-Acquired Conditions 2
Of special interest may be the apparent reduction in the rate of
antibiotic-associated Clostridioides
difficile3 infections. Comparing these data with other sources of
information, such as the Centers
for Disease Control and Prevention (CDC) and the AHRQ
Healthcare Cost and Utilization Project
(HCUP), may help us determine if efforts to reduce the
occurrence of this important HAC are
effective at the national level.
The new baseline of 99 HACs per 1,000 discharges was
established and calculated for 2014 to
monitor the progress of the Department of Health and Human
Services (HHS) goal to reduce
HACs by 20 percent from 2014 to 2019. This goal is
specifically tied to the Centers for Medicare
& Medicaid Services’ Hospital Improvement Innovation
Networks, which work collaboratively
with Federal and private partners to achieve this bold aim and
build on prior successes.
AHRQ estimates that if the 20 percent HAC reduction goal were
achieved, the HAC rate in
2019 would be 79 per 1,000 discharges. That means
approximately 1.8 million fewer HACs
would occur compared with the number that would have
occurred if HAC rates for 2015
through 2019 had stayed the same as in 2014. If a 20 percent
reduction were to occur in each
type of HAC measured, AHRQ projects that these 1.8 million
fewer HACs would be
associated with $19.2 billion in cost savings and 53,000 fewer
deaths from 2015 through 2019.
The results reported above through preliminary 2017 data are
not inconsistent with achieving
the 20 percent HAC reduction goal for 2019.
Detailed Results
The new 2014 baseline for the national HAC rate (NHR) is 99
HACs per 1,000 discharges.
Exhibit 1 shows the details. Clostridioides difficile Infections is
italicized because it was added
as a “focus” HAC for reduction efforts and tracking for 2014
through 2019. Clostridioides
difficile infections were previously tracked in the “All Other
HACs” measure, a collection of
13 other types of HACs. Methods used to calculate the NHR are
provided in Appendix 1, and
all the measures used in the NHR are shown in Appendix 2,
Exhibit A2c.
Exhibit 1. New 2014 national HAC rate baseline (rounded),
updated January 2019
Hospital-Acquired Condition
2014 Measured Baseline
for HACs
2014 Total HACs per
1,000 Discharges
Adverse Drug Events 1,001,000 33.7
Catheter-Associated Urinary Tract
Infections
170,000 5.7
Central Line-Associated Bloodstream
Infections
8500 0.3
Clostridioides difficile Infections 86,000 2.9
Falls 239,000 8.0
Obstetric Adverse Events 67,000 2.3
Pressure Ulcers/Pressure Injuries 647,000 21.8
Surgical Site Infections 73,000 2.5
3 Clostridium difficile has been changed to Clostridioides
difficile. More information is available at
https://www.ncbi.nlm.nih.gov/pubmed/27370902 and
https://www.cdc.gov/hai/organisms/cdiff/cdiff_infect.html
https://www.ncbi.nlm.nih.gov/pubmed/27370902
https://www.cdc.gov/hai/organisms/cdiff/cdiff_infect.html
AHRQ National Scorecard on Hospital-Acquired Conditions 3
Hospital-Acquired Condition
2014 Measured Baseline
for HACs
2014 Total HACs per
1,000 Discharges
Ventilator-Associated Pneumonias 36,000 1.2
(Post-op) Venous Thromboembolisms 25,000 0.9
All Other HACs 584,000 19.6
Total 2,940,000 99
The new baseline established with the 2014 data was developed
using a new method that was
based on the method previously used to calculate the 2010-2014
NHR.4 The major difference
between the new method and the previous method is that the
new method includes patient charts
for most conditions treated in acute care hospitals.
Previously, the Medicare Patient Safety Monitoring System
(MPSMS) used patient charts from
only four groups of patients. Three were represented by the
principal diagnosis (acute myocardial
infarction [AMI], congestive heart failure [CHF], and
pneumonia [PN]). The other comprised
major surgery patients, as described by the Surgical Care
Improvement Project [SCIP]). These
groups were used to calculate the 2010–2014 NHR. With the
new method, charts for conditions
other than AMI, CHF, PN, and SCIP were sampled as a single
group, starting with 2014, thus
producing five sets of inpatient charts.
The 2015 rate is 92 HACs per 1,000 discharges, and 2016 and
preliminary 2017 rates are 88 and
86 HACs per 1,000 discharges, respectively (Exhibit 2). Also
shown is the goal for 2019, 79
HACs per 1,000 discharges, which is a 20 percent reduction
from the 2014 baseline NHR of 99.
Detailed information on the number of HACs from 2015 to 2017
(preliminary) is shown in
Appendix 2, Exhibit A2c.
Appendix A2e shows how the current NHR, which starts in 2014
and will be tracked at least
through 2019, compares with the NHR trended for 2010 to 2014.
The 2010 to 2014 reduction
was 17 percent over 4 years, and the 2014 to 2019 goal is a 20
percent reduction over 5 years.
Appendix 3 shows the details of the HAC reductions, cost
savings, and inpatient mortality
reductions that are projected based on meeting this goal, which
total 1.8 million HACs, $19.2
billion, and 53,000 lives. Appendix 4 describes changes in the
samples used for the 2014–2017
analyses, compared with the 2010–2014 analyses.
4 See the report at
https://www.ahrq.gov/sites/default/files/wysiwyg/professionals/
quality-patient-
safety/pfp/pfphac.pdf.
https://www.ahrq.gov/sites/default/files/wysiwyg/professionals/
quality-patient-safety/pfp/pfphac.pdf
https://www.ahrq.gov/sites/default/files/wysiwyg/professionals/
quality-patient-safety/pfp/pfphac.pdf
AHRQ National Scorecard on Hospital-Acquired Conditions 4
Exhibit 2. Re-baselined 2014 data, with 2015, 2016, and
preliminary 2017 national HAC rate data,
and 2019 HAC goal
Exhibit 3 provides the same information as Exhibit 2, but in
table form that provides more details
on the combined results to date, based on 2015 and 2016 data
and preliminary data for 2017,
compared with the 2014 baseline.
AHRQ National Scorecard on Hospital-Acquired Conditions 5
Exhibit 3. Re-baselined 2014 data, with 2015, 2016, and
preliminary 2017 national HAC rate data,
and percent change through preliminary 2017data
Hospital-Acquired
Condition
2014
Measured
Baseline
for HACs
2015
Normalized
Count of
HACs
2016
Normalized
Count of
HACs
Preliminary
2017
Normalized
Count of
HACs
Percent
Change in
HACs, 2014
vs.
Preliminary
2017
2019 Goal
(20%
Reduction
of each
HAC)
Adverse Drug
Events
33.7 30.0 27.1 24.2 -28% 26.9
Catheter-
Associated Urinary
Tract Infections
5.7 6.4 5.7 5.4 -5% 4.6
Central Line-
Associated
Bloodstream
Infections
0.29 0.07 0.22 0.27 -6% 0.23
Clostridioides
difficile Infections
2.9 2.6 2.5 1.8 -37% 2.3
Falls 8.0 7.6 7.5 7.6 -5% 6.4
Obstetric Adverse
Events
2.3 2.2 2.2 2.2 -5% 1.8
Pressure Ulcers/
Pressure Injuries
21.7 23.5 22.7 23.0 6% 17.4
Surgical Site
Infections
2.5 2.5 2.5 2.5 0% 2.0
Ventilator-
Associated
Pneumonias
1.2 0.9 0.9 1.0 -13% 1.0
(Post-op) Venous
Thromboembolisms
0.9 0.4 0.7 0.7 -17% 0.7
All Other HACs 19.6 16.1 15.8 17.2 -12% 15.7
Totals (rounded) 99 92 88 86 -13% 79
With the overall HAC reductions described above, and based on
new per-HAC cost and
mortality estimates updated in 2017 (see Appendix 5), we
project that over 2015–2017, there
were approximately $7.7 billion in cost savings and 20,500
fewer deaths associated with HACs.
These projections are tabulated in Exhibit 4. In 2017, AHRQ
released a special report on costs
and inpatient mortality due to HACs.5
Appendix 5 shows the summary cost and mortality associated
with each of the 10 focus HAC
types, and the full report from which this table is excerpted is
available on the AHRQ website.5
The cost and mortality for “all other HACs” was not estimated
in this report and was estimated
based on a weighted average of the 10 focus HACs, with the
weighting based on the proportion
of each of the 10 focus HACs in the 2014 baseline data.
5 This report is available at
https://www.ahrq.gov/sites/default/files/wysiwyg/professionals/
quality-patient-
safety/pfp/hac-cost-report2017.pdf.
https://www.ahrq.gov/sites/default/files/wysiwyg/professionals/
quality-patient-safety/pfp/hac-cost-report2017.pdf
https://www.ahrq.gov/sites/default/files/wysiwyg/professionals/
quality-patient-safety/pfp/hac-cost-report2017.pdf
AHRQ National Scorecard on Hospital-Acquired Conditions 6
Exhibit 4. Projected cost savings and deaths averted due to HAC
changes to date from 2015
through preliminary 2017 data, compared with 2014 baseline
Total Change in HACs,
2015, 2016, and
Preliminary 2017 Data
Compared With 2014
Estimate of Total
Change in HAC-
Related Costs
Estimate of
Total Change in
HAC-Related
Deaths
Adverse Drug Events -585,000 -$3,360,000,000 -7,000
Catheter-Associated Urinary
Tract Infections
12,000 $170,000,000 400
Central Line-Associated
Bloodstream Infections
-9,000 -$420,000,000 -1,300
Clostridioides difficile
Infections
-54,000 -$920,000,000 -2,400
Falls -43,000 -$290,000,000 -2,100
Obstetric Adverse Events -9,000 -$10,000,000 -100
Pressure Ulcers/Pressure
Injuries
119,000 $1,720,000,000 4,900
Surgical Site Infections 0 $0 0
Ventilator-Associated
Pneumonias
-23,000 -$1,100,000,000 -3,300
Venous Thromboembolisms -22,000 -$390,000,000 -1,000
All Other HACs (not including
Clostridioides difficile
Infections)
-293,000 -$3,130,000,000 -8,700
Totals From Annual Changes
in HACs, HAC-Related Costs,
and Deaths
-910,000 -$7,730,000,000 -20,500
Note: Totals are rounded and thus may not reflect the total
obtained by adding the individual cells.
Detailed Goals for 2019
Achieving the goal of a 20 percent reduction in HACs (going
from 99 to 79 HACs per 1,000
discharges; see Exhibit 3) would result in approximately 1.8
million fewer HACs in the years from
2015 to 2019. With constant annual reductions toward a 20
percent reduction across all measured
HACs, and based on the new per-HAC estimates for costs and
mortality from the 2017 study
funded by AHRQ (see Appendix 5), our projections indicate
approximately $19.2 billion in cost
savings for the 5 years and 53,000 HAC-related deaths averted.
These data are tabulated in
Appendix 3.
Data reported in late 2016 estimated that for the 4 years from
2011 through 2014, HAC
reductions totaled 2.1 million compared with 2010 baseline
data. These reductions resulted in
approximately $19.9 billion in cost savings and 87,000 fewer
HAC-related inpatient deaths.6
6 See report at https://www.ahrq.gov/professionals/quality-
patient-safety/pfp/2014-final.html.
https://www.ahrq.gov/professionals/quality-patient-
safety/pfp/2014-final.html
AHRQ National Scorecard on Hospital-Acquired Conditions 7
Looking Ahead
In spite of the volume and velocity of data flowing into and
through healthcare, providers, health
system leaders, and other stakeholders lack sufficient
information to guide their efforts as they
work to prevent HACs. Similarly, patients’ choices often occur
without the robust information
they need, and this limitation constrains their efforts to be
engaged in their own care.
In addition, numerous other unmet needs must be addressed to
continue preventing HACs and
sustain the improvements documented in this report. In
particular, we must continue to advance
patient safety measurement, expand the evidence base for
patient safety improvement strategies,
and create resources to help providers and the healthcare
workforce improve patient safety at the
point of care.
For example, it is critically important that we continue to drive
innovation that efficiently
harnesses the full potential of data and measurement. AHRQ’s
patient safety measurement
projects, including QSRS, are making progress by moving
information closer to points of care
where it can support providers and the safer care that all
stakeholders want to achieve.
A powerful foundation of knowledge about how to improve
patient safety has been established
over more than two decades of AHRQ-funded research and
implementation projects, and, if we
want to use this knowledge to address persistent patient safety
challenges, it is crucial to pair it
with capabilities that help clinicians and other healthcare
workers reliably measure patient safety
threats. When providers trust information they receive about
patient safety, they are in better
positions to understand these ongoing problems and to
effectively prioritize and target them with
safer practices. QSRS is being developed in part to serve this
purpose by providing information
that clinicians and other healthcare workers will trust and use to
improve safety.
AHRQ and other HHS agencies recognize that improving the
safety and quality of healthcare is
the ultimate purpose of measurement systems, and the ability to
support this improvement
effectively and efficiently is a desirable characteristic of these
systems. AHRQ and CMS are
using the MPSMS as the primary system to measure the NHR,
but AHRQ has been working with
CMS and other Federal partners, contractors, and other experts
to develop the Quality and Safety
Review System (QSRS), an improved system to succeed
MPSMS.
The QSRS has been developed and is undergoing use in the
Clinical Data Abstraction Center,
pilot testing at non-Federal settings,7 and refinement pursuant
to the goal of supporting safe,
high-quality care. QSRS has been designed as a robust
measurement platform that will serve the
shared needs of different healthcare stakeholders.
7 See https://www.ahrq.gov/professionals/quality-patient-
safety/qsrs/index.html and https://www.ahrq.gov/sites/
default/files/wysiwyg/research/findings/factsheets/translating/ac
tion3/actioniii-2016-summaries.pdf.
https://www.ahrq.gov/professionals/quality-patient-
safety/qsrs/index.html
https://www.ahrq.gov/sites/default/files/wysiwyg/research/findi
ngs/factsheets/translating/action3/actioniii-2016-summaries.pdf
https://www.ahrq.gov/sites/default/files/wysiwyg/research/findi
ngs/factsheets/translating/action3/actioniii-2016-summaries.pdf
https://www.psoppc.org/psoppc_web/publicpages/surveillanceco
mmonformats
https://www.ncbi.nlm.nih.gov/pubmed/28671914
http://www.pso.ahrq.gov/common/development
AHRQ National Scorecard on Hospital-Acquired Conditions 8
QSRS is designed to provide up-to-date national HAC rates,
including rates of some additional
types of HACs not currently measured with MPSMS, the AHRQ
Patient Safety Indicators
(PSIs), the Centers for Disease Control and Prevention National
Healthcare Safety Network
(NHSN), or other sources of information concerning patient
safety in hospitals. It has been
developed so that non-Federal entities, including hospitals and
healthcare systems, will be able
use it to measure patient safety.
QSRS will allow assessment of safety for new patient
populations not currently captured by
MPSMS, which was originally designed to focus on adverse
events experienced by Medicare
patients. In addition, QSRS will allow organizations to consider
aligning their local patient safety
measurements with the same methods and measures used at the
national level. Standard methods
for measurement, such as those in QSRS, have been a valuable
component of other healthcare
improvement initiatives, including some that have addressed
more specific safety challenges.
The AHRQ Common Formats for Surveillance8 serve as the
underlying content that provides the
foundation of QSRS measures and cover a broad range of
common and uncommon threats to
patient safety. Development and revision of the Common
Formats for Surveillance and QSRS
are ongoing processes that include structured review and public
feedback facilitated by the
National Quality Forum. After release of QSRS, AHRQ will
rely on feedback, especially from
users, to inform the development of new versions of the
Common Formats for Surveillance and
for QSRS. This process will enable the Common Formats and
QSRS to keep pace with users’
needs and the emerging scientific evidence base for patient
safety and quality improvement.
Some data needed for patient safety measurement may be
increasingly available from electronic
health records. AHRQ continues to explore the feasibility of
automated approaches to data
abstraction9 in order to further improve efficiency and reduce
burden while maintaining the
validity of QSRS and enhancing its ease of use. These include
the AHRQ Common Formats for
Surveillance, a subset of the AHRQ Common Formats.10
8 More information is available at
https://www.psoppc.org/psoppc_web/publicpages/surveillanceco
mmonformats.
9 See publication in the Journal of Patient Safety online at:
https://www.ncbi.nlm.nih.gov/pubmed/28671914. A new
study and report is currently in preparation and is expected to
be complete later this year.
10 More information is available at
www.pso.ahrq.gov/common/development.
AHRQ National Scorecard on Hospital-Acquired Conditions 9
Appendix 1. Method To Estimate the Baseline 2014 National
Hospital-
Acquired Condition Rate
This document describes the methods AHRQ has developed to
estimate the national rate of
HACs for 2014 to 2019, which has a goal of a 20 percent
reduction in HACs. The estimate
includes a wide variety of adverse events, including the 10
HACs selected for special focus by
CMS as part of the programs to achieve the 20 percent
reduction, as well as several other HACs.
Collectively, 28 specific measures are used (Exhibit A1a): 15
measures to generate rates for the
10 specific focus HACs and 13 measures to generate a summary
rate for “all other” HACs. Of
the 28 measures, 21 are from the MPSMS, 6 are from the PSIs,
and 1 is based on NHSN data.
Exhibit A1a. Measures used to estimate the national HAC rate
HAC Type Source Measure
Adverse Drug
Event
MPSMS ADE Associated With Digoxin
MPSMS ADE Associated With Hypoglycemic Agents
MPSMS ADE Associated With IV Heparin
MPSMS ADE Associated With LMWH and Factor Xa Inhibitor
MPSMS ADE Associated With Warfarin
CAUTI MPSMS Catheter-Associated Urinary Tract Infections
CDI MPSMS Clostridioides difficile Infections
CLABSI MPSMS Blood Stream Infections Associated With
Central Venous Catheters
Falls MPSMS In-Hospital Patient Falls
Obstetric
Adverse
Events
PSI OB Trauma in Vaginal Delivery
(PSI 19)
With (PSI 18) and Without Instrument
Pressure Ulcer MPSMS Hospital-Acquired Pressure
Ulcers/Pressure Injuries
Surgical Site
Infection
NHSN SSIs for 17 procedures w/CDC SCIP+5 data
VAP MPSMS Ventilator-Associated Pneumonia
VTE MPSMS Postoperative Venous Thromboembolic Events
All Other
Hospital-
Acquired
Conditions
MPSMS Femoral Artery Puncture for Catheter Angiographic
Procedures
MPSMS Adverse Event Associated With Hip Joint
Replacements
MPSMS Adverse Event Associated With Knee Joint
Replacements
MPSMS Contrast Nephropathy Associated With Catheter
Angiography
MPSMS Hospital-Acquired MRSA
MPSMS Hospital-Acquired Vancomycin-Resistant Enterococcus
(VRE)
MPSMS Mechanical Complications Associated With Central
Venous Catheters
MPSMS Postoperative Cardiac Events for Cardiac and
Noncardiac Surgeries
MPSMS Postoperative Pneumonia
PSI Iatrogenic Pneumothorax (PSI 6)
PSI Post-Op Hemorrhage or Hematoma (PSI 9)
PSI Post-Op Respiratory Failure (PSI 11)
PSI Accidental Puncture or Laceration (PSI 15)
AHRQ National Scorecard on Hospital-Acquired Conditions 10
Data from these 28 measures are combined to generate a
summary national HAC rate (NHR) that
has been calculated annually since 2010.4 The current method is
built on the 2010–2014 methods
but includes some changes. The current method removes the use
of reference data from 2005–
2006 and includes a fifth set or sample of charts to augment the
four samples used in the 2010–
2014 method.
In the 2010–2014 method, Clostridioides difficile Infection data
were included in “All Other
HACs” rather than as a focus HAC, which is the case with the
new method. As before, the new
method uses HCUP data on the annual number of hospital
inpatient discharges as the
denominator for the rate calculations. The details of how the
current NHR is calculated are
summarized below.
1. The NHR is calculated using the following variables:
a. Rate of 21 MPSMS adverse events in the MPSMS sample
provided by CMS,
including those in the SCIP (major surgery) sample, those with
a principal diagnosis
of AMI, CHF, or pneumonia, and a “global” sample intended to
complement these
four groups of patients. The sample is limited to patients 18
years old and over.
For the NHR calculation, the rates of the 21 MPSMS adverse
events are expressed as
a rate for the whole sample population, rather than as a rate for
the subpopulation that
has the opportunity to experience the adverse event. For
example, the CLABSI rate,
like all rates in the sample, uses all patients in the denominator,
not just the patients
who had a central line inserted during their hospital stay.
For each of the 21 MPSMS HACs, the estimate is a weighted
average of the HAC
rate for each group, where each group is given a weight that
approximates the fraction
of patients the group represents in the hospital discharge
population age 18 and over.
This approach ensures that the estimated rate will not be
affected by variation across
years in the percentage of patients in the samples of charts
representing each of the
five groups (SCIP, AMI, CHF, pneumonia, and global). It also
uses the data from
each sample in a way that best represents the conditions treated
in the actual hospital
inpatient population.
The weights follow, based on their percentage11 of the inpatient
population:
• AMI: 2.15%,
• CHF: 3.24%,
• Pneumonia: 4.41%,
• SCIP plus 5 other major surgeries: 19.17%,
• Global: 71.03%.
11 These weights (percentages) are slightly different than in the
report released in June 2018 (see
https://www.ahrq.gov/sites/default/files/wysiwyg/professionals/
quality-patient-safety/pfp/natlhacratereport-
rebaselining2014-2016_0.pdf). The change in weights to
incorporate newer information is the reason that the HAC
rate calculated in the June 2018 report for 2014 was 98 HACs
per 1,000 discharges, while the rate for 2014 in this
report is 99.
https://www.ahrq.gov/sites/default/files/wysiwyg/professionals/
quality-patient-safety/pfp/natlhacratereport-rebaselining2014-
2016_0.pdf
https://www.ahrq.gov/sites/default/files/wysiwyg/professionals/
quality-patient-safety/pfp/natlhacratereport-rebaselining2014-
2016_0.pdf
AHRQ National Scorecard on Hospital-Acquired Conditions 11
These AMI, CHF, and pneumonia patient data percentages were
based on data from
2014 from the AHRQ National Inpatient Sample. The
percentage of SCIP+5 patients
was calculated based on the number of surgeries in the SCIP+5
sample from CDC,
which was 5,704,493 among 29,751,955 discharges in 2014. The
weighting for the
global sample was 100 percent minus the contribution from the
other four samples.
b. National number of adverse events captured by PSIs 18 and
19 on obstetric
injury and national number of four other PSIs (6, 9, 11, and 15)
included among “all
other” HACs.12
c. National number of selected surgical site infections computed
in a special
calculation for CDC. This calculation is based on NHSN data
for 17 specific
operations: the 12 SCIP operations and 5 other major surgical
procedures not
included in the SCIP.13
d. To estimate the rate of adverse events for each of the 21
HACs for all patients for
which the MPSMS data are used, we follow these steps:
• Multiply the adverse event rate for each of the 21 HACs for
patients with one of
the five conditions included in the 2014–2017 MPSMS samples
by the number of
hospital inpatients represented by the sample, as calculated by
the weight of each
sample and the overall total annual national discharges listed
above.
• Sum the estimates for each of the five samples for each
measure to produce an
estimate for each of the 21 measures.
2. The estimated total count of annual HACs in the national
HAC rate is calculated as the
sum of the total number of HACs for the 21 MPSMS HACs in
(d) above, plus the
estimated number of PSI HACs in (b), plus the number of
NHSN-estimated HACs in (c).
3. The national HAC rate is the total HAC count in (2) above
divided by the number of
annual hospital inpatient discharges of patients at least 18 years
old, as provided by HCUP.
4. As of January 2019, this method established for 2014 has
been repeated for 2015, 2016,
and 2017; we used 2016 data preliminarily for the number of
annual hospital discharges
in 2017. We aim to compare the estimated total number of
HACs for 2015–2019 with the
2014 baseline without having the comparison affected by
changes in the total number of
discharges. Thus, for each year to date (2015, 2016, and
preliminary 2017) we normalized
the data to generate national estimates of HACs based on
29,751,955 discharges, which
was the total number of discharges in 2014 for inpatients 18
years old and over. This
method will be used again to finalize estimates for 2017 and to
establish new estimates for
2018, and 2019 as the data become available.
12 Due to the transition from ICD-9 to ICD-10 that occurred
with the start of the fourth quarter of 2015 and the effect
of this change on the PSI data, only data from the first three
quarters of 2015 were used to calculate the number of
PSI events for 2015. The number of PSI events for January
through September 2015 was multiplied by 4/3 to
estimate the number of events (HACs) for the full year of 2015.
13 Due to the ICD-9 to ICD-10 transition that occurred with the
start of the fourth quarter of 2015, only data from the
first three quarters of 2015 were used to calculate the number of
CDC NHSN SSI events for 2015. The CDC
estimate provided for 2015 was based on 12 months of data,
from October 2014 through September 2015.
AHRQ National Scorecard on Hospital-Acquired Conditions 12
5. Due to changes in how some conditions and adverse events
are described in ICD-9 and
ICD-10, the data for the 7 of 28 measures that depend entirely
or partly on administrative
data cannot be compared for 2015 and 2016. These measures
include the 6 PSI-based
measures and the SSI data that constitute about 8 to 10 percent
of the overall NHR for
2014 through 2017. To address this situation, we have reused
the data from 2015 in the
2016 and 2017 results for these measures. In late 2019, we
anticipate receiving new data
for 2017 based on ICD-10 data that will enable us to compare
the data with the 2016 data
we currently have for these measures and to develop a method
to continue the trending
from 2014 to 2019 for these measures within the overall NHR.
The data for 2016 we
have received from the AHRQ HCUP team and the CDC NHSN
statistician are tabulated
below in Exhibit A1b. For the reasons described above, these
data are not used in the
2016 NHR computed in this report but are included for
completeness.
Exhibit A1b. Data from AHRQ HCUP and CDC NHSN on total
numbers of HACs associated with
each ICD-10-dependent measure for 2016
Number of Patients
Number of Cases of Included in Sample
Measure Name for 2016 Adverse Events for This Measure
PSI 6, Iatrogenic Pneumothorax 7,372 18,948,556
PSI 9, Perioperative Hemorrhage or Hematoma 12,285
5,368,607
PSI 11, Postoperative Respiratory Failure 35,971 2,384,676
PSI 15, Unrecognized Abdominopelvic Accidental 32,396
19,811,918
Puncture/Laceration
PSI 18, Obstetric Trauma - Vaginal Delivery with 14,663
121,323
Instrument
PSI 19, Obstetric Trauma - Vaginal Delivery without 34,066
1,874,410
Instrument
Surgical Site Infections (special calculation performed 80,157
5,999,045 (estimate)
by CDC NHSN to include SSIs in a consistent set of
major surgeries since 2010)
These data were not used in this report because they cannot be
directly compared with prior years of data.
AHRQ National Scorecard on Hospital-Acquired Conditions 13
Appendix 2. 2014–2017 NHR Data Tabulated (HACs and HAC
Rate)
and Compared With Summary 2010–2014 Data
Information on the HACs for 2014, 2015, 2016, and 2017 is
provided below. Exhibit A2a shows
the calculated number of HACs (rounded), and Exhibit A2b
shows the calculated HAC rates per
1,000 discharges. Exhibit A2c shows all the measures, including
those used in the calculation of
“All Other HACs.”
These data have been normalized to account for the changes in
annual discharges, i.e., the
number of HACs shown in 2015–2017 is based on the number of
HACs that would have
occurred if the number of hospital discharges in 2015
(30,167,977) and 2016 (30,188,612) were
unchanged from that in 2014 (29,751,955). The 2017 data
shown are also normalized to 2014,
but with 2016 data being used because 2017 hospital discharge
data are not yet available.
Hospital discharge data are from HCUP, and the exact numbers
are based on a special analysis
performed for this study to limit hospital discharges to those 18
years old and over. Data for the
six PSIs and the SSI data from CDC are also wholly or partially
based on HCUP data that
depend on ICD-9 (through quarter 3 of 2015) or ICD-10
(beginning with quarter 4 of 2015).
Because data based on ICD-9 and ICD-10 cannot be directly
compared with each other, we
cannot compare the measures for Obstetric Adverse Events and
SSIs, as well as four of the PSI
measures that contribute to “All Other HACs.”
The data for 2017 are not currently available, and 2015 data are
used in the preliminary estimates
for 2017 as well. When 2017 data are available, we expect to
compare 2016–2017 data that are
dependent on ICD-10 and to continue that new trend through
2019. At present, we do not expect
to be able to develop a method that will enable us to compare
the data from ICD-based measures
for 2015 with 2016.
AHRQ National Scorecard on Hospital-Acquired Conditions 14
Exhibit A2a. HAC count estimates (rounded)
Hospital-Acquired
Condition
2014 Measured
Baseline for
HACs
2015
Normalized
Count of HACs
2016
Normalized
Count of HACs
Preliminary
2017
Normalized
Count of HACs
Change in
HACs, 2014 vs.
Preliminary
2017
Percent
Change in
HACs, 2014 vs
Preliminary
2017 14
Adverse Drug Events 1,001,000 894,000 805,000 721,000 -
280,000 -28%
Catheter-Associated
Urinary Tract Infections
170,000 191,000 170,000 161,000 -9,000 -5%
Central Line-Associated
Bloodstream Infections
8,500 2,200 6,500 8,000 -500 -6%
Clostridioides difficile
Infections
86,000 77,000 73,000 54,000 -32,000 -37%
Falls 239,000 225,000 223,000 227,000 -13,000 -5%
Obstetric Adverse Events 67,000 64,000 64,000 64,000 -3,000 -
5%
Pressure Ulcers/Pressure
Injuries
647,000 700,000 677,000 683,000 36,000 6%
Surgical Site Infections 73,000 73,000 73,000 73,000 0 0%
Ventilator-Associated
Pneumonias
36,000 28,000 26,000 31,000 -5,000 -13%
(Post-op) Venous
Thromboembolisms
25,000 12,000 20,000 21,000 -4,000 -17%
All Other HACs 584,000 479,000 468,000 512,000 -72,000 -
12%
Totals 2,940,000 2,740,000 2,610,000 2,550,000 -380,000 -13%
14 Due to use of the unrounded numbers in the calculations of
the percent changes, some percent changes shown are different
from the change that would result
from using the rounded numbers.
AHRQ National Scorecard on Hospital-Acquired Conditions 15
Exhibit A2b. HAC rates for 2014, 2015, 2016 and 2017
(preliminary), with 2019 goals
Hospital-Acquired Condition
2014 Baseline,
Updated 2015, Updated 2016, Updated Preliminary 2017
2019 Goal (20%
Reduction)
Adverse Drug Events 33.7 30.0 27.1 24.2 26.9
Catheter-Associated Urinary Tract
Infections
5.7 6.4 5.7 5.4 4.6
Central Line-Associated Bloodstream
Infections
0.29 0.07 0.22 0.27 0.23
Clostridioides difficile Infections 2.9 2.6 2.5 1.8 2.3
Falls 8.0 7.6 7.5 7.6 6.4
Obstetric Adverse Events 2.3 2.2 2.2 2.2 1.8
Pressure Ulcers/Pressure Injuries 21.7 23.5 22.7 23.0 17.4
Surgical Site Infections 2.5 2.5 2.5 2.5 2.0
Ventilator-Associated Pneumonias 1.2 0.9 0.9 1.0 1.0
Venous Thromboembolisms 0.9 0.4 0.7 0.7 0.7
All Other HACs 19.6 16.1 15.7 17.2 15.7
Totals 98.7 92.3 87.6 85.9 79.0
Note: Data in cells may not add to the total due to rounding.
AHRQ National Scorecard on Hospital-Acquired Conditions 16
Exhibit A2c. All 2014, 2015, 2016, and 2017 (preliminary)
HACs (not rounded)
Total 2014
Total 2015
HACs
Total 2015
HAC Rate
Total 2016
HACs
Total 2016
HAC Rate
Preliminary
Total 2017
Preliminary
Total 2017
HAC Rate Normalized Normalized Normalized Normalized
HACs HAC Rate
HAC Type Source Measure
Total 2014
HACs
per 1,000
Discharges
to 2014
Baseline
to 2014
Baseline
to 2014
Baseline
to 2014
Baseline
Normalized to
2014 Baseline
Normalized to
2014 Baseline
Adverse
Drug Event
MPSMS ADE Associated
With Digoxin
6,204 0.21 795 0.03 169 0.01 2,671 0.09
MPSMS ADE Associated
With
517,177 17.38 549,638 18.47 471,536 15.85 446,134 15.00
Hypoglycemic
Agents
MPSMS ADE Associated
With IV Heparin
141,711 4.76 81,362 2.73 83,677 2.81 71,713 2.41
MPSMS ADE Associated
With LMWH and
247,441 8.32 159,633 5.37 170,041 5.72 146,266 4.92
Factor Xa
Inhibitor
MPSMS ADE Associated
With Warfarin
88,814 2.99 102,338 3.44 79,773 2.68 53,819 1.81
MPSMS Total ADE (sum
of 5 above)
1,001,348 33.66 893,766 30.04 805,196 27.06 720,604 24.22
CAUTI MPSMS Catheter-
Associated
169,961 5.71 190,797 6.41 170,282 5.72 160,833 5.41
Urinary Tract
Infections
CDI MPSMS Clostridium
difficile
85,753 2.88 76,650 2.58 73,114 2.46 53,943 1.81
Infections
CLABSI MPSMS Blood Stream
Infections
8,493 0.29 2,182 0.07 6,519 0.22 7,991 0.27
Associated With
Central Venous
Catheters
Falls MPSMS In-Hospital
Patient Falls
239,286 8.04 225,199 7.57 223,106 7.50 226,642 7.62
Obstetric
Adverse
Events
PSI OB Trauma in
Vaginal Delivery
With (PSI 18)
and Without
67,482 2.27 64,077 2.15 64,033 2.15 64,033 2.15
Instrument (PSI
19)
Total 2014
Total 2015
HACs
Total 2015
HAC Rate
Total 2016
HACs
Total 2016
HAC Rate
Preliminary
Total 2017
Preliminary
Total 2017
HAC Rate Normalized Normalized Normalized Normalized
HACs HAC Rate
HAC Type Source Measure
Total 2014
HACs
per 1,000
Discharges
to 2014
Baseline
to 2014
Baseline
to 2014
Baseline
to 2014
Baseline
Normalized to
2014 Baseline
Normalized to
2014 Baseline
Pressure
Ulcer
MPSMS Hospital-
Acquired
Pressure
647,096 21.75 699,790 23.52 676,834 22.75 682,984 22.96
Ulcers/Pressure
Injuries
Surgical
Site
Infection
NHSN SSIs for 17
procedures
w/CDC SCIP+5
data
73,158 2.46 73,212 2.46 73,162 2.46 73,162 2.46
VAP MPSMS Ventilator-
Associated
35,894 1.21 27,548 0.93 25,695 0.86 31,213 1.05
Pneumonia
VTE MPSMS Postoperative
Venous
25,400 0.85 12,307 0.41 20,127 0.68 21,094 0.71
Thromboembolic
Events
All Other
Hospital-
Acquired
Conditions
MPSMS Femoral Artery
Puncture for
Catheter
Angiographic
Procedures
22,075 0.74 15,907 0.53 9,118 0.31 15,176 0.51
MPSMS Adverse Event
Associated With
48,925 1.64 49,141 1.65 61,670 2.07 49,988 1.68
Hip Joint
Replacements
MPSMS Adverse Event
Associated With
41,639 1.40 40,500 1.36 42,398 1.43 48,518 1.63
Knee Joint
Replacements
MPSMS Contrast
Nephropathy
Associated With
128,012 4.30 85,072 2.86 78,686 2.64 97,561 3.28
Catheter
Angiography
MPSMS Hospital-
Acquired MRSA
19,526 0.66 6,840 0.23 3,095 0.10 15,272 0.51
AHRQ National Scorecard on Hospital-Acquired Conditions 17
Total 2014
Total 2015
HACs
Total 2015
HAC Rate
Total 2016
HACs
Total 2016
HAC Rate
Preliminary
Total 2017
Preliminary
Total 2017
HAC Rate Normalized Normalized Normalized Normalized
HACs HAC Rate
HAC Type Source Measure
Total 2014
HACs
per 1,000
Discharges
to 2014
Baseline
to 2014
Baseline
to 2014
Baseline
to 2014
Baseline
Normalized to
2014 Baseline
Normalized to
2014 Baseline
MPSMS Hospital-
Acquired
Vancomycin-
Resistant
15,501 0.52 4,590 0.15 3,934 0.13 2,125 0.07
Enterococcus
(VRE)
MPSMS Mechanical
Complications
Associated With
59,610 2.00 53,033 1.78 67,004 2.25 59,924 2.01
Central Venous
Catheters
MPSMS Postoperative
Cardiac Events
32,773 1.10 28,768 0.97 22,103 0.74 45,886 1.54
for Cardiac and
Noncardiac
Surgeries
MPSMS Postoperative
Pneumonia
88,156 2.96 79,687 2.68 64,621 2.17 62,233 2.09
PSI Iatrogenic
Pneumothorax
10,674 0.36 9,694 0.33 9,688 0.33 9,688 0.33
(PSI 6)
PSI Post-Op
Hemorrhage or
Hematoma (PSI
9)
17,670 0.59 16,154 0.54 16,143 0.54 16,143 0.54
PSI Post-Op
Respiratory
Failure (PSI 11)
48,087 1.62 47,300 1.59 47,268 1.59 47,268 1.59
PSI Accidental
Puncture or
51,249 1.72 42,599 1.43 42,570 1.43 42,570 1.43
Laceration (PSI
15)
MPSMS
& PSI
Total All Other
HACs (sum of
13 above)
583,897 19.63 479,286 16.11 468,299 15.74 512,352 17.22
AHRQ National Scorecard on Hospital-Acquired Conditions 18
Total 2014
Total 2015
HACs
Total 2015
HAC Rate
Total 2016
HACs
Total 2016
HAC Rate
Preliminary
Total 2017
Preliminary
Total 2017
HAC Rate Normalized Normalized Normalized Normalized
HACs HAC Rate
HAC Type Source Measure
Total 2014
HACs
per 1,000
Discharges
to 2014
Baseline
to 2014
Baseline
to 2014
Baseline
to 2014
Baseline
Normalized to
2014 Baseline
Normalized to
2014 Baseline
Total MPSMS- 2,669,447 89.7 2,491,779 83.8 2,353,504 79.1
2,301,987 77.4
Based
Measured HACs
Total PSI-Based 195,162 6.6 179,824 6.0 179,701 6.0 179,701
6.0
Measured HACs
Total NHSN- 73,158 2.5 73,212 2.5 73,162 2.5 73,162 2.5
Based
Measured HACs
Total HACs 2,937,767 98.7 2,744,815 92.3 2,606,367 87.6
2,554,850 85.9
AHRQ National Scorecard on Hospital-Acquired Conditions 19
AHRQ National Scorecard on Hospital-Acquired Conditions 20
The estimates that were previously used in 2016 to trend 2010
to 2014 results, and the estimates
for 2014 that are being used to establish a new trend for 2014–
2019 results are shown below in
Exhibit A2d. More details on the 2010-2014 results is available
in the final data report for that
period.15
Exhibit A2d. Historical and new estimates for 2014 (rounded)
New Data for Trending 2014–2019 Results
Historical Data for
Trending 2010–2014
Results
Hospital-Acquired Condition
2014 Updated
Baseline for HACs
2014 Total HACs
per 1,000
Discharges
HAC Rate for 2014
(Calculated for
Comparison With 2010)
Adverse Drug Events 1,001,000 33.7 41.4
Catheter-Associated Urinary
Tract Infections
170,000 5.7 7.6
Central Line-Associated
Bloodstream Infections
8,000 0.3 0.2
Clostridioides difficile Infections 86,000 2.9 (Included in All
Other HACs)
Falls 239,000 8.0 7.9
Obstetric Adverse Events 67,000 2.3 2.3
Pressure Ulcers/Pressure
Injuries
647,000 21.7 30.9
Surgical Site Infections 73,000 2.5 2.5
Ventilator-Associated
Pneumonias
36,000 1.2 1.2
(Post-Op) Venous
Thromboembolisms
25,000 0.9 0.5
All Other HACs 584,000 19.6 26.4
Total 2,940,000 99 121
Data in Exhibits A2e and A2f provide summary information on
the trends from 2010 to 2014
based on historical data and methods as reported in 2016.11
They also provide new summary
information on the data from 2014 to 2017’s preliminary results
that were computed using the
new methods established for tracking results from 2014 to 2019.
15 See the AHRQ HAC report at
https://www.ahrq.gov/professionals/quality-patient-
safety/pfp/2014-final.html.
https://www.ahrq.gov/professionals/quality-patient-
safety/pfp/2014-final.html
AHRQ National Scorecard on Hospital-Acquired Conditions 21
Exhibit A2e. Summary data trended from 2010–2014 (historical)
and 2014–2017 (new)
2010–2014
Historical
Rate
Annual
Change
From
Previous
Year
Annual
Reduction
From
Baseline
Year (2010)
New Rate
for 2014–
2019
Trending
Annual
Change
From
Previous
Year
Annual
Reduction
From
Baseline
Year (2014)
2010 145
2011 142 -2.1% -2.1%
2012 132 -7.0% -9.0%
2013 121 -8.3% -16.6%
2014 121 0.0% -16.6% 99
2015 92 -7.1% -7.1%
2016 88 -4.3% -11.1%
2017* 86 -2.3% -13.1%
Average -4.4% -4.6%
Annual
Percent
Change
*Preliminary data.
Exhibit A2f. Summary data trended from 2010–2014 (historical)
and 2014–preliminary 2017 data
145 142
132
121 121
99 92 88 86
0
20
40
60
80
100
120
140
160
2010 2011 2012 2013 2014 2015 2016 2017*
National HAC Rates: HACs per 1,000 Discharges
2010-2014 Historical rate New Rate for 2014-2019 Trending
* Preliminary data.
AHRQ National Scorecard on Hospital-Acquired Conditions 22
Appendix 3. National Goals for 2019 Based on 2014 NHR
Baseline
(Projected Reductions in HACs, Costs, and Deaths)
Exhibit A3 shows annual summary data for achieving the goals
associated with a 20 percent
HAC reduction from 2014 to 2019. In these projections, which
are based on annual reductions of
4.3 percent from 2014 to 2019 and an overall 20 percent
reduction from 2014 to 2019, the total
cumulative cost reductions total approximately $19.2 billion,
and the total HAC-related deaths
averted total approximately 53,000.
Exhibit A3. HAC reduction goals for 2015 to 2019 based on
new 2014 baseline and projected cost savings
and deaths averted associated with meeting the HAC reduction
goals
Annual 2015 Goal 2016 Goal 2017 Goal 2018 Goal
2019 Goal (20%
Reduction in
HACs)
Annual HAC
Reductions From
2014 Baseline
-126,000 -247,000 -363,000 -474,000 -580,000
Annual Cost
Reductions
Associated With
Achieving Goal
-$1,350,000,000 -$2,650,000,000 -$3,890,000,000 -
$5,070,000,000 -$6,210,000,000
Annual Deaths
Averted Associated
With Achieving Goal
-4,000 -7,000 -11,000 -14,000 -17,000
Cumulative
Cumulative HAC
Reductions From
2014 Baseline
-126,000 -373,000 -736,000 -1,210,000 -1,790,000
Cumulative Cost
Reductions
Associated With
Achieving Goal
-1,350,000,000 -4,000,000,000 -7,890,000,000 -12,960,000,000
-19,170,000,000
Cumulative Deaths
Averted Associated
With Achieving Goal
-4,000 -11,000 -22,000 -36,000 -53,000
AHRQ National Scorecard on Hospital-Acquired Conditions 23
Appendix 4. Changes in the Samples Used for the MPSMS
2014–2017
Compared With 2010–2014 Previous Analyses
The Medicare Patient Safety Monitoring System (MPSMS)
methodology to identify adverse
events within each chart from 2014 to 2017 is the same as in
prior years. However, the
methodology by which charts are identified, sampled, and
included for review with the MPSMS
has changed significantly during the period. The most
significant changes are the result of changes
to the requirements for the Hospital Inpatient Quality Reporting
(IQR) Program and changes from
International Classification of Diseases, 9th Revision (ICD-9)
to 10th Revision (ICD-10) coding.
The Hospital IQR Program is mandated by law.
Changes to the Hospital IQR Program and Its Impact on the
MPSMS Four-
Condition Sample
When the original method for calculating a national HAC rate
(NHR) was developed,4 CMS and
AHRQ monitored patient safety for the NHR using charts from
patients treated for four conditions:
• Acute myocardial infarction (AMI),
• Congestive heart failure (CHF),
• Pneumonia (PN), and
• Major surgeries associated with the Surgical Care
Improvement Project (SCIP).16
CMS reduced burden and costs by reusing charts for these
conditions already obtained to support
validation of the Hospital IQR Program as described in the
Federal Register.17
Briefly, all acute care hospitals subject to the inpatient
prospective payment system (IPPS)
receive payment incentives for meeting Hospital IQR Program
reporting requirements.
Therefore, from 2010 through 2014, nearly all IPPS hospitals
submitted data to CMS on random
samples of all inpatient stays that met the definitions for the
four noted conditions.
To validate the reported data on AMI, CHF, PN, and SCIP, CMS
contractors randomly sampled
between 400 and 800 hospitals (depending on the year) and
requested 12 medical records (3
from each category) from each sampled hospital. CMS’s
Hospital IQR Program requirements for
AMI, CHF, PN, and SCIP remained similar for several
consecutive years such that we obtained a
stable consistent sample of medical charts from these four
conditions from 2010 through 2014.
From 2015 onward, the MPSMS four-condition sample (AMI,
CHF, PN, and SCIP) has been an
approximation of the previous four-condition samples used from
2010 through 2014. It had to be
reconstructed by sampling hospitals reimbursed under IPPS and
requesting charts from available
all-payer data submitted to the Hospital IQR Program.
16 See
https://www.qualitynet.org/dcs/ContentServer?c=Page&pagena
me=QnetPublic%2FPage%2FQnetTier4&
cid=1228773989482.
17 See “7. Chart Validation Requirements for Chart-Abstracted
Measures” at 75 FR 50225-50229, August 16, 2010, at
https://www.gpo.gov/fdsys/pkg/FR-2010-08-16/pdf/2010-
19092.pdf.
https://www.qualitynet.org/dcs/ContentServer?c=Page&pagena
me=QnetPublic%2FPage%2FQnetTier4&cid=1228773989482
https://www.qualitynet.org/dcs/ContentServer?c=Page&pagena
me=QnetPublic%2FPage%2FQnetTier4&cid=1228773989482
https://www.gpo.gov/fdsys/pkg/FR-2010-08-16/pdf/2010-
19092.pdf
AHRQ National Scorecard on Hospital-Acquired Conditions 24
As the hospital care environment changed, the Hospital IQR
Program discontinued chart-based
reporting requirements for these four conditions in 2015 (CHF,
PN, and SCIP) and 2016
(AMI).18 Thus, from 2015 onward, after randomly sampling
hospitals to provide data for
MPSMS, CMS contractors identified medical records submitted
to the Hospital IQR Program
under global population specifications19 that also met the
formally defined criteria for AMI,
CHF, PN, or SCIP.
The samples for 2015–2017 only approximate the data from
2014, so it is possible that the four-
condition sample for 2015–2017 had a different risk profile than
the sample data from 2014. This
potential issue may be addressed by risk adjusting the data,
which has been done in previous
studies using MPSMS data. In general, the risk-adjusted results
have shown trends similar to the
results before risk adjustment.20
Changes From ICD-9 to ICD-10 Coding and Their Impact on the
MPSMS Four-
Condition Sample
In quarter 4, 2015, hospitals began using ICD-10 coded data in
place of ICD-9 coded data. It is
notable that because MPSMS is based on chart-abstraction,
results do not depend on this coding
system. However, the specifications that CMS’s contractors
used to identify charts for the four
conditions (AMI, CHF, PN, and SCIP) did depend on these
specifications. Therefore, this coding
change introduced an inherent uncertainty regarding the nature
of the comparability of the four-
condition sample before and after quarter 4, 2015.
Introduction of the Four-Condition Complement (“Global”)
Sample
To improve the number of conditions represented by MPSMS,
we introduced the four-condition
complement (“global”) sample designed to include most types
of patients not included in the
four-condition sample. All charts abstracted as part of
MPSMS’s four-condition complement
were originally submitted to the Clinical Data Abstraction
Center for validation of Hospital IQR
Program measures.
18 See “CY 2015 reporting period” and “CY 2016 reporting
period” at
https://www.qualitynet.org/dcs/ContentServer?c=Page&pagena
me=QnetPublic%2FPage%2FQnetTier4&cid=12287
75411587.
19 See Section 2.9, “Global Initial Patient Population,” at
https://www.qualitynet.org/dcs/ContentServer?c=Page&pagena
me=QnetPublic%2FPage%2FQnetTier4&cid=12287
73989482.
20 See, for example, risk-adjusted data on ventilator-associated
pneumonia rates in
https://jamanetwork.com/journals/jama/fullarticle/2583369 or
risk-adjusted physician-diagnosed catheter-associated
urinary tract infection rates in
https://www.ncbi.nlm.nih.gov/pubmed/28625702 and data
without risk adjustment in
https://www.ahrq.gov/sites/default/files/wysiwyg/professionals/
quality-patient-safety/pfp/2014finalhacreport-cx.pdf
and earlier reports.
https://www.qualitynet.org/dcs/ContentServer?c=Page&pagena
me=QnetPublic%2FPage%2FQnetTier4&cid=1228775411587
https://www.qualitynet.org/dcs/ContentServer?c=Page&pagena
me=QnetPublic%2FPage%2FQnetTier4&cid=1228775411587
https://www.qualitynet.org/dcs/ContentServer?c=Page&pagena
me=QnetPublic%2FPage%2FQnetTier4&cid=1228773989482
https://www.qualitynet.org/dcs/ContentServer?c=Page&pagena
me=QnetPublic%2FPage%2FQnetTier4&cid=1228773989482
https://jamanetwork.com/journals/jama/fullarticle/2583369
https://www.ncbi.nlm.nih.gov/pubmed/28625702
https://www.ahrq.gov/sites/default/files/wysiwyg/professionals/
quality-patient-safety/pfp/2014finalhacreport-cx.pdf
AHRQ National Scorecard on Hospital-Acquired Conditions 25
The MPSMS-abstracted sample is representative of hospitals
submitting cases to the Hospital
IQR Program as specified for the “global” population.21 At
first, we excluded cases younger than
18 years of age to increase consistency with the four-condition
sample and cases meeting the
definitions for AMI, CHF, PN, and SCIP, because these charts
were monitored in the four-
condition sample. Later, we excluded cases involving any major
surgery to increase consistency
in the observed sample from year to year.
From 2014 to 2017, the overall number of charts used in the
analyses to calculate the NHR and
other information included in this document changed somewhat
from year to year. Only the
sample size of the global22 or four-condition complement group
increased every year. Detailed
information is provided in Exhibit A4.
Exhibit A4. Number of charts used in the 2014, 2015, 2016, and
2017 MPSMS analyses for the NHR
Year and Sample 2014 2015 2016 2017
AMI 4,234 4,076 3,797 2,651
CHF 4,820 2,423 5,330 3,779
Pneumonia 4,941 2,427 5,737 4,004
SCIP (CMS-defined
major surgery cases)
5,480 2,817 5,920 3,880
"Global" (four-condition
complement)
4,308 6,072 7,114 7,912
Total 23,783 17,815 27,898 22,226
Because the four-condition complement is defined by excluding
cases with AMI, CHF, PN, and
SCIP, the complement is also potentially affected by the
introduction of ICD-10 in quarter 4,
2015. However, because this sample reflects a much broader
spectrum of conditions treated in
acute care hospitals, we anticipate that the influence of this
change would be smaller when
applied to the four-condition “complement” than to the four
conditions themselves.
Results for Individual Measures
Depending on the year, the sample size varied from
approximately 18,000 to 28,000 charts,
reflecting care delivered in approximately 800 to 1,600
hospitals. Data are more precise for the
overall harm rates than for individual metrics. MPSMS is also
sensitive to changes in
documentation practices, which in turn may be sensitive to
changes in other measurement
practices. For example, changes to the technical specifications
used to define hospital-acquired
21 See “Section 2.9, “Global Initial Patient Population,” at
https://www.qualitynet.org/dcs/ContentServer?c=Page&pagena
me=QnetPublic%2FPage%2FQnetTier4&cid=12287
73989482.
22 The number of charts presented in Exhibit A4 for the global
sample in 2015 and 2016 is 4.3% and 11.2% less,
respectively, than indicated in the June 2018 report (see
https://www.ahrq.gov/sites/default/files/wysiwyg/professionals/
quality-patient-safety/pfp/natlhacratereport-
rebaselining2014-2016_0.pdf). The total charts in the samples
were reduced due to the removal of AMI, CHF, and
pneumonia charts that had been erroneously included in these
samples previously. Removing these charts from the
2015 and 2016 global samples resulted in lower HAC rates. Due
to these changes, the 2015 rate was reduced from
94 to 92 HACs per 1,000 discharges, and the 2016 rate was
reduced from 90 to 88.
https://www.qualitynet.org/dcs/ContentServer?c=Page&pagena
me=QnetPublic%2FPage%2FQnetTier4&cid=1228773989482
https://www.qualitynet.org/dcs/ContentServer?c=Page&pagena
me=QnetPublic%2FPage%2FQnetTier4&cid=1228773989482
https://www.ahrq.gov/sites/default/files/wysiwyg/professionals/
quality-patient-safety/pfp/natlhacratereport-rebaselining2014-
2016_0.pdf
https://www.ahrq.gov/sites/default/files/wysiwyg/professionals/
quality-patient-safety/pfp/natlhacratereport-rebaselining2014-
2016_0.pdf
AHRQ National Scorecard on Hospital-Acquired Conditions 26
infections or other adverse events might influence the way that
harms get documented in the
medical record over time. These changes to documentation in
turn might influence some of the
observed chart-abstracted HAC rates derived from the MPSMS.
Changes in documentation and
definitions also can influence the rates of other (PSI and NHSN-
based) data used in this analysis.
Possible Overrepresentation of Care Delivered in Small
Hospitals
The design of the MPSMS sample is closely linked to the
current and historical designs of the
Hospital IQR Program validation sample. Therefore, hospitals
in any given quarter generally
contributed approximately the same number of records of each
type each quarter regardless of
hospital size and volume. For example, a hospital that
discharges 10 patients per day and one that
discharges 100 patients per day would both have contributed
approximately the same number of
SCIP charts.
Because of this strategy, the MPSMS sample overrepresents
care delivered in smaller hospitals.
We anticipate this overrepresentation to be consistent over time.
However, because larger
hospitals generally tend to treat more complex cases, it is
conceivable that the overrepresentation
of patients from smaller hospitals may have a greater impact on
cases from the four-condition
complement (“global”) sample, which is younger and has fewer
comorbidities than the four-
condition samples. A paper based on risk-adjusted MPSMS data
covering the period of 2010 to
2017 is in preparation and is intended to follow up on results
previously published based on
MPSMS data for 2005–2011. 23
23 See https://www.ncbi.nlm.nih.gov/pubmed/24450892.
https://www.ncbi.nlm.nih.gov/pubmed/24450892
AHRQ National Scorecard on Hospital-Acquired Conditions 27
Appendix 5. Estimates for HAC Costs and Mortality
These data are based on the report Estimating the Additional
Hospital Inpatient Cost and
Mortality Associated With Selected Hospital-Acquired
Conditions.24 These data update and
replace the data available in Exhibit 1 in the 2013 Annual
Hospital-Acquired Condition Rate and
Estimates document.5
Exhibit A5. New estimates and comparisons with historical
estimates used to calculate
projections based on 2010–2014 data
NORC (2017)
Additional Cost per HAC Excess Mortality per HAC
Current (New) Study Estimate
(95% CI)
2010
AHRQ
Estimate
Current (New) Study
Estimate (95% CI)
2010 AHRQ
Estimate
ADE $5,746 (-$3,950–$15,441) $5,452 0.012 (0.003–0.025)
0.02
CAUTI $13,793 ($5,019–$22,568) $1,090 0.036 (0.004–0.079)
0.023
CLABSI $48,108 ($27,232–$68,983) $18,537 0.150 (0.070–
0.270) 0.185
Falls $6,694 (-$1,277–$14,665) $7,888 0.050 (0.035–0.070)
0.055
OB Adverse
Events
$602 (-$578–$1,782) $3,271 0.005 (0.003–0.013) 0.0015
Pressure
Ulcers/Pressure
Injuries
$14,506 (-$12,313–$41,326) $18,537 0.041 (0.013–0.093) 0.072
SSI $28,219 ($18,237–$38,202) $22,898 0.026 (0.009–0.059)
0.028
VAP $47,238 ($21,890–$72,587) $22,898 0.140 (-0.110–0.730)
0.144
VTE $17,367 ($11,837–$22,898) $8,723 0.043 (0.040–0.078)
0.104
Clostridioides
difficile Infection
$17,260 ($9,341–$25,180) None 0.044 (0.028–0.064) None
24 This report is available at
https://www.ahrq.gov/sites/default/files/wysiwyg/professionals/
quality-patient-
safety/pfp/hac-cost-report2017.pdf.
https://www.ahrq.gov/sites/default/files/wysiwyg/professionals/
quality-patient-safety/pfp/hac-cost-report2017.pdf
https://www.ahrq.gov/sites/default/files/wysiwyg/professionals/
quality-patient-safety/pfp/hac-cost-report2017.pdfAHRQ
National Scorecard on Hospital-Acquired ConditionsUpdated
Baseline Rates and Preliminary Results 2014–
2017SummaryDetailed Goals for 2019Appendix 1. Method To
Estimate the Baseline 2014 National Hospital-Acquired
Condition RateAppendix 2. 2014–2017 NHR Data Tabulated
(HACs and HAC Rate) and Compared With Summary 2010–
2014 DataAppendix 3. National Goals for 2019 Based on 2014
NHR Baseline (Projected Reductions in HACs, Costs, and
Deaths)Appendix 4. Changes in the Samples Used for the
MPSMS 2014–2017 Compared With 2010–2014 Previous
AnalysesChanges to the Hospital IQR Program and Its Impact
on the MPSMS Four-Condition SampleChanges From ICD-9 to
ICD-10 Coding and Their Impact on the MPSMS Four-
Condition SampleIntroduction of the Four-Condition
Complement (“Global”) SampleResults for Individual
MeasuresPossible Overrepresentation of Care Delivered in
Small HospitalsAppendix 5. Estimates for HAC Costs and
MortalityBlank Page
January 2019
AHRQ National Scorecard on Hospital-Acquired Conditions
Updated Baseline Rates and Preliminary Results 2014–2017
Summary
Updated and new patient safety data for 2014 through 2017
continue to show a downward
trend in the annual number of hospital-acquired conditions
(HACs). As reported in 2016, from
2010 through 2014, the rate of HACs decreased 17 percent. New
and updated data for 2014 to
2016 show an 11 percent decrease. When preliminary data for
2017 are included, the decrease
in HACs from 2014 to 2017 is 13 percent. From 2010 through
preliminary 2017 data, the
average annual reduction in the overall rate of HACs was
approximately 4.5 percent.
For the trend beginning in 2014, methods were updated and a
larger portion of hospital inpatients
were included in the HAC calculations. The 2014 rate started at
99 HACs per 1,000 hospital
discharges and is estimated at 86 HACs per 1,000 discharges for
2017. In the method previously
used, the 2010 rate was calculated as 145 HACs per 1,000
discharges and the 2014 rate was 121
HACs per 1,000 discharges. Both methods use the same 28
measures of patient safety events,
including many types of hospital-acquired infections, adverse
drug events, and injuries due to
procedures, as well as pressure ulcers/pressure injuries and
falls.
The newly established baseline of 99 HACs per 1,000
discharges in 2014 equates to
approximately 2,940,000 HACs among all hospital inpatients 18
years old and over. The updated
rate for 2017 equates to approximately 2,550,000 HACs. The
final 2017 HAC rate will be
updated and recalculated in the future to take into account
changes seen in seven of the HAC
measures that use ICD-101 data—these data will not be
available until late 2019. However, these
measures are responsible for only 8 to 10 percent of the annual
HACs measured for 2014–2017,
so the final calculations are unlikely to make meaningful
changes to the data.
Based on the HAC reductions seen in 2015, 2016, and 2017
compared with 2014, AHRQ
estimates a total of 910,000 fewer HACs occurred than if the
2014 rates had persisted through
2017. These HAC reductions lead to estimates of approximately
$7.7 billion in costs saved and
approximately 20,500 HAC-related inpatient deaths averted
from 2015 through 2017. Data
reported in 2016 estimated that from 2011 through 2014, HAC
reductions totaled 2.1 million,
and these reductions resulted in approximately $19.9 billion in
cost savings and 87,000 fewer
HAC-related inpatient deaths.2
In the new and updated data for 2014–2017, not all types of
HACs showed similar trends. For
example, measured adverse drug events continued to drop from
2014 to 2017, while measured
pressure ulcers/pressure injuries increased from 2014 to 2015
and then decreased somewhat from
2015 to 2016 and 2017. A similar trend was seen for physician-
diagnosed catheter-associated
urinary tract infections.
1 ICD-10 = International Classification of Diseases, 10th
Revision. The ninth revision is referred to as ICD-9.
2 See the AHRQ HAC report at
https://www.ahrq.gov/professionals/quality-patient-
safety/pfp/2014-final.html.
https://www.ahrq.gov/professionals/quality-patient-
safety/pfp/2014-final.html
AHRQ National Scorecard on Hospital-Acquired Conditions 2
Of special interest may be the apparent reduction in the rate of
antibiotic-associated Clostridioides
difficile3 infections. Comparing these data with other sources of
information, such as the Centers
for Disease Control and Prevention (CDC) and the AHRQ
Healthcare Cost and Utilization Project
(HCUP), may help us determine if efforts to reduce the
occurrence of this important HAC are
effective at the national level.
The new baseline of 99 HACs per 1,000 discharges was
established and calculated for 2014 to
monitor the progress of the Department of Health and Human
Services (HHS) goal to reduce
HACs by 20 percent from 2014 to 2019. This goal is
specifically tied to the Centers for Medicare
& Medicaid Services’ Hospital Improvement Innovation
Networks, which work collaboratively
with Federal and private partners to achieve this bold aim and
build on prior successes.
AHRQ estimates that if the 20 percent HAC reduction goal were
achieved, the HAC rate in
2019 would be 79 per 1,000 discharges. That means
approximately 1.8 million fewer HACs
would occur compared with the number that would have
occurred if HAC rates for 2015
through 2019 had stayed the same as in 2014. If a 20 percent
reduction were to occur in each
type of HAC measured, AHRQ projects that these 1.8 million
fewer HACs would be
associated with $19.2 billion in cost savings and 53,000 fewer
deaths from 2015 through 2019.
The results reported above through preliminary 2017 data are
not inconsistent with achieving
the 20 percent HAC reduction goal for 2019.
Detailed Results
The new 2014 baseline for the national HAC rate (NHR) is 99
HACs per 1,000 discharges.
Exhibit 1 shows the details. Clostridioides difficile Infections is
italicized because it was added
as a “focus” HAC for reduction efforts and tracking for 2014
through 2019. Clostridioides
difficile infections were previously tracked in the “All Other
HACs” measure, a collection of
13 other types of HACs. Methods used to calculate the NHR are
provided in Appendix 1, and
all the measures used in the NHR are shown in Appendix 2,
Exhibit A2c.
Exhibit 1. New 2014 national HAC rate baseline (rounded),
updated January 2019
Hospital-Acquired Condition
2014 Measured Baseline
for HACs
2014 Total HACs per
1,000 Discharges
Adverse Drug Events 1,001,000 33.7
Catheter-Associated Urinary Tract
Infections
170,000 5.7
Central Line-Associated Bloodstream
Infections
8500 0.3
Clostridioides difficile Infections 86,000 2.9
Falls 239,000 8.0
Obstetric Adverse Events 67,000 2.3
Pressure Ulcers/Pressure Injuries 647,000 21.8
Surgical Site Infections 73,000 2.5
3 Clostridium difficile has been changed to Clostridioides
difficile. More information is available at
https://www.ncbi.nlm.nih.gov/pubmed/27370902 and
https://www.cdc.gov/hai/organisms/cdiff/cdiff_infect.html
https://www.ncbi.nlm.nih.gov/pubmed/27370902
https://www.cdc.gov/hai/organisms/cdiff/cdiff_infect.html
AHRQ National Scorecard on Hospital-Acquired Conditions 3
Hospital-Acquired Condition
2014 Measured Baseline
for HACs
2014 Total HACs per
1,000 Discharges
Ventilator-Associated Pneumonias 36,000 1.2
(Post-op) Venous Thromboembolisms 25,000 0.9
All Other HACs 584,000 19.6
Total 2,940,000 99
The new baseline established with the 2014 data was developed
using a new method that was
based on the method previously used to calculate the 2010-2014
NHR.4 The major difference
between the new method and the previous method is that the
new method includes patient charts
for most conditions treated in acute care hospitals.
Previously, the Medicare Patient Safety Monitoring System
(MPSMS) used patient charts from
only four groups of patients. Three were represented by the
principal diagnosis (acute myocardial
infarction [AMI], congestive heart failure [CHF], and
pneumonia [PN]). The other comprised
major surgery patients, as described by the Surgical Care
Improvement Project [SCIP]). These
groups were used to calculate the 2010–2014 NHR. With the
new method, charts for conditions
other than AMI, CHF, PN, and SCIP were sampled as a single
group, starting with 2014, thus
producing five sets of inpatient charts.
The 2015 rate is 92 HACs per 1,000 discharges, and 2016 and
preliminary 2017 rates are 88 and
86 HACs per 1,000 discharges, respectively (Exhibit 2). Also
shown is the goal for 2019, 79
HACs per 1,000 discharges, which is a 20 percent reduction
from the 2014 baseline NHR of 99.
Detailed information on the number of HACs from 2015 to 2017
(preliminary) is shown in
Appendix 2, Exhibit A2c.
Appendix A2e shows how the current NHR, which starts in 2014
and will be tracked at least
through 2019, compares with the NHR trended for 2010 to 2014.
The 2010 to 2014 reduction
was 17 percent over 4 years, and the 2014 to 2019 goal is a 20
percent reduction over 5 years.
Appendix 3 shows the details of the HAC reductions, cost
savings, and inpatient mortality
reductions that are projected based on meeting this goal, which
total 1.8 million HACs, $19.2
billion, and 53,000 lives. Appendix 4 describes changes in the
samples used for the 2014–2017
analyses, compared with the 2010–2014 analyses.
4 See the report at
https://www.ahrq.gov/sites/default/files/wysiwyg/professionals/
quality-patient-
safety/pfp/pfphac.pdf.
https://www.ahrq.gov/sites/default/files/wysiwyg/professionals/
quality-patient-safety/pfp/pfphac.pdf
https://www.ahrq.gov/sites/default/files/wysiwyg/professionals/
quality-patient-safety/pfp/pfphac.pdf
AHRQ National Scorecard on Hospital-Acquired Conditions 4
Exhibit 2. Re-baselined 2014 data, with 2015, 2016, and
preliminary 2017 national HAC rate data,
and 2019 HAC goal
Exhibit 3 provides the same information as Exhibit 2, but in
table form that provides more details
on the combined results to date, based on 2015 and 2016 data
and preliminary data for 2017,
compared with the 2014 baseline.
AHRQ National Scorecard on Hospital-Acquired Conditions 5
Exhibit 3. Re-baselined 2014 data, with 2015, 2016, and
preliminary 2017 national HAC rate data,
and percent change through preliminary 2017data
Hospital-Acquired
Condition
2014
Measured
Baseline
for HACs
2015
Normalized
Count of
HACs
2016
Normalized
Count of
HACs
Preliminary
2017
Normalized
Count of
HACs
Percent
Change in
HACs, 2014
vs.
Preliminary
2017
2019 Goal
(20%
Reduction
of each
HAC)
Adverse Drug
Events
33.7 30.0 27.1 24.2 -28% 26.9
Catheter-
Associated Urinary
Tract Infections
5.7 6.4 5.7 5.4 -5% 4.6
Central Line-
Associated
Bloodstream
Infections
0.29 0.07 0.22 0.27 -6% 0.23
Clostridioides
difficile Infections
2.9 2.6 2.5 1.8 -37% 2.3
Falls 8.0 7.6 7.5 7.6 -5% 6.4
Obstetric Adverse
Events
2.3 2.2 2.2 2.2 -5% 1.8
Pressure Ulcers/
Pressure Injuries
21.7 23.5 22.7 23.0 6% 17.4
Surgical Site
Infections
2.5 2.5 2.5 2.5 0% 2.0
Ventilator-
Associated
Pneumonias
1.2 0.9 0.9 1.0 -13% 1.0
(Post-op) Venous
Thromboembolisms
0.9 0.4 0.7 0.7 -17% 0.7
All Other HACs 19.6 16.1 15.8 17.2 -12% 15.7
Totals (rounded) 99 92 88 86 -13% 79
With the overall HAC reductions described above, and based on
new per-HAC cost and
mortality estimates updated in 2017 (see Appendix 5), we
project that over 2015–2017, there
were approximately $7.7 billion in cost savings and 20,500
fewer deaths associated with HACs.
These projections are tabulated in Exhibit 4. In 2017, AHRQ
released a special report on costs
and inpatient mortality due to HACs.5
Appendix 5 shows the summary cost and mortality associated
with each of the 10 focus HAC
types, and the full report from which this table is excerpted is
available on the AHRQ website.5
The cost and mortality for “all other HACs” was not estimated
in this report and was estimated
based on a weighted average of the 10 focus HACs, with the
weighting based on the proportion
of each of the 10 focus HACs in the 2014 baseline data.
5 This report is available at
https://www.ahrq.gov/sites/default/files/wysiwyg/professionals/
quality-patient-
safety/pfp/hac-cost-report2017.pdf.
https://www.ahrq.gov/sites/default/files/wysiwyg/professionals/
quality-patient-safety/pfp/hac-cost-report2017.pdf
https://www.ahrq.gov/sites/default/files/wysiwyg/professionals/
quality-patient-safety/pfp/hac-cost-report2017.pdf
AHRQ National Scorecard on Hospital-Acquired Conditions 6
Exhibit 4. Projected cost savings and deaths averted due to HAC
changes to date from 2015
through preliminary 2017 data, compared with 2014 baseline
Total Change in HACs,
2015, 2016, and
Preliminary 2017 Data
Compared With 2014
Estimate of Total
Change in HAC-
Related Costs
Estimate of
Total Change in
HAC-Related
Deaths
Adverse Drug Events -585,000 -$3,360,000,000 -7,000
Catheter-Associated Urinary
Tract Infections
12,000 $170,000,000 400
Central Line-Associated
Bloodstream Infections
-9,000 -$420,000,000 -1,300
Clostridioides difficile
Infections
-54,000 -$920,000,000 -2,400
Falls -43,000 -$290,000,000 -2,100
Obstetric Adverse Events -9,000 -$10,000,000 -100
Pressure Ulcers/Pressure
Injuries
119,000 $1,720,000,000 4,900
Surgical Site Infections 0 $0 0
Ventilator-Associated
Pneumonias
-23,000 -$1,100,000,000 -3,300
Venous Thromboembolisms -22,000 -$390,000,000 -1,000
All Other HACs (not including
Clostridioides difficile
Infections)
-293,000 -$3,130,000,000 -8,700
Totals From Annual Changes
in HACs, HAC-Related Costs,
and Deaths
-910,000 -$7,730,000,000 -20,500
Note: Totals are rounded and thus may not reflect the total
obtained by adding the individual cells.
Detailed Goals for 2019
Achieving the goal of a 20 percent reduction in HACs (going
from 99 to 79 HACs per 1,000
discharges; see Exhibit 3) would result in approximately 1.8
million fewer HACs in the years from
2015 to 2019. With constant annual reductions toward a 20
percent reduction across all measured
HACs, and based on the new per-HAC estimates for costs and
mortality from the 2017 study
funded by AHRQ (see Appendix 5), our projections indicate
approximately $19.2 billion in cost
savings for the 5 years and 53,000 HAC-related deaths averted.
These data are tabulated in
Appendix 3.
Data reported in late 2016 estimated that for the 4 years from
2011 through 2014, HAC
reductions totaled 2.1 million compared with 2010 baseline
data. These reductions resulted in
approximately $19.9 billion in cost savings and 87,000 fewer
HAC-related inpatient deaths.6
6 See report at https://www.ahrq.gov/professionals/quality-
patient-safety/pfp/2014-final.html.
https://www.ahrq.gov/professionals/quality-patient-
safety/pfp/2014-final.html
AHRQ National Scorecard on Hospital-Acquired Conditions 7
Looking Ahead
In spite of the volume and velocity of data flowing into and
through healthcare, providers, health
system leaders, and other stakeholders lack sufficient
information to guide their efforts as they
work to prevent HACs. Similarly, patients’ choices often occur
without the robust information
they need, and this limitation constrains their efforts to be
engaged in their own care.
In addition, numerous other unmet needs must be addressed to
continue preventing HACs and
sustain the improvements documented in this report. In
particular, we must continue to advance
patient safety measurement, expand the evidence base for
patient safety improvement strategies,
and create resources to help providers and the healthcare
workforce improve patient safety at the
point of care.
For example, it is critically important that we continue to drive
innovation that efficiently
harnesses the full potential of data and measurement. AHRQ’s
patient safety measurement
projects, including QSRS, are making progress by moving
information closer to points of care
where it can support providers and the safer care that all
stakeholders want to achieve.
A powerful foundation of knowledge about how to improve
patient safety has been established
over more than two decades of AHRQ-funded research and
implementation projects, and, if we
want to use this knowledge to address persistent patient safety
challenges, it is crucial to pair it
with capabilities that help clinicians and other healthcare
workers reliably measure patient safety
threats. When providers trust information they receive about
patient safety, they are in better
positions to understand these ongoing problems and to
effectively prioritize and target them with
safer practices. QSRS is being developed in part to serve this
purpose by providing information
that clinicians and other healthcare workers will trust and use to
improve safety.
AHRQ and other HHS agencies recognize that improving the
safety and quality of healthcare is
the ultimate purpose of measurement systems, and the ability to
support this improvement
effectively and efficiently is a desirable characteristic of these
systems. AHRQ and CMS are
using the MPSMS as the primary system to measure the NHR,
but AHRQ has been working with
CMS and other Federal partners, contractors, and other experts
to develop the Quality and Safety
Review System (QSRS), an improved system to succeed
MPSMS.
The QSRS has been developed and is undergoing use in the
Clinical Data Abstraction Center,
pilot testing at non-Federal settings,7 and refinement pursuant
to the goal of supporting safe,
high-quality care. QSRS has been designed as a robust
measurement platform that will serve the
shared needs of different healthcare stakeholders.
7 See https://www.ahrq.gov/professionals/quality-patient-
safety/qsrs/index.html and https://www.ahrq.gov/sites/
default/files/wysiwyg/research/findings/factsheets/translating/ac
tion3/actioniii-2016-summaries.pdf.
https://www.ahrq.gov/professionals/quality-patient-
safety/qsrs/index.html
https://www.ahrq.gov/sites/default/files/wysiwyg/research/findi
ngs/factsheets/translating/action3/actioniii-2016-summaries.pdf
https://www.ahrq.gov/sites/default/files/wysiwyg/research/findi
ngs/factsheets/translating/action3/actioniii-2016-summaries.pdf
https://www.psoppc.org/psoppc_web/publicpages/surveillanceco
mmonformats
https://www.ncbi.nlm.nih.gov/pubmed/28671914
http://www.pso.ahrq.gov/common/development
AHRQ National Scorecard on Hospital-Acquired Conditions 8
QSRS is designed to provide up-to-date national HAC rates,
including rates of some additional
types of HACs not currently measured with MPSMS, the AHRQ
Patient Safety Indicators
(PSIs), the Centers for Disease Control and Prevention National
Healthcare Safety Network
(NHSN), or other sources of information concerning patient
safety in hospitals. It has been
developed so that non-Federal entities, including hospitals and
healthcare systems, will be able
use it to measure patient safety.
QSRS will allow assessment of safety for new patient
populations not currently captured by
MPSMS, which was originally designed to focus on adverse
events experienced by Medicare
patients. In addition, QSRS will allow organizations to consider
aligning their local patient safety
measurements with the same methods and measures used at the
national level. Standard methods
for measurement, such as those in QSRS, have been a valuable
component of other healthcare
improvement initiatives, including some that have addressed
more specific safety challenges.
The AHRQ Common Formats for Surveillance8 serve as the
underlying content that provides the
foundation of QSRS measures and cover a broad range of
common and uncommon threats to
patient safety. Development and revision of the Common
Formats for Surveillance and QSRS
are ongoing processes that include structured review and public
feedback facilitated by the
National Quality Forum. After release of QSRS, AHRQ will
rely on feedback, especially from
users, to inform the development of new versions of the
Common Formats for Surveillance and
for QSRS. This process will enable the Common Formats and
QSRS to keep pace with users’
needs and the emerging scientific evidence base for patient
safety and quality improvement.
Some data needed for patient safety measurement may be
increasingly available from electronic
health records. AHRQ continues to explore the feasibility of
automated approaches to data
abstraction9 in order to further improve efficiency and reduce
burden while maintaining the
validity of QSRS and enhancing its ease of use. These include
the AHRQ Common Formats for
Surveillance, a subset of the AHRQ Common Formats.10
8 More information is available at
https://www.psoppc.org/psoppc_web/publicpages/surveillanceco
mmonformats.
9 See publication in the Journal of Patient Safety online at:
https://www.ncbi.nlm.nih.gov/pubmed/28671914. A new
study and report is currently in preparation and is expected to
be complete later this year.
10 More information is available at
www.pso.ahrq.gov/common/development.
AHRQ National Scorecard on Hospital-Acquired Conditions 9
Appendix 1. Method To Estimate the Baseline 2014 National
Hospital-
Acquired Condition Rate
This document describes the methods AHRQ has developed to
estimate the national rate of
HACs for 2014 to 2019, which has a goal of a 20 percent
reduction in HACs. The estimate
includes a wide variety of adverse events, including the 10
HACs selected for special focus by
CMS as part of the programs to achieve the 20 percent
reduction, as well as several other HACs.
Collectively, 28 specific measures are used (Exhibit A1a): 15
measures to generate rates for the
10 specific focus HACs and 13 measures to generate a summary
rate for “all other” HACs. Of
the 28 measures, 21 are from the MPSMS, 6 are from the PSIs,
and 1 is based on NHSN data.
Exhibit A1a. Measures used to estimate the national HAC rate
HAC Type Source Measure
Adverse Drug
Event
MPSMS ADE Associated With Digoxin
MPSMS ADE Associated With Hypoglycemic Agents
MPSMS ADE Associated With IV Heparin
MPSMS ADE Associated With LMWH and Factor Xa Inhibitor
MPSMS ADE Associated With Warfarin
CAUTI MPSMS Catheter-Associated Urinary Tract Infections
CDI MPSMS Clostridioides difficile Infections
CLABSI MPSMS Blood Stream Infections Associated With
Central Venous Catheters
Falls MPSMS In-Hospital Patient Falls
Obstetric
Adverse
Events
PSI OB Trauma in Vaginal Delivery
(PSI 19)
With (PSI 18) and Without Instrument
Pressure Ulcer MPSMS Hospital-Acquired Pressure
Ulcers/Pressure Injuries
Surgical Site
Infection
NHSN SSIs for 17 procedures w/CDC SCIP+5 data
VAP MPSMS Ventilator-Associated Pneumonia
VTE MPSMS Postoperative Venous Thromboembolic Events
All Other
Hospital-
Acquired
Conditions
MPSMS Femoral Artery Puncture for Catheter Angiographic
Procedures
MPSMS Adverse Event Associated With Hip Joint
Replacements
MPSMS Adverse Event Associated With Knee Joint
Replacements
MPSMS Contrast Nephropathy Associated With Catheter
Angiography
MPSMS Hospital-Acquired MRSA
MPSMS Hospital-Acquired Vancomycin-Resistant Enterococcus
(VRE)
MPSMS Mechanical Complications Associated With Central
Venous Catheters
MPSMS Postoperative Cardiac Events for Cardiac and
Noncardiac Surgeries
MPSMS Postoperative Pneumonia
PSI Iatrogenic Pneumothorax (PSI 6)
PSI Post-Op Hemorrhage or Hematoma (PSI 9)
PSI Post-Op Respiratory Failure (PSI 11)
PSI Accidental Puncture or Laceration (PSI 15)
AHRQ National Scorecard on Hospital-Acquired Conditions 10
Data from these 28 measures are combined to generate a
summary national HAC rate (NHR) that
has been calculated annually since 2010.4 The current method is
built on the 2010–2014 methods
but includes some changes. The current method removes the use
of reference data from 2005–
2006 and includes a fifth set or sample of charts to augment the
four samples used in the 2010–
2014 method.
In the 2010–2014 method, Clostridioides difficile Infection data
were included in “All Other
HACs” rather than as a focus HAC, which is the case with the
new method. As before, the new
method uses HCUP data on the annual number of hospital
inpatient discharges as the
denominator for the rate calculations. The details of how the
current NHR is calculated are
summarized below.
1. The NHR is calculated using the following variables:
a. Rate of 21 MPSMS adverse events in the MPSMS sample
provided by CMS,
including those in the SCIP (major surgery) sample, those with
a principal diagnosis
of AMI, CHF, or pneumonia, and a “global” sample intended to
complement these
four groups of patients. The sample is limited to patients 18
years old and over.
For the NHR calculation, the rates of the 21 MPSMS adverse
events are expressed as
a rate for the whole sample population, rather than as a rate for
the subpopulation that
has the opportunity to experience the adverse event. For
example, the CLABSI rate,
like all rates in the sample, uses all patients in the denominator,
not just the patients
who had a central line inserted during their hospital stay.
For each of the 21 MPSMS HACs, the estimate is a weighted
average of the HAC
rate for each group, where each group is given a weight that
approximates the fraction
of patients the group represents in the hospital discharge
population age 18 and over.
This approach ensures that the estimated rate will not be
affected by variation across
years in the percentage of patients in the samples of charts
representing each of the
five groups (SCIP, AMI, CHF, pneumonia, and global). It also
uses the data from
each sample in a way that best represents the conditions treated
in the actual hospital
inpatient population.
The weights follow, based on their percentage11 of the inpatient
population:
• AMI: 2.15%,
• CHF: 3.24%,
• Pneumonia: 4.41%,
• SCIP plus 5 other major surgeries: 19.17%,
• Global: 71.03%.
11 These weights (percentages) are slightly different than in the
report released in June 2018 (see
https://www.ahrq.gov/sites/default/files/wysiwyg/professionals/
quality-patient-safety/pfp/natlhacratereport-
rebaselining2014-2016_0.pdf). The change in weights to
incorporate newer information is the reason that the HAC
rate calculated in the June 2018 report for 2014 was 98 HACs
per 1,000 discharges, while the rate for 2014 in this
report is 99.
https://www.ahrq.gov/sites/default/files/wysiwyg/professionals/
quality-patient-safety/pfp/natlhacratereport-rebaselining2014-
2016_0.pdf
https://www.ahrq.gov/sites/default/files/wysiwyg/professionals/
quality-patient-safety/pfp/natlhacratereport-rebaselining2014-
2016_0.pdf
AHRQ National Scorecard on Hospital-Acquired Conditions 11
These AMI, CHF, and pneumonia patient data percentages were
based on data from
2014 from the AHRQ National Inpatient Sample. The
percentage of SCIP+5 patients
was calculated based on the number of surgeries in the SCIP+5
sample from CDC,
which was 5,704,493 among 29,751,955 discharges in 2014. The
weighting for the
global sample was 100 percent minus the contribution from the
other four samples.
b. National number of adverse events captured by PSIs 18 and
19 on obstetric
injury and national number of four other PSIs (6, 9, 11, and 15)
included among “all
other” HACs.12
c. National number of selected surgical site infections computed
in a special
calculation for CDC. This calculation is based on NHSN data
for 17 specific
operations: the 12 SCIP operations and 5 other major surgical
procedures not
included in the SCIP.13
d. To estimate the rate of adverse events for each of the 21
HACs for all patients for
which the MPSMS data are used, we follow these steps:
• Multiply the adverse event rate for each of the 21 HACs for
patients with one of
the five conditions included in the 2014–2017 MPSMS samples
by the number of
hospital inpatients represented by the sample, as calculated by
the weight of each
sample and the overall total annual national discharges listed
above.
• Sum the estimates for each of the five samples for each
measure to produce an
estimate for each of the 21 measures.
2. The estimated total count of annual HACs in the national
HAC rate is calculated as the
sum of the total number of HACs for the 21 MPSMS HACs in
(d) above, plus the
estimated number of PSI HACs in (b), plus the number of
NHSN-estimated HACs in (c).
3. The national HAC rate is the total HAC count in (2) above
divided by the number of
annual hospital inpatient discharges of patients at least 18 years
old, as provided by HCUP.
4. As of January 2019, this method established for 2014 has
been repeated for 2015, 2016,
and 2017; we used 2016 data preliminarily for the number of
annual hospital discharges
in 2017. We aim to compare the estimated total number of
HACs for 2015–2019 with the
2014 baseline without having the comparison affected by
changes in the total number of
discharges. Thus, for each year to date (2015, 2016, and
preliminary 2017) we normalized
the data to generate national estimates of HACs based on
29,751,955 discharges, which
was the total number of discharges in 2014 for inpatients 18
years old and over. This
method will be used again to finalize estimates for 2017 and to
establish new estimates for
2018, and 2019 as the data become available.
12 Due to the transition from ICD-9 to ICD-10 that occurred
with the start of the fourth quarter of 2015 and the effect
of this change on the PSI data, only data from the first three
quarters of 2015 were used to calculate the number of
PSI events for 2015. The number of PSI events for January
through September 2015 was multiplied by 4/3 to
estimate the number of events (HACs) for the full year of 2015.
13 Due to the ICD-9 to ICD-10 transition that occurred with the
start of the fourth quarter of 2015, only data from the
first three quarters of 2015 were used to calculate the number of
CDC NHSN SSI events for 2015. The CDC
estimate provided for 2015 was based on 12 months of data,
from October 2014 through September 2015.
AHRQ National Scorecard on Hospital-Acquired Conditions 12
5. Due to changes in how some conditions and adverse events
are described in ICD-9 and
ICD-10, the data for the 7 of 28 measures that depend entirely
or partly on administrative
data cannot be compared for 2015 and 2016. These measures
include the 6 PSI-based
measures and the SSI data that constitute about 8 to 10 percent
of the overall NHR for
2014 through 2017. To address this situation, we have reused
the data from 2015 in the
2016 and 2017 results for these measures. In late 2019, we
anticipate receiving new data
for 2017 based on ICD-10 data that will enable us to compare
the data with the 2016 data
we currently have for these measures and to develop a method
to continue the trending
from 2014 to 2019 for these measures within the overall NHR.
The data for 2016 we
have received from the AHRQ HCUP team and the CDC NHSN
statistician are tabulated
below in Exhibit A1b. For the reasons described above, these
data are not used in the
2016 NHR computed in this report but are included for
completeness.
Exhibit A1b. Data from AHRQ HCUP and CDC NHSN on total
numbers of HACs associated with
each ICD-10-dependent measure for 2016
Number of Patients
Number of Cases of Included in Sample
Measure Name for 2016 Adverse Events for This Measure
PSI 6, Iatrogenic Pneumothorax 7,372 18,948,556
PSI 9, Perioperative Hemorrhage or Hematoma 12,285
5,368,607
PSI 11, Postoperative Respiratory Failure 35,971 2,384,676
PSI 15, Unrecognized Abdominopelvic Accidental 32,396
19,811,918
Puncture/Laceration
PSI 18, Obstetric Trauma - Vaginal Delivery with 14,663
121,323
Instrument
PSI 19, Obstetric Trauma - Vaginal Delivery without 34,066
1,874,410
Instrument
Surgical Site Infections (special calculation performed 80,157
5,999,045 (estimate)
by CDC NHSN to include SSIs in a consistent set of
major surgeries since 2010)
These data were not used in this report because they cannot be
directly compared with prior years of data.
AHRQ National Scorecard on Hospital-Acquired Conditions 13
Appendix 2. 2014–2017 NHR Data Tabulated (HACs and HAC
Rate)
and Compared With Summary 2010–2014 Data
Information on the HACs for 2014, 2015, 2016, and 2017 is
provided below. Exhibit A2a shows
the calculated number of HACs (rounded), and Exhibit A2b
shows the calculated HAC rates per
1,000 discharges. Exhibit A2c shows all the measures, including
those used in the calculation of
“All Other HACs.”
These data have been normalized to account for the changes in
annual discharges, i.e., the
number of HACs shown in 2015–2017 is based on the number of
HACs that would have
occurred if the number of hospital discharges in 2015
(30,167,977) and 2016 (30,188,612) were
unchanged from that in 2014 (29,751,955). The 2017 data
shown are also normalized to 2014,
but with 2016 data being used because 2017 hospital discharge
data are not yet available.
Hospital discharge data are from HCUP, and the exact numbers
are based on a special analysis
performed for this study to limit hospital discharges to those 18
years old and over. Data for the
six PSIs and the SSI data from CDC are also wholly or partially
based on HCUP data that
depend on ICD-9 (through quarter 3 of 2015) or ICD-10
(beginning with quarter 4 of 2015).
Because data based on ICD-9 and ICD-10 cannot be directly
compared with each other, we
cannot compare the measures for Obstetric Adverse Events and
SSIs, as well as four of the PSI
measures that contribute to “All Other HACs.”
The data for 2017 are not currently available, and 2015 data are
used in the preliminary estimates
for 2017 as well. When 2017 data are available, we expect to
compare 2016–2017 data that are
dependent on ICD-10 and to continue that new trend through
2019. At present, we do not expect
to be able to develop a method that will enable us to compare
the data from ICD-based measures
for 2015 with 2016.
AHRQ National Scorecard on Hospital-Acquired Conditions 14
Exhibit A2a. HAC count estimates (rounded)
Hospital-Acquired
Condition
2014 Measured
Baseline for
HACs
2015
Normalized
Count of HACs
2016
Normalized
Count of HACs
Preliminary
2017
Normalized
Count of HACs
Change in
HACs, 2014 vs.
Preliminary
2017
Percent
Change in
HACs, 2014 vs
Preliminary
2017 14
Adverse Drug Events 1,001,000 894,000 805,000 721,000 -
280,000 -28%
Catheter-Associated
Urinary Tract Infections
170,000 191,000 170,000 161,000 -9,000 -5%
Central Line-Associated
Bloodstream Infections
Presenting Statistical Results for Decision MakingAt any enterpr.docx

More Related Content

Similar to Presenting Statistical Results for Decision MakingAt any enterpr.docx

Lessening the Negative Impact of Human Factors Linking Staffing Variables & P...
Lessening the Negative Impact of Human Factors Linking Staffing Variables & P...Lessening the Negative Impact of Human Factors Linking Staffing Variables & P...
Lessening the Negative Impact of Human Factors Linking Staffing Variables & P...API Healthcare
 
The Top Seven Analytics-Driven Approaches for Reducing Diagnostic Error and I...
The Top Seven Analytics-Driven Approaches for Reducing Diagnostic Error and I...The Top Seven Analytics-Driven Approaches for Reducing Diagnostic Error and I...
The Top Seven Analytics-Driven Approaches for Reducing Diagnostic Error and I...Health Catalyst
 
Fall 2014 Communique by Anesthesia Business Consultants (ABC)
Fall 2014 Communique by Anesthesia Business Consultants (ABC)Fall 2014 Communique by Anesthesia Business Consultants (ABC)
Fall 2014 Communique by Anesthesia Business Consultants (ABC)Anesthesia Business Consultants
 
Anesthesia Business Consultants Communique Spring 2014 Edition
Anesthesia Business Consultants Communique Spring 2014 EditionAnesthesia Business Consultants Communique Spring 2014 Edition
Anesthesia Business Consultants Communique Spring 2014 EditionAnesthesia Business Consultants
 
The Changing Landscape: Value-Based Purchasing, Reimbursement and its Impact ...
The Changing Landscape: Value-Based Purchasing, Reimbursement and its Impact ...The Changing Landscape: Value-Based Purchasing, Reimbursement and its Impact ...
The Changing Landscape: Value-Based Purchasing, Reimbursement and its Impact ...marcus evans Network
 
Stfm april 28 2011
Stfm april 28 2011Stfm april 28 2011
Stfm april 28 2011Paul Grundy
 
Classifying Readmissions of Diabetic Patient Encounters
Classifying Readmissions of Diabetic Patient EncountersClassifying Readmissions of Diabetic Patient Encounters
Classifying Readmissions of Diabetic Patient EncountersMayur Srinivasan
 
About Cypress Benefit Administrators
About Cypress Benefit AdministratorsAbout Cypress Benefit Administrators
About Cypress Benefit Administratorsjustinhorn
 
What can nurses do that doctors cannot?
What can nurses do that doctors cannot?What can nurses do that doctors cannot?
What can nurses do that doctors cannot?Naomi C Jackson
 
The Sustainable Health Care Facility of the FutureTextbooks H.docx
The Sustainable Health Care Facility of the FutureTextbooks H.docxThe Sustainable Health Care Facility of the FutureTextbooks H.docx
The Sustainable Health Care Facility of the FutureTextbooks H.docxchristalgrieg
 
330 michelson and pandey
330 michelson and pandey330 michelson and pandey
330 michelson and pandeyhfmadixie
 
Ohio may 14 2011
Ohio may 14 2011 Ohio may 14 2011
Ohio may 14 2011 Paul Grundy
 
Introductory concepts in health sector planning
Introductory concepts in health sector planningIntroductory concepts in health sector planning
Introductory concepts in health sector planningNayyar Kazmi
 
Four ways data is improving healthcare operations
Four ways data is improving healthcare operationsFour ways data is improving healthcare operations
Four ways data is improving healthcare operationsTableau Software
 
Home Healthcare + Data Science: A Prescription For Our Nation's Readmissions ...
Home Healthcare + Data Science: A Prescription For Our Nation's Readmissions ...Home Healthcare + Data Science: A Prescription For Our Nation's Readmissions ...
Home Healthcare + Data Science: A Prescription For Our Nation's Readmissions ...Wes Little
 
Cross the Finish Line First
Cross the Finish Line FirstCross the Finish Line First
Cross the Finish Line FirstVitreosHealth
 
All You Ever Needed to Know About the Healthcare Design Industry
All You Ever Needed to Know About the Healthcare Design IndustryAll You Ever Needed to Know About the Healthcare Design Industry
All You Ever Needed to Know About the Healthcare Design IndustrySara Marberry
 
Please follow instructions carefully. Thank you so kindly. Ass.docx
Please follow instructions carefully. Thank you so kindly. Ass.docxPlease follow instructions carefully. Thank you so kindly. Ass.docx
Please follow instructions carefully. Thank you so kindly. Ass.docxmattjtoni51554
 

Similar to Presenting Statistical Results for Decision MakingAt any enterpr.docx (20)

Finalists of the 2023 Business Case for Healthcare Quality
Finalists of the 2023 Business Case for Healthcare QualityFinalists of the 2023 Business Case for Healthcare Quality
Finalists of the 2023 Business Case for Healthcare Quality
 
Lessening the Negative Impact of Human Factors Linking Staffing Variables & P...
Lessening the Negative Impact of Human Factors Linking Staffing Variables & P...Lessening the Negative Impact of Human Factors Linking Staffing Variables & P...
Lessening the Negative Impact of Human Factors Linking Staffing Variables & P...
 
The Top Seven Analytics-Driven Approaches for Reducing Diagnostic Error and I...
The Top Seven Analytics-Driven Approaches for Reducing Diagnostic Error and I...The Top Seven Analytics-Driven Approaches for Reducing Diagnostic Error and I...
The Top Seven Analytics-Driven Approaches for Reducing Diagnostic Error and I...
 
Fall 2014 Communique by Anesthesia Business Consultants (ABC)
Fall 2014 Communique by Anesthesia Business Consultants (ABC)Fall 2014 Communique by Anesthesia Business Consultants (ABC)
Fall 2014 Communique by Anesthesia Business Consultants (ABC)
 
Anesthesia Business Consultants Communique Spring 2014 Edition
Anesthesia Business Consultants Communique Spring 2014 EditionAnesthesia Business Consultants Communique Spring 2014 Edition
Anesthesia Business Consultants Communique Spring 2014 Edition
 
The Changing Landscape: Value-Based Purchasing, Reimbursement and its Impact ...
The Changing Landscape: Value-Based Purchasing, Reimbursement and its Impact ...The Changing Landscape: Value-Based Purchasing, Reimbursement and its Impact ...
The Changing Landscape: Value-Based Purchasing, Reimbursement and its Impact ...
 
Stfm april 28 2011
Stfm april 28 2011Stfm april 28 2011
Stfm april 28 2011
 
Classifying Readmissions of Diabetic Patient Encounters
Classifying Readmissions of Diabetic Patient EncountersClassifying Readmissions of Diabetic Patient Encounters
Classifying Readmissions of Diabetic Patient Encounters
 
About Cypress Benefit Administrators
About Cypress Benefit AdministratorsAbout Cypress Benefit Administrators
About Cypress Benefit Administrators
 
What can nurses do that doctors cannot?
What can nurses do that doctors cannot?What can nurses do that doctors cannot?
What can nurses do that doctors cannot?
 
The Sustainable Health Care Facility of the FutureTextbooks H.docx
The Sustainable Health Care Facility of the FutureTextbooks H.docxThe Sustainable Health Care Facility of the FutureTextbooks H.docx
The Sustainable Health Care Facility of the FutureTextbooks H.docx
 
330 michelson and pandey
330 michelson and pandey330 michelson and pandey
330 michelson and pandey
 
Ohio may 14 2011
Ohio may 14 2011 Ohio may 14 2011
Ohio may 14 2011
 
Introductory concepts in health sector planning
Introductory concepts in health sector planningIntroductory concepts in health sector planning
Introductory concepts in health sector planning
 
Four ways data is improving healthcare operations
Four ways data is improving healthcare operationsFour ways data is improving healthcare operations
Four ways data is improving healthcare operations
 
Home Healthcare + Data Science: A Prescription For Our Nation's Readmissions ...
Home Healthcare + Data Science: A Prescription For Our Nation's Readmissions ...Home Healthcare + Data Science: A Prescription For Our Nation's Readmissions ...
Home Healthcare + Data Science: A Prescription For Our Nation's Readmissions ...
 
Cross the Finish Line First
Cross the Finish Line FirstCross the Finish Line First
Cross the Finish Line First
 
All You Ever Needed to Know About the Healthcare Design Industry
All You Ever Needed to Know About the Healthcare Design IndustryAll You Ever Needed to Know About the Healthcare Design Industry
All You Ever Needed to Know About the Healthcare Design Industry
 
Please follow instructions carefully. Thank you so kindly. Ass.docx
Please follow instructions carefully. Thank you so kindly. Ass.docxPlease follow instructions carefully. Thank you so kindly. Ass.docx
Please follow instructions carefully. Thank you so kindly. Ass.docx
 
CDW_Transparency and Front End Collection Presentation
CDW_Transparency and Front End Collection PresentationCDW_Transparency and Front End Collection Presentation
CDW_Transparency and Front End Collection Presentation
 

More from stilliegeorgiana

1. The Incident Command System (ICS) is a tool forA. Co.docx
1. The Incident Command System (ICS) is a tool forA. Co.docx1. The Incident Command System (ICS) is a tool forA. Co.docx
1. The Incident Command System (ICS) is a tool forA. Co.docxstilliegeorgiana
 
1. The Thirteenth Amendment effectively brought an end to slaver.docx
1. The Thirteenth Amendment effectively brought an end to slaver.docx1. The Thirteenth Amendment effectively brought an end to slaver.docx
1. The Thirteenth Amendment effectively brought an end to slaver.docxstilliegeorgiana
 
1. The Thirteenth Amendment effectively brought an end to slavery in.docx
1. The Thirteenth Amendment effectively brought an end to slavery in.docx1. The Thirteenth Amendment effectively brought an end to slavery in.docx
1. The Thirteenth Amendment effectively brought an end to slavery in.docxstilliegeorgiana
 
1. The Fight for a True Democracyhttpswww.nytimes.com201.docx
1. The Fight for a True Democracyhttpswww.nytimes.com201.docx1. The Fight for a True Democracyhttpswww.nytimes.com201.docx
1. The Fight for a True Democracyhttpswww.nytimes.com201.docxstilliegeorgiana
 
1. The article for week 8 described hip hop as a weapon. This weeks.docx
1. The article for week 8 described hip hop as a weapon. This weeks.docx1. The article for week 8 described hip hop as a weapon. This weeks.docx
1. The article for week 8 described hip hop as a weapon. This weeks.docxstilliegeorgiana
 
1. The Hatch Act defines prohibited activities of public employees. .docx
1. The Hatch Act defines prohibited activities of public employees. .docx1. The Hatch Act defines prohibited activities of public employees. .docx
1. The Hatch Act defines prohibited activities of public employees. .docxstilliegeorgiana
 
1. The Case for Reparations” by Ta-Nehisi Coates (604-19) in Rere.docx
1. The Case for Reparations” by Ta-Nehisi Coates (604-19) in Rere.docx1. The Case for Reparations” by Ta-Nehisi Coates (604-19) in Rere.docx
1. The Case for Reparations” by Ta-Nehisi Coates (604-19) in Rere.docxstilliegeorgiana
 
1. Some people say that chatbots are inferior for chatting.Others di.docx
1. Some people say that chatbots are inferior for chatting.Others di.docx1. Some people say that chatbots are inferior for chatting.Others di.docx
1. Some people say that chatbots are inferior for chatting.Others di.docxstilliegeorgiana
 
1. Some people say that chatbots are inferior for chatting.Other.docx
1. Some people say that chatbots are inferior for chatting.Other.docx1. Some people say that chatbots are inferior for chatting.Other.docx
1. Some people say that chatbots are inferior for chatting.Other.docxstilliegeorgiana
 
1. Some people say that chatbots are inferior for chatting. Others d.docx
1. Some people say that chatbots are inferior for chatting. Others d.docx1. Some people say that chatbots are inferior for chatting. Others d.docx
1. Some people say that chatbots are inferior for chatting. Others d.docxstilliegeorgiana
 
1. Tell us about yourself and your personal journey that has to .docx
1. Tell us about yourself and your personal journey that has to .docx1. Tell us about yourself and your personal journey that has to .docx
1. Tell us about yourself and your personal journey that has to .docxstilliegeorgiana
 
1. Tell us what characteristics of Loma Linda University are particu.docx
1. Tell us what characteristics of Loma Linda University are particu.docx1. Tell us what characteristics of Loma Linda University are particu.docx
1. Tell us what characteristics of Loma Linda University are particu.docxstilliegeorgiana
 
1. Tell us about yourself and your personal journey that has lea.docx
1. Tell us about yourself and your personal journey that has lea.docx1. Tell us about yourself and your personal journey that has lea.docx
1. Tell us about yourself and your personal journey that has lea.docxstilliegeorgiana
 
1. The Research paper will come in five parts. The instructions are.docx
1. The Research paper will come in five parts. The instructions are.docx1. The Research paper will come in five parts. The instructions are.docx
1. The Research paper will come in five parts. The instructions are.docxstilliegeorgiana
 
1. The minutiae points located on a fingerprint will help determine .docx
1. The minutiae points located on a fingerprint will help determine .docx1. The minutiae points located on a fingerprint will help determine .docx
1. The minutiae points located on a fingerprint will help determine .docxstilliegeorgiana
 
1. The initial post is to be posted first and have 300-500 words.docx
1. The initial post is to be posted first and have 300-500 words.docx1. The initial post is to be posted first and have 300-500 words.docx
1. The initial post is to be posted first and have 300-500 words.docxstilliegeorgiana
 
1. The key elements of supplier measurement are quality, delivery, a.docx
1. The key elements of supplier measurement are quality, delivery, a.docx1. The key elements of supplier measurement are quality, delivery, a.docx
1. The key elements of supplier measurement are quality, delivery, a.docxstilliegeorgiana
 
1. Search the Internet and locate an article that relates to the top.docx
1. Search the Internet and locate an article that relates to the top.docx1. Search the Internet and locate an article that relates to the top.docx
1. Search the Internet and locate an article that relates to the top.docxstilliegeorgiana
 
1. Text mining – Text mining or text data mining is a process to e.docx
1. Text mining – Text mining or text data mining is a process to e.docx1. Text mining – Text mining or text data mining is a process to e.docx
1. Text mining – Text mining or text data mining is a process to e.docxstilliegeorgiana
 
1. Students need to review 3 different social media platforms that a.docx
1. Students need to review 3 different social media platforms that a.docx1. Students need to review 3 different social media platforms that a.docx
1. Students need to review 3 different social media platforms that a.docxstilliegeorgiana
 

More from stilliegeorgiana (20)

1. The Incident Command System (ICS) is a tool forA. Co.docx
1. The Incident Command System (ICS) is a tool forA. Co.docx1. The Incident Command System (ICS) is a tool forA. Co.docx
1. The Incident Command System (ICS) is a tool forA. Co.docx
 
1. The Thirteenth Amendment effectively brought an end to slaver.docx
1. The Thirteenth Amendment effectively brought an end to slaver.docx1. The Thirteenth Amendment effectively brought an end to slaver.docx
1. The Thirteenth Amendment effectively brought an end to slaver.docx
 
1. The Thirteenth Amendment effectively brought an end to slavery in.docx
1. The Thirteenth Amendment effectively brought an end to slavery in.docx1. The Thirteenth Amendment effectively brought an end to slavery in.docx
1. The Thirteenth Amendment effectively brought an end to slavery in.docx
 
1. The Fight for a True Democracyhttpswww.nytimes.com201.docx
1. The Fight for a True Democracyhttpswww.nytimes.com201.docx1. The Fight for a True Democracyhttpswww.nytimes.com201.docx
1. The Fight for a True Democracyhttpswww.nytimes.com201.docx
 
1. The article for week 8 described hip hop as a weapon. This weeks.docx
1. The article for week 8 described hip hop as a weapon. This weeks.docx1. The article for week 8 described hip hop as a weapon. This weeks.docx
1. The article for week 8 described hip hop as a weapon. This weeks.docx
 
1. The Hatch Act defines prohibited activities of public employees. .docx
1. The Hatch Act defines prohibited activities of public employees. .docx1. The Hatch Act defines prohibited activities of public employees. .docx
1. The Hatch Act defines prohibited activities of public employees. .docx
 
1. The Case for Reparations” by Ta-Nehisi Coates (604-19) in Rere.docx
1. The Case for Reparations” by Ta-Nehisi Coates (604-19) in Rere.docx1. The Case for Reparations” by Ta-Nehisi Coates (604-19) in Rere.docx
1. The Case for Reparations” by Ta-Nehisi Coates (604-19) in Rere.docx
 
1. Some people say that chatbots are inferior for chatting.Others di.docx
1. Some people say that chatbots are inferior for chatting.Others di.docx1. Some people say that chatbots are inferior for chatting.Others di.docx
1. Some people say that chatbots are inferior for chatting.Others di.docx
 
1. Some people say that chatbots are inferior for chatting.Other.docx
1. Some people say that chatbots are inferior for chatting.Other.docx1. Some people say that chatbots are inferior for chatting.Other.docx
1. Some people say that chatbots are inferior for chatting.Other.docx
 
1. Some people say that chatbots are inferior for chatting. Others d.docx
1. Some people say that chatbots are inferior for chatting. Others d.docx1. Some people say that chatbots are inferior for chatting. Others d.docx
1. Some people say that chatbots are inferior for chatting. Others d.docx
 
1. Tell us about yourself and your personal journey that has to .docx
1. Tell us about yourself and your personal journey that has to .docx1. Tell us about yourself and your personal journey that has to .docx
1. Tell us about yourself and your personal journey that has to .docx
 
1. Tell us what characteristics of Loma Linda University are particu.docx
1. Tell us what characteristics of Loma Linda University are particu.docx1. Tell us what characteristics of Loma Linda University are particu.docx
1. Tell us what characteristics of Loma Linda University are particu.docx
 
1. Tell us about yourself and your personal journey that has lea.docx
1. Tell us about yourself and your personal journey that has lea.docx1. Tell us about yourself and your personal journey that has lea.docx
1. Tell us about yourself and your personal journey that has lea.docx
 
1. The Research paper will come in five parts. The instructions are.docx
1. The Research paper will come in five parts. The instructions are.docx1. The Research paper will come in five parts. The instructions are.docx
1. The Research paper will come in five parts. The instructions are.docx
 
1. The minutiae points located on a fingerprint will help determine .docx
1. The minutiae points located on a fingerprint will help determine .docx1. The minutiae points located on a fingerprint will help determine .docx
1. The minutiae points located on a fingerprint will help determine .docx
 
1. The initial post is to be posted first and have 300-500 words.docx
1. The initial post is to be posted first and have 300-500 words.docx1. The initial post is to be posted first and have 300-500 words.docx
1. The initial post is to be posted first and have 300-500 words.docx
 
1. The key elements of supplier measurement are quality, delivery, a.docx
1. The key elements of supplier measurement are quality, delivery, a.docx1. The key elements of supplier measurement are quality, delivery, a.docx
1. The key elements of supplier measurement are quality, delivery, a.docx
 
1. Search the Internet and locate an article that relates to the top.docx
1. Search the Internet and locate an article that relates to the top.docx1. Search the Internet and locate an article that relates to the top.docx
1. Search the Internet and locate an article that relates to the top.docx
 
1. Text mining – Text mining or text data mining is a process to e.docx
1. Text mining – Text mining or text data mining is a process to e.docx1. Text mining – Text mining or text data mining is a process to e.docx
1. Text mining – Text mining or text data mining is a process to e.docx
 
1. Students need to review 3 different social media platforms that a.docx
1. Students need to review 3 different social media platforms that a.docx1. Students need to review 3 different social media platforms that a.docx
1. Students need to review 3 different social media platforms that a.docx
 

Recently uploaded

Organic Name Reactions for the students and aspirants of Chemistry12th.pptx
Organic Name Reactions  for the students and aspirants of Chemistry12th.pptxOrganic Name Reactions  for the students and aspirants of Chemistry12th.pptx
Organic Name Reactions for the students and aspirants of Chemistry12th.pptxVS Mahajan Coaching Centre
 
Proudly South Africa powerpoint Thorisha.pptx
Proudly South Africa powerpoint Thorisha.pptxProudly South Africa powerpoint Thorisha.pptx
Proudly South Africa powerpoint Thorisha.pptxthorishapillay1
 
Enzyme, Pharmaceutical Aids, Miscellaneous Last Part of Chapter no 5th.pdf
Enzyme, Pharmaceutical Aids, Miscellaneous Last Part of Chapter no 5th.pdfEnzyme, Pharmaceutical Aids, Miscellaneous Last Part of Chapter no 5th.pdf
Enzyme, Pharmaceutical Aids, Miscellaneous Last Part of Chapter no 5th.pdfSumit Tiwari
 
Introduction to AI in Higher Education_draft.pptx
Introduction to AI in Higher Education_draft.pptxIntroduction to AI in Higher Education_draft.pptx
Introduction to AI in Higher Education_draft.pptxpboyjonauth
 
Employee wellbeing at the workplace.pptx
Employee wellbeing at the workplace.pptxEmployee wellbeing at the workplace.pptx
Employee wellbeing at the workplace.pptxNirmalaLoungPoorunde1
 
_Math 4-Q4 Week 5.pptx Steps in Collecting Data
_Math 4-Q4 Week 5.pptx Steps in Collecting Data_Math 4-Q4 Week 5.pptx Steps in Collecting Data
_Math 4-Q4 Week 5.pptx Steps in Collecting DataJhengPantaleon
 
Software Engineering Methodologies (overview)
Software Engineering Methodologies (overview)Software Engineering Methodologies (overview)
Software Engineering Methodologies (overview)eniolaolutunde
 
Incoming and Outgoing Shipments in 1 STEP Using Odoo 17
Incoming and Outgoing Shipments in 1 STEP Using Odoo 17Incoming and Outgoing Shipments in 1 STEP Using Odoo 17
Incoming and Outgoing Shipments in 1 STEP Using Odoo 17Celine George
 
भारत-रोम व्यापार.pptx, Indo-Roman Trade,
भारत-रोम व्यापार.pptx, Indo-Roman Trade,भारत-रोम व्यापार.pptx, Indo-Roman Trade,
भारत-रोम व्यापार.pptx, Indo-Roman Trade,Virag Sontakke
 
How to Make a Pirate ship Primary Education.pptx
How to Make a Pirate ship Primary Education.pptxHow to Make a Pirate ship Primary Education.pptx
How to Make a Pirate ship Primary Education.pptxmanuelaromero2013
 
CARE OF CHILD IN INCUBATOR..........pptx
CARE OF CHILD IN INCUBATOR..........pptxCARE OF CHILD IN INCUBATOR..........pptx
CARE OF CHILD IN INCUBATOR..........pptxGaneshChakor2
 
Mastering the Unannounced Regulatory Inspection
Mastering the Unannounced Regulatory InspectionMastering the Unannounced Regulatory Inspection
Mastering the Unannounced Regulatory InspectionSafetyChain Software
 
Introduction to ArtificiaI Intelligence in Higher Education
Introduction to ArtificiaI Intelligence in Higher EducationIntroduction to ArtificiaI Intelligence in Higher Education
Introduction to ArtificiaI Intelligence in Higher Educationpboyjonauth
 
A Critique of the Proposed National Education Policy Reform
A Critique of the Proposed National Education Policy ReformA Critique of the Proposed National Education Policy Reform
A Critique of the Proposed National Education Policy ReformChameera Dedduwage
 
call girls in Kamla Market (DELHI) 🔝 >༒9953330565🔝 genuine Escort Service 🔝✔️✔️
call girls in Kamla Market (DELHI) 🔝 >༒9953330565🔝 genuine Escort Service 🔝✔️✔️call girls in Kamla Market (DELHI) 🔝 >༒9953330565🔝 genuine Escort Service 🔝✔️✔️
call girls in Kamla Market (DELHI) 🔝 >༒9953330565🔝 genuine Escort Service 🔝✔️✔️9953056974 Low Rate Call Girls In Saket, Delhi NCR
 
POINT- BIOCHEMISTRY SEM 2 ENZYMES UNIT 5.pptx
POINT- BIOCHEMISTRY SEM 2 ENZYMES UNIT 5.pptxPOINT- BIOCHEMISTRY SEM 2 ENZYMES UNIT 5.pptx
POINT- BIOCHEMISTRY SEM 2 ENZYMES UNIT 5.pptxSayali Powar
 
BASLIQ CURRENT LOOKBOOK LOOKBOOK(1) (1).pdf
BASLIQ CURRENT LOOKBOOK  LOOKBOOK(1) (1).pdfBASLIQ CURRENT LOOKBOOK  LOOKBOOK(1) (1).pdf
BASLIQ CURRENT LOOKBOOK LOOKBOOK(1) (1).pdfSoniaTolstoy
 

Recently uploaded (20)

9953330565 Low Rate Call Girls In Rohini Delhi NCR
9953330565 Low Rate Call Girls In Rohini  Delhi NCR9953330565 Low Rate Call Girls In Rohini  Delhi NCR
9953330565 Low Rate Call Girls In Rohini Delhi NCR
 
Organic Name Reactions for the students and aspirants of Chemistry12th.pptx
Organic Name Reactions  for the students and aspirants of Chemistry12th.pptxOrganic Name Reactions  for the students and aspirants of Chemistry12th.pptx
Organic Name Reactions for the students and aspirants of Chemistry12th.pptx
 
Proudly South Africa powerpoint Thorisha.pptx
Proudly South Africa powerpoint Thorisha.pptxProudly South Africa powerpoint Thorisha.pptx
Proudly South Africa powerpoint Thorisha.pptx
 
Enzyme, Pharmaceutical Aids, Miscellaneous Last Part of Chapter no 5th.pdf
Enzyme, Pharmaceutical Aids, Miscellaneous Last Part of Chapter no 5th.pdfEnzyme, Pharmaceutical Aids, Miscellaneous Last Part of Chapter no 5th.pdf
Enzyme, Pharmaceutical Aids, Miscellaneous Last Part of Chapter no 5th.pdf
 
Introduction to AI in Higher Education_draft.pptx
Introduction to AI in Higher Education_draft.pptxIntroduction to AI in Higher Education_draft.pptx
Introduction to AI in Higher Education_draft.pptx
 
Employee wellbeing at the workplace.pptx
Employee wellbeing at the workplace.pptxEmployee wellbeing at the workplace.pptx
Employee wellbeing at the workplace.pptx
 
_Math 4-Q4 Week 5.pptx Steps in Collecting Data
_Math 4-Q4 Week 5.pptx Steps in Collecting Data_Math 4-Q4 Week 5.pptx Steps in Collecting Data
_Math 4-Q4 Week 5.pptx Steps in Collecting Data
 
Software Engineering Methodologies (overview)
Software Engineering Methodologies (overview)Software Engineering Methodologies (overview)
Software Engineering Methodologies (overview)
 
Incoming and Outgoing Shipments in 1 STEP Using Odoo 17
Incoming and Outgoing Shipments in 1 STEP Using Odoo 17Incoming and Outgoing Shipments in 1 STEP Using Odoo 17
Incoming and Outgoing Shipments in 1 STEP Using Odoo 17
 
भारत-रोम व्यापार.pptx, Indo-Roman Trade,
भारत-रोम व्यापार.pptx, Indo-Roman Trade,भारत-रोम व्यापार.pptx, Indo-Roman Trade,
भारत-रोम व्यापार.pptx, Indo-Roman Trade,
 
How to Make a Pirate ship Primary Education.pptx
How to Make a Pirate ship Primary Education.pptxHow to Make a Pirate ship Primary Education.pptx
How to Make a Pirate ship Primary Education.pptx
 
CARE OF CHILD IN INCUBATOR..........pptx
CARE OF CHILD IN INCUBATOR..........pptxCARE OF CHILD IN INCUBATOR..........pptx
CARE OF CHILD IN INCUBATOR..........pptx
 
Mastering the Unannounced Regulatory Inspection
Mastering the Unannounced Regulatory InspectionMastering the Unannounced Regulatory Inspection
Mastering the Unannounced Regulatory Inspection
 
Introduction to ArtificiaI Intelligence in Higher Education
Introduction to ArtificiaI Intelligence in Higher EducationIntroduction to ArtificiaI Intelligence in Higher Education
Introduction to ArtificiaI Intelligence in Higher Education
 
A Critique of the Proposed National Education Policy Reform
A Critique of the Proposed National Education Policy ReformA Critique of the Proposed National Education Policy Reform
A Critique of the Proposed National Education Policy Reform
 
call girls in Kamla Market (DELHI) 🔝 >༒9953330565🔝 genuine Escort Service 🔝✔️✔️
call girls in Kamla Market (DELHI) 🔝 >༒9953330565🔝 genuine Escort Service 🔝✔️✔️call girls in Kamla Market (DELHI) 🔝 >༒9953330565🔝 genuine Escort Service 🔝✔️✔️
call girls in Kamla Market (DELHI) 🔝 >༒9953330565🔝 genuine Escort Service 🔝✔️✔️
 
Model Call Girl in Tilak Nagar Delhi reach out to us at 🔝9953056974🔝
Model Call Girl in Tilak Nagar Delhi reach out to us at 🔝9953056974🔝Model Call Girl in Tilak Nagar Delhi reach out to us at 🔝9953056974🔝
Model Call Girl in Tilak Nagar Delhi reach out to us at 🔝9953056974🔝
 
POINT- BIOCHEMISTRY SEM 2 ENZYMES UNIT 5.pptx
POINT- BIOCHEMISTRY SEM 2 ENZYMES UNIT 5.pptxPOINT- BIOCHEMISTRY SEM 2 ENZYMES UNIT 5.pptx
POINT- BIOCHEMISTRY SEM 2 ENZYMES UNIT 5.pptx
 
BASLIQ CURRENT LOOKBOOK LOOKBOOK(1) (1).pdf
BASLIQ CURRENT LOOKBOOK  LOOKBOOK(1) (1).pdfBASLIQ CURRENT LOOKBOOK  LOOKBOOK(1) (1).pdf
BASLIQ CURRENT LOOKBOOK LOOKBOOK(1) (1).pdf
 
Model Call Girl in Bikash Puri Delhi reach out to us at 🔝9953056974🔝
Model Call Girl in Bikash Puri  Delhi reach out to us at 🔝9953056974🔝Model Call Girl in Bikash Puri  Delhi reach out to us at 🔝9953056974🔝
Model Call Girl in Bikash Puri Delhi reach out to us at 🔝9953056974🔝
 

Presenting Statistical Results for Decision MakingAt any enterpr.docx

  • 1. Presenting Statistical Results for Decision Making At any enterprise, statistical results can point the way to better decisions. This is especially true in health care, where trends or changes in patient care or results can have powerful effects on health care organizations — clinical effects, and financial effects. Knowing the facts about trends and changes is crucial to navigating them, which means that in many ways, statistical results are powerful tools. But they’re less powerful if nobody understands them. More often than not, stakeholders in health care organizations are not well versed in statistics or data analysis. Especially for these stakeholders, it’s critical to make careful choices about which numbers to include — and how to talk about those numbers. Doing so helps you to present statistical results in a way that’s understandable and actionable even for those with less data literacy. In this activity, you’ll have an opportunity to analyze a health trend at a large urban hospital, and to decide which results of the analysis are most important to communicate to the stakeholders concerned with it.St. Anthony Medical CenterYour Office You are an analyst in the Quality Assurance department at St. Anthony Medical Center, a large hospital in Minneapolis, Minnesota. You have an email from David Brooks, the manager of Quality Assurance, in which he explains your next assignment. EMAIL FROM DAVID BOOKS- QA MANAGER Hello! So I’m aware that you’re relatively new around here, but I’ve got to pull you in on an important project. Here’s the short version, and I can answer questions later if this isn’t enough background. Since you’re in health care, you must know that hospital- acquired conditions (HACs) are a big deal. Hospitals are
  • 2. designed from the ground up to minimize them, but the fact is that hospitals always have a lot of bugs floating around and that means they’re a constant danger. And while we try to minimize mistakes, health care professionals are human, and sometimes mistakes cause real problems. The hospital’s board is getting worked up about them again, because we’ve had some high-profile cases where a patient went home and had to be readmitted because of a mistake or an infection they picked up while they were here. They’re worried about PR, of course, but they’re worried about patient outcomes, and — of course — financial reimbursement and penalties, too. What I need you to do is start working on a presentation about HACs here, specifically as they relate to staffing levels and skill mix. That presentation should explain our recommendations to the board. You’ll want to include some statistics to bolster our case, so take a look at the AHRQ National Scorecard on Hospital-Acquired Conditions and the CMS Hospital-Acquired Conditions Reduction Program. Look at published research about the relationship between HACs and staffing levels, too. Let’s get this right; this is our chance to get the board to understand that HACs will go down if they do what we recommend. Go talk to Rick Susskind first; he’s our senior data analyst and he’s already been working on this. He has completed a data analysis on this, and he can explain what the variables are. You’ll have to talk to a few other people too, to get everything you need. David NEXT EMAIL FROM RICK SUSSKIND- Senior Data Anlayst i! I got your message about the HAC question. I’ve attached a spreadsheet of the data analysis we’ve got on that. Here are a few variables that might be unclear: HAC_Rate: That’s the number of HACs per 1,000 discharges. You could say it’s the measure for the extent of hospital errors.
  • 3. Nursing_HPPD: That’s the number of nursing staff hours per patient day. It’s the hospital’s nurse staffing level. Skill_Mix: That’s obviously about skill mix, but specifically, it’s the percentage of nursing staff hours that are provided by registered nurses, as opposed to other professionals. ALOS: That stands for average length of stay; it’s the number of inpatient days per hospital discharge. It’s a measure of how efficient the hospital is. Let me know if you have other questions! Oh, you’ll need to find out how many discharges we have per year. I don’t know that, but Troy Holland, our vice president of patient services, will know. ATTACHMENT: HAC analysis STAKEHOLDER CONVERSATIONS: TROY HOLLAND- Vice President of Patient Services It’s nice to meet you! Yep, I’ve got those discharge stats. I’m assuming you’re confining your analysis to the last full year? If so, the number of discharges for last year was 10,000. That includes both adult and pediatric discharges. What I don’t have is information about nurse staffing or costs. For those, you’ll want to talk to Jackie, the chief nursing officer. JACKIE SANDOVAL- Chief Nursing Officer Hello. I understand you need some data about our staff costs related to nursing. I’ve got three numbers for you. Our cost per nurse is $72,000. Now, that’s an average of nurses and registered nurses. Our cost per registered nurse is $85,000. Per licensed practical nurse, it’s $52,000. Those numbers include salary, benefits, and overhead. You had asked about some other costs, but I don’t have those. You’ll want to talk to the CFO, Owen Welch. Owen Welch- Chief Financial Officer Hey, I’ve only got a couple of minutes but here’s what you asked about: Our cost per inpatient day is $2,600, and the penalty per HAC is $5,700.
  • 4. Follow- Up Email from David Brooks HACs From: David Brooks To: Samantha Billig Thanks for doing all that running around. Now that you’ve got the data analysis you need, I’d like you to do some thinking about what results you’re going to include in the presentation. Remember, it’s the board, not a bunch of number geeks. You’ll want to give them the statistical results they need to make a decision, not just every bit of data we have. Write down a list of numbers you’re thinking about including in your presentation. We really need to make a data-driven recommendation to the board, and I’d really appreciate your expertise. Thanks! Reply January 2019 AHRQ National Scorecard on Hospital-Acquired Conditions Updated Baseline Rates and Preliminary Results 2014–2017 Summary Updated and new patient safety data for 2014 through 2017 continue to show a downward trend in the annual number of hospital-acquired conditions (HACs). As reported in 2016, from 2010 through 2014, the rate of HACs decreased 17 percent. New and updated data for 2014 to
  • 5. 2016 show an 11 percent decrease. When preliminary data for 2017 are included, the decrease in HACs from 2014 to 2017 is 13 percent. From 2010 through preliminary 2017 data, the average annual reduction in the overall rate of HACs was approximately 4.5 percent. For the trend beginning in 2014, methods were updated and a larger portion of hospital inpatients were included in the HAC calculations. The 2014 rate started at 99 HACs per 1,000 hospital discharges and is estimated at 86 HACs per 1,000 discharges for 2017. In the method previously used, the 2010 rate was calculated as 145 HACs per 1,000 discharges and the 2014 rate was 121 HACs per 1,000 discharges. Both methods use the same 28 measures of patient safety events, including many types of hospital-acquired infections, adverse drug events, and injuries due to procedures, as well as pressure ulcers/pressure injuries and falls. The newly established baseline of 99 HACs per 1,000 discharges in 2014 equates to approximately 2,940,000 HACs among all hospital inpatients 18 years old and over. The updated rate for 2017 equates to approximately 2,550,000 HACs. The final 2017 HAC rate will be updated and recalculated in the future to take into account changes seen in seven of the HAC measures that use ICD-101 data—these data will not be available until late 2019. However, these measures are responsible for only 8 to 10 percent of the annual HACs measured for 2014–2017, so the final calculations are unlikely to make meaningful changes to the data.
  • 6. Based on the HAC reductions seen in 2015, 2016, and 2017 compared with 2014, AHRQ estimates a total of 910,000 fewer HACs occurred than if the 2014 rates had persisted through 2017. These HAC reductions lead to estimates of approximately $7.7 billion in costs saved and approximately 20,500 HAC-related inpatient deaths averted from 2015 through 2017. Data reported in 2016 estimated that from 2011 through 2014, HAC reductions totaled 2.1 million, and these reductions resulted in approximately $19.9 billion in cost savings and 87,000 fewer HAC-related inpatient deaths.2 In the new and updated data for 2014–2017, not all types of HACs showed similar trends. For example, measured adverse drug events continued to drop from 2014 to 2017, while measured pressure ulcers/pressure injuries increased from 2014 to 2015 and then decreased somewhat from 2015 to 2016 and 2017. A similar trend was seen for physician- diagnosed catheter-associated urinary tract infections. 1 ICD-10 = International Classification of Diseases, 10th Revision. The ninth revision is referred to as ICD-9. 2 See the AHRQ HAC report at https://www.ahrq.gov/professionals/quality-patient- safety/pfp/2014-final.html. https://www.ahrq.gov/professionals/quality-patient- safety/pfp/2014-final.html
  • 7. AHRQ National Scorecard on Hospital-Acquired Conditions 2 Of special interest may be the apparent reduction in the rate of antibiotic-associated Clostridioides difficile3 infections. Comparing these data with other sources of information, such as the Centers for Disease Control and Prevention (CDC) and the AHRQ Healthcare Cost and Utilization Project (HCUP), may help us determine if efforts to reduce the occurrence of this important HAC are effective at the national level. The new baseline of 99 HACs per 1,000 discharges was established and calculated for 2014 to monitor the progress of the Department of Health and Human Services (HHS) goal to reduce HACs by 20 percent from 2014 to 2019. This goal is specifically tied to the Centers for Medicare & Medicaid Services’ Hospital Improvement Innovation Networks, which work collaboratively with Federal and private partners to achieve this bold aim and build on prior successes. AHRQ estimates that if the 20 percent HAC reduction goal were achieved, the HAC rate in 2019 would be 79 per 1,000 discharges. That means approximately 1.8 million fewer HACs would occur compared with the number that would have occurred if HAC rates for 2015 through 2019 had stayed the same as in 2014. If a 20 percent reduction were to occur in each type of HAC measured, AHRQ projects that these 1.8 million fewer HACs would be associated with $19.2 billion in cost savings and 53,000 fewer deaths from 2015 through 2019.
  • 8. The results reported above through preliminary 2017 data are not inconsistent with achieving the 20 percent HAC reduction goal for 2019. Detailed Results The new 2014 baseline for the national HAC rate (NHR) is 99 HACs per 1,000 discharges. Exhibit 1 shows the details. Clostridioides difficile Infections is italicized because it was added as a “focus” HAC for reduction efforts and tracking for 2014 through 2019. Clostridioides difficile infections were previously tracked in the “All Other HACs” measure, a collection of 13 other types of HACs. Methods used to calculate the NHR are provided in Appendix 1, and all the measures used in the NHR are shown in Appendix 2, Exhibit A2c. Exhibit 1. New 2014 national HAC rate baseline (rounded), updated January 2019 Hospital-Acquired Condition 2014 Measured Baseline for HACs 2014 Total HACs per 1,000 Discharges Adverse Drug Events 1,001,000 33.7 Catheter-Associated Urinary Tract Infections 170,000 5.7 Central Line-Associated Bloodstream
  • 9. Infections 8500 0.3 Clostridioides difficile Infections 86,000 2.9 Falls 239,000 8.0 Obstetric Adverse Events 67,000 2.3 Pressure Ulcers/Pressure Injuries 647,000 21.8 Surgical Site Infections 73,000 2.5 3 Clostridium difficile has been changed to Clostridioides difficile. More information is available at https://www.ncbi.nlm.nih.gov/pubmed/27370902 and https://www.cdc.gov/hai/organisms/cdiff/cdiff_infect.html https://www.ncbi.nlm.nih.gov/pubmed/27370902 https://www.cdc.gov/hai/organisms/cdiff/cdiff_infect.html AHRQ National Scorecard on Hospital-Acquired Conditions 3 Hospital-Acquired Condition 2014 Measured Baseline for HACs 2014 Total HACs per 1,000 Discharges Ventilator-Associated Pneumonias 36,000 1.2 (Post-op) Venous Thromboembolisms 25,000 0.9 All Other HACs 584,000 19.6 Total 2,940,000 99
  • 10. The new baseline established with the 2014 data was developed using a new method that was based on the method previously used to calculate the 2010-2014 NHR.4 The major difference between the new method and the previous method is that the new method includes patient charts for most conditions treated in acute care hospitals. Previously, the Medicare Patient Safety Monitoring System (MPSMS) used patient charts from only four groups of patients. Three were represented by the principal diagnosis (acute myocardial infarction [AMI], congestive heart failure [CHF], and pneumonia [PN]). The other comprised major surgery patients, as described by the Surgical Care Improvement Project [SCIP]). These groups were used to calculate the 2010–2014 NHR. With the new method, charts for conditions other than AMI, CHF, PN, and SCIP were sampled as a single group, starting with 2014, thus producing five sets of inpatient charts. The 2015 rate is 92 HACs per 1,000 discharges, and 2016 and preliminary 2017 rates are 88 and 86 HACs per 1,000 discharges, respectively (Exhibit 2). Also shown is the goal for 2019, 79 HACs per 1,000 discharges, which is a 20 percent reduction from the 2014 baseline NHR of 99. Detailed information on the number of HACs from 2015 to 2017 (preliminary) is shown in Appendix 2, Exhibit A2c. Appendix A2e shows how the current NHR, which starts in 2014 and will be tracked at least through 2019, compares with the NHR trended for 2010 to 2014. The 2010 to 2014 reduction
  • 11. was 17 percent over 4 years, and the 2014 to 2019 goal is a 20 percent reduction over 5 years. Appendix 3 shows the details of the HAC reductions, cost savings, and inpatient mortality reductions that are projected based on meeting this goal, which total 1.8 million HACs, $19.2 billion, and 53,000 lives. Appendix 4 describes changes in the samples used for the 2014–2017 analyses, compared with the 2010–2014 analyses. 4 See the report at https://www.ahrq.gov/sites/default/files/wysiwyg/professionals/ quality-patient- safety/pfp/pfphac.pdf. https://www.ahrq.gov/sites/default/files/wysiwyg/professionals/ quality-patient-safety/pfp/pfphac.pdf https://www.ahrq.gov/sites/default/files/wysiwyg/professionals/ quality-patient-safety/pfp/pfphac.pdf AHRQ National Scorecard on Hospital-Acquired Conditions 4 Exhibit 2. Re-baselined 2014 data, with 2015, 2016, and preliminary 2017 national HAC rate data, and 2019 HAC goal Exhibit 3 provides the same information as Exhibit 2, but in table form that provides more details on the combined results to date, based on 2015 and 2016 data and preliminary data for 2017, compared with the 2014 baseline.
  • 12. AHRQ National Scorecard on Hospital-Acquired Conditions 5 Exhibit 3. Re-baselined 2014 data, with 2015, 2016, and preliminary 2017 national HAC rate data, and percent change through preliminary 2017data Hospital-Acquired Condition 2014 Measured Baseline for HACs 2015 Normalized Count of HACs 2016 Normalized Count of HACs Preliminary 2017 Normalized Count of HACs
  • 13. Percent Change in HACs, 2014 vs. Preliminary 2017 2019 Goal (20% Reduction of each HAC) Adverse Drug Events 33.7 30.0 27.1 24.2 -28% 26.9 Catheter- Associated Urinary Tract Infections 5.7 6.4 5.7 5.4 -5% 4.6 Central Line- Associated Bloodstream Infections 0.29 0.07 0.22 0.27 -6% 0.23 Clostridioides difficile Infections
  • 14. 2.9 2.6 2.5 1.8 -37% 2.3 Falls 8.0 7.6 7.5 7.6 -5% 6.4 Obstetric Adverse Events 2.3 2.2 2.2 2.2 -5% 1.8 Pressure Ulcers/ Pressure Injuries 21.7 23.5 22.7 23.0 6% 17.4 Surgical Site Infections 2.5 2.5 2.5 2.5 0% 2.0 Ventilator- Associated Pneumonias 1.2 0.9 0.9 1.0 -13% 1.0 (Post-op) Venous Thromboembolisms 0.9 0.4 0.7 0.7 -17% 0.7 All Other HACs 19.6 16.1 15.8 17.2 -12% 15.7 Totals (rounded) 99 92 88 86 -13% 79 With the overall HAC reductions described above, and based on new per-HAC cost and mortality estimates updated in 2017 (see Appendix 5), we
  • 15. project that over 2015–2017, there were approximately $7.7 billion in cost savings and 20,500 fewer deaths associated with HACs. These projections are tabulated in Exhibit 4. In 2017, AHRQ released a special report on costs and inpatient mortality due to HACs.5 Appendix 5 shows the summary cost and mortality associated with each of the 10 focus HAC types, and the full report from which this table is excerpted is available on the AHRQ website.5 The cost and mortality for “all other HACs” was not estimated in this report and was estimated based on a weighted average of the 10 focus HACs, with the weighting based on the proportion of each of the 10 focus HACs in the 2014 baseline data. 5 This report is available at https://www.ahrq.gov/sites/default/files/wysiwyg/professionals/ quality-patient- safety/pfp/hac-cost-report2017.pdf. https://www.ahrq.gov/sites/default/files/wysiwyg/professionals/ quality-patient-safety/pfp/hac-cost-report2017.pdf https://www.ahrq.gov/sites/default/files/wysiwyg/professionals/ quality-patient-safety/pfp/hac-cost-report2017.pdf AHRQ National Scorecard on Hospital-Acquired Conditions 6 Exhibit 4. Projected cost savings and deaths averted due to HAC changes to date from 2015 through preliminary 2017 data, compared with 2014 baseline
  • 16. Total Change in HACs, 2015, 2016, and Preliminary 2017 Data Compared With 2014 Estimate of Total Change in HAC- Related Costs Estimate of Total Change in HAC-Related Deaths Adverse Drug Events -585,000 -$3,360,000,000 -7,000 Catheter-Associated Urinary Tract Infections 12,000 $170,000,000 400 Central Line-Associated Bloodstream Infections -9,000 -$420,000,000 -1,300 Clostridioides difficile Infections -54,000 -$920,000,000 -2,400 Falls -43,000 -$290,000,000 -2,100 Obstetric Adverse Events -9,000 -$10,000,000 -100 Pressure Ulcers/Pressure Injuries
  • 17. 119,000 $1,720,000,000 4,900 Surgical Site Infections 0 $0 0 Ventilator-Associated Pneumonias -23,000 -$1,100,000,000 -3,300 Venous Thromboembolisms -22,000 -$390,000,000 -1,000 All Other HACs (not including Clostridioides difficile Infections) -293,000 -$3,130,000,000 -8,700 Totals From Annual Changes in HACs, HAC-Related Costs, and Deaths -910,000 -$7,730,000,000 -20,500 Note: Totals are rounded and thus may not reflect the total obtained by adding the individual cells. Detailed Goals for 2019 Achieving the goal of a 20 percent reduction in HACs (going from 99 to 79 HACs per 1,000 discharges; see Exhibit 3) would result in approximately 1.8 million fewer HACs in the years from 2015 to 2019. With constant annual reductions toward a 20 percent reduction across all measured HACs, and based on the new per-HAC estimates for costs and mortality from the 2017 study funded by AHRQ (see Appendix 5), our projections indicate approximately $19.2 billion in cost
  • 18. savings for the 5 years and 53,000 HAC-related deaths averted. These data are tabulated in Appendix 3. Data reported in late 2016 estimated that for the 4 years from 2011 through 2014, HAC reductions totaled 2.1 million compared with 2010 baseline data. These reductions resulted in approximately $19.9 billion in cost savings and 87,000 fewer HAC-related inpatient deaths.6 6 See report at https://www.ahrq.gov/professionals/quality- patient-safety/pfp/2014-final.html. https://www.ahrq.gov/professionals/quality-patient- safety/pfp/2014-final.html AHRQ National Scorecard on Hospital-Acquired Conditions 7 Looking Ahead In spite of the volume and velocity of data flowing into and through healthcare, providers, health system leaders, and other stakeholders lack sufficient information to guide their efforts as they work to prevent HACs. Similarly, patients’ choices often occur without the robust information they need, and this limitation constrains their efforts to be engaged in their own care. In addition, numerous other unmet needs must be addressed to continue preventing HACs and sustain the improvements documented in this report. In
  • 19. particular, we must continue to advance patient safety measurement, expand the evidence base for patient safety improvement strategies, and create resources to help providers and the healthcare workforce improve patient safety at the point of care. For example, it is critically important that we continue to drive innovation that efficiently harnesses the full potential of data and measurement. AHRQ’s patient safety measurement projects, including QSRS, are making progress by moving information closer to points of care where it can support providers and the safer care that all stakeholders want to achieve. A powerful foundation of knowledge about how to improve patient safety has been established over more than two decades of AHRQ-funded research and implementation projects, and, if we want to use this knowledge to address persistent patient safety challenges, it is crucial to pair it with capabilities that help clinicians and other healthcare workers reliably measure patient safety threats. When providers trust information they receive about patient safety, they are in better positions to understand these ongoing problems and to effectively prioritize and target them with safer practices. QSRS is being developed in part to serve this purpose by providing information that clinicians and other healthcare workers will trust and use to improve safety. AHRQ and other HHS agencies recognize that improving the safety and quality of healthcare is the ultimate purpose of measurement systems, and the ability to
  • 20. support this improvement effectively and efficiently is a desirable characteristic of these systems. AHRQ and CMS are using the MPSMS as the primary system to measure the NHR, but AHRQ has been working with CMS and other Federal partners, contractors, and other experts to develop the Quality and Safety Review System (QSRS), an improved system to succeed MPSMS. The QSRS has been developed and is undergoing use in the Clinical Data Abstraction Center, pilot testing at non-Federal settings,7 and refinement pursuant to the goal of supporting safe, high-quality care. QSRS has been designed as a robust measurement platform that will serve the shared needs of different healthcare stakeholders. 7 See https://www.ahrq.gov/professionals/quality-patient- safety/qsrs/index.html and https://www.ahrq.gov/sites/ default/files/wysiwyg/research/findings/factsheets/translating/ac tion3/actioniii-2016-summaries.pdf. https://www.ahrq.gov/professionals/quality-patient- safety/qsrs/index.html https://www.ahrq.gov/sites/default/files/wysiwyg/research/findi ngs/factsheets/translating/action3/actioniii-2016-summaries.pdf https://www.ahrq.gov/sites/default/files/wysiwyg/research/findi ngs/factsheets/translating/action3/actioniii-2016-summaries.pdf https://www.psoppc.org/psoppc_web/publicpages/surveillanceco mmonformats https://www.ncbi.nlm.nih.gov/pubmed/28671914 http://www.pso.ahrq.gov/common/development
  • 21. AHRQ National Scorecard on Hospital-Acquired Conditions 8 QSRS is designed to provide up-to-date national HAC rates, including rates of some additional types of HACs not currently measured with MPSMS, the AHRQ Patient Safety Indicators (PSIs), the Centers for Disease Control and Prevention National Healthcare Safety Network (NHSN), or other sources of information concerning patient safety in hospitals. It has been developed so that non-Federal entities, including hospitals and healthcare systems, will be able use it to measure patient safety. QSRS will allow assessment of safety for new patient populations not currently captured by MPSMS, which was originally designed to focus on adverse events experienced by Medicare patients. In addition, QSRS will allow organizations to consider aligning their local patient safety measurements with the same methods and measures used at the national level. Standard methods for measurement, such as those in QSRS, have been a valuable component of other healthcare improvement initiatives, including some that have addressed more specific safety challenges. The AHRQ Common Formats for Surveillance8 serve as the underlying content that provides the foundation of QSRS measures and cover a broad range of common and uncommon threats to patient safety. Development and revision of the Common Formats for Surveillance and QSRS are ongoing processes that include structured review and public
  • 22. feedback facilitated by the National Quality Forum. After release of QSRS, AHRQ will rely on feedback, especially from users, to inform the development of new versions of the Common Formats for Surveillance and for QSRS. This process will enable the Common Formats and QSRS to keep pace with users’ needs and the emerging scientific evidence base for patient safety and quality improvement. Some data needed for patient safety measurement may be increasingly available from electronic health records. AHRQ continues to explore the feasibility of automated approaches to data abstraction9 in order to further improve efficiency and reduce burden while maintaining the validity of QSRS and enhancing its ease of use. These include the AHRQ Common Formats for Surveillance, a subset of the AHRQ Common Formats.10 8 More information is available at https://www.psoppc.org/psoppc_web/publicpages/surveillanceco mmonformats. 9 See publication in the Journal of Patient Safety online at: https://www.ncbi.nlm.nih.gov/pubmed/28671914. A new study and report is currently in preparation and is expected to be complete later this year. 10 More information is available at www.pso.ahrq.gov/common/development. AHRQ National Scorecard on Hospital-Acquired Conditions 9
  • 23. Appendix 1. Method To Estimate the Baseline 2014 National Hospital- Acquired Condition Rate This document describes the methods AHRQ has developed to estimate the national rate of HACs for 2014 to 2019, which has a goal of a 20 percent reduction in HACs. The estimate includes a wide variety of adverse events, including the 10 HACs selected for special focus by CMS as part of the programs to achieve the 20 percent reduction, as well as several other HACs. Collectively, 28 specific measures are used (Exhibit A1a): 15 measures to generate rates for the 10 specific focus HACs and 13 measures to generate a summary rate for “all other” HACs. Of the 28 measures, 21 are from the MPSMS, 6 are from the PSIs, and 1 is based on NHSN data. Exhibit A1a. Measures used to estimate the national HAC rate HAC Type Source Measure Adverse Drug Event MPSMS ADE Associated With Digoxin MPSMS ADE Associated With Hypoglycemic Agents MPSMS ADE Associated With IV Heparin MPSMS ADE Associated With LMWH and Factor Xa Inhibitor MPSMS ADE Associated With Warfarin CAUTI MPSMS Catheter-Associated Urinary Tract Infections CDI MPSMS Clostridioides difficile Infections CLABSI MPSMS Blood Stream Infections Associated With Central Venous Catheters Falls MPSMS In-Hospital Patient Falls
  • 24. Obstetric Adverse Events PSI OB Trauma in Vaginal Delivery (PSI 19) With (PSI 18) and Without Instrument Pressure Ulcer MPSMS Hospital-Acquired Pressure Ulcers/Pressure Injuries Surgical Site Infection NHSN SSIs for 17 procedures w/CDC SCIP+5 data VAP MPSMS Ventilator-Associated Pneumonia VTE MPSMS Postoperative Venous Thromboembolic Events All Other Hospital- Acquired Conditions MPSMS Femoral Artery Puncture for Catheter Angiographic Procedures MPSMS Adverse Event Associated With Hip Joint Replacements MPSMS Adverse Event Associated With Knee Joint Replacements MPSMS Contrast Nephropathy Associated With Catheter Angiography MPSMS Hospital-Acquired MRSA MPSMS Hospital-Acquired Vancomycin-Resistant Enterococcus (VRE) MPSMS Mechanical Complications Associated With Central Venous Catheters
  • 25. MPSMS Postoperative Cardiac Events for Cardiac and Noncardiac Surgeries MPSMS Postoperative Pneumonia PSI Iatrogenic Pneumothorax (PSI 6) PSI Post-Op Hemorrhage or Hematoma (PSI 9) PSI Post-Op Respiratory Failure (PSI 11) PSI Accidental Puncture or Laceration (PSI 15) AHRQ National Scorecard on Hospital-Acquired Conditions 10 Data from these 28 measures are combined to generate a summary national HAC rate (NHR) that has been calculated annually since 2010.4 The current method is built on the 2010–2014 methods but includes some changes. The current method removes the use of reference data from 2005– 2006 and includes a fifth set or sample of charts to augment the four samples used in the 2010– 2014 method. In the 2010–2014 method, Clostridioides difficile Infection data were included in “All Other HACs” rather than as a focus HAC, which is the case with the new method. As before, the new method uses HCUP data on the annual number of hospital inpatient discharges as the denominator for the rate calculations. The details of how the current NHR is calculated are summarized below. 1. The NHR is calculated using the following variables: a. Rate of 21 MPSMS adverse events in the MPSMS sample provided by CMS,
  • 26. including those in the SCIP (major surgery) sample, those with a principal diagnosis of AMI, CHF, or pneumonia, and a “global” sample intended to complement these four groups of patients. The sample is limited to patients 18 years old and over. For the NHR calculation, the rates of the 21 MPSMS adverse events are expressed as a rate for the whole sample population, rather than as a rate for the subpopulation that has the opportunity to experience the adverse event. For example, the CLABSI rate, like all rates in the sample, uses all patients in the denominator, not just the patients who had a central line inserted during their hospital stay. For each of the 21 MPSMS HACs, the estimate is a weighted average of the HAC rate for each group, where each group is given a weight that approximates the fraction of patients the group represents in the hospital discharge population age 18 and over. This approach ensures that the estimated rate will not be affected by variation across years in the percentage of patients in the samples of charts representing each of the five groups (SCIP, AMI, CHF, pneumonia, and global). It also uses the data from each sample in a way that best represents the conditions treated in the actual hospital inpatient population. The weights follow, based on their percentage11 of the inpatient population:
  • 27. • AMI: 2.15%, • CHF: 3.24%, • Pneumonia: 4.41%, • SCIP plus 5 other major surgeries: 19.17%, • Global: 71.03%. 11 These weights (percentages) are slightly different than in the report released in June 2018 (see https://www.ahrq.gov/sites/default/files/wysiwyg/professionals/ quality-patient-safety/pfp/natlhacratereport- rebaselining2014-2016_0.pdf). The change in weights to incorporate newer information is the reason that the HAC rate calculated in the June 2018 report for 2014 was 98 HACs per 1,000 discharges, while the rate for 2014 in this report is 99. https://www.ahrq.gov/sites/default/files/wysiwyg/professionals/ quality-patient-safety/pfp/natlhacratereport-rebaselining2014- 2016_0.pdf https://www.ahrq.gov/sites/default/files/wysiwyg/professionals/ quality-patient-safety/pfp/natlhacratereport-rebaselining2014- 2016_0.pdf AHRQ National Scorecard on Hospital-Acquired Conditions 11 These AMI, CHF, and pneumonia patient data percentages were based on data from 2014 from the AHRQ National Inpatient Sample. The percentage of SCIP+5 patients was calculated based on the number of surgeries in the SCIP+5 sample from CDC, which was 5,704,493 among 29,751,955 discharges in 2014. The weighting for the global sample was 100 percent minus the contribution from the other four samples.
  • 28. b. National number of adverse events captured by PSIs 18 and 19 on obstetric injury and national number of four other PSIs (6, 9, 11, and 15) included among “all other” HACs.12 c. National number of selected surgical site infections computed in a special calculation for CDC. This calculation is based on NHSN data for 17 specific operations: the 12 SCIP operations and 5 other major surgical procedures not included in the SCIP.13 d. To estimate the rate of adverse events for each of the 21 HACs for all patients for which the MPSMS data are used, we follow these steps: • Multiply the adverse event rate for each of the 21 HACs for patients with one of the five conditions included in the 2014–2017 MPSMS samples by the number of hospital inpatients represented by the sample, as calculated by the weight of each sample and the overall total annual national discharges listed above. • Sum the estimates for each of the five samples for each measure to produce an estimate for each of the 21 measures. 2. The estimated total count of annual HACs in the national HAC rate is calculated as the sum of the total number of HACs for the 21 MPSMS HACs in (d) above, plus the
  • 29. estimated number of PSI HACs in (b), plus the number of NHSN-estimated HACs in (c). 3. The national HAC rate is the total HAC count in (2) above divided by the number of annual hospital inpatient discharges of patients at least 18 years old, as provided by HCUP. 4. As of January 2019, this method established for 2014 has been repeated for 2015, 2016, and 2017; we used 2016 data preliminarily for the number of annual hospital discharges in 2017. We aim to compare the estimated total number of HACs for 2015–2019 with the 2014 baseline without having the comparison affected by changes in the total number of discharges. Thus, for each year to date (2015, 2016, and preliminary 2017) we normalized the data to generate national estimates of HACs based on 29,751,955 discharges, which was the total number of discharges in 2014 for inpatients 18 years old and over. This method will be used again to finalize estimates for 2017 and to establish new estimates for 2018, and 2019 as the data become available. 12 Due to the transition from ICD-9 to ICD-10 that occurred with the start of the fourth quarter of 2015 and the effect of this change on the PSI data, only data from the first three quarters of 2015 were used to calculate the number of PSI events for 2015. The number of PSI events for January through September 2015 was multiplied by 4/3 to estimate the number of events (HACs) for the full year of 2015. 13 Due to the ICD-9 to ICD-10 transition that occurred with the start of the fourth quarter of 2015, only data from the first three quarters of 2015 were used to calculate the number of
  • 30. CDC NHSN SSI events for 2015. The CDC estimate provided for 2015 was based on 12 months of data, from October 2014 through September 2015. AHRQ National Scorecard on Hospital-Acquired Conditions 12 5. Due to changes in how some conditions and adverse events are described in ICD-9 and ICD-10, the data for the 7 of 28 measures that depend entirely or partly on administrative data cannot be compared for 2015 and 2016. These measures include the 6 PSI-based measures and the SSI data that constitute about 8 to 10 percent of the overall NHR for 2014 through 2017. To address this situation, we have reused the data from 2015 in the 2016 and 2017 results for these measures. In late 2019, we anticipate receiving new data for 2017 based on ICD-10 data that will enable us to compare the data with the 2016 data we currently have for these measures and to develop a method to continue the trending from 2014 to 2019 for these measures within the overall NHR. The data for 2016 we have received from the AHRQ HCUP team and the CDC NHSN statistician are tabulated below in Exhibit A1b. For the reasons described above, these data are not used in the 2016 NHR computed in this report but are included for completeness. Exhibit A1b. Data from AHRQ HCUP and CDC NHSN on total numbers of HACs associated with each ICD-10-dependent measure for 2016
  • 31. Number of Patients Number of Cases of Included in Sample Measure Name for 2016 Adverse Events for This Measure PSI 6, Iatrogenic Pneumothorax 7,372 18,948,556 PSI 9, Perioperative Hemorrhage or Hematoma 12,285 5,368,607 PSI 11, Postoperative Respiratory Failure 35,971 2,384,676 PSI 15, Unrecognized Abdominopelvic Accidental 32,396 19,811,918 Puncture/Laceration PSI 18, Obstetric Trauma - Vaginal Delivery with 14,663 121,323 Instrument PSI 19, Obstetric Trauma - Vaginal Delivery without 34,066 1,874,410 Instrument Surgical Site Infections (special calculation performed 80,157 5,999,045 (estimate) by CDC NHSN to include SSIs in a consistent set of major surgeries since 2010) These data were not used in this report because they cannot be directly compared with prior years of data. AHRQ National Scorecard on Hospital-Acquired Conditions 13 Appendix 2. 2014–2017 NHR Data Tabulated (HACs and HAC Rate) and Compared With Summary 2010–2014 Data Information on the HACs for 2014, 2015, 2016, and 2017 is provided below. Exhibit A2a shows the calculated number of HACs (rounded), and Exhibit A2b
  • 32. shows the calculated HAC rates per 1,000 discharges. Exhibit A2c shows all the measures, including those used in the calculation of “All Other HACs.” These data have been normalized to account for the changes in annual discharges, i.e., the number of HACs shown in 2015–2017 is based on the number of HACs that would have occurred if the number of hospital discharges in 2015 (30,167,977) and 2016 (30,188,612) were unchanged from that in 2014 (29,751,955). The 2017 data shown are also normalized to 2014, but with 2016 data being used because 2017 hospital discharge data are not yet available. Hospital discharge data are from HCUP, and the exact numbers are based on a special analysis performed for this study to limit hospital discharges to those 18 years old and over. Data for the six PSIs and the SSI data from CDC are also wholly or partially based on HCUP data that depend on ICD-9 (through quarter 3 of 2015) or ICD-10 (beginning with quarter 4 of 2015). Because data based on ICD-9 and ICD-10 cannot be directly compared with each other, we cannot compare the measures for Obstetric Adverse Events and SSIs, as well as four of the PSI measures that contribute to “All Other HACs.” The data for 2017 are not currently available, and 2015 data are used in the preliminary estimates for 2017 as well. When 2017 data are available, we expect to compare 2016–2017 data that are dependent on ICD-10 and to continue that new trend through 2019. At present, we do not expect
  • 33. to be able to develop a method that will enable us to compare the data from ICD-based measures for 2015 with 2016. AHRQ National Scorecard on Hospital-Acquired Conditions 14 Exhibit A2a. HAC count estimates (rounded) Hospital-Acquired Condition 2014 Measured Baseline for HACs 2015 Normalized Count of HACs 2016 Normalized Count of HACs Preliminary 2017 Normalized Count of HACs Change in HACs, 2014 vs.
  • 34. Preliminary 2017 Percent Change in HACs, 2014 vs Preliminary 2017 14 Adverse Drug Events 1,001,000 894,000 805,000 721,000 - 280,000 -28% Catheter-Associated Urinary Tract Infections 170,000 191,000 170,000 161,000 -9,000 -5% Central Line-Associated Bloodstream Infections 8,500 2,200 6,500 8,000 -500 -6% Clostridioides difficile Infections 86,000 77,000 73,000 54,000 -32,000 -37% Falls 239,000 225,000 223,000 227,000 -13,000 -5% Obstetric Adverse Events 67,000 64,000 64,000 64,000 -3,000 - 5% Pressure Ulcers/Pressure Injuries 647,000 700,000 677,000 683,000 36,000 6%
  • 35. Surgical Site Infections 73,000 73,000 73,000 73,000 0 0% Ventilator-Associated Pneumonias 36,000 28,000 26,000 31,000 -5,000 -13% (Post-op) Venous Thromboembolisms 25,000 12,000 20,000 21,000 -4,000 -17% All Other HACs 584,000 479,000 468,000 512,000 -72,000 - 12% Totals 2,940,000 2,740,000 2,610,000 2,550,000 -380,000 -13% 14 Due to use of the unrounded numbers in the calculations of the percent changes, some percent changes shown are different from the change that would result from using the rounded numbers. AHRQ National Scorecard on Hospital-Acquired Conditions 15 Exhibit A2b. HAC rates for 2014, 2015, 2016 and 2017 (preliminary), with 2019 goals Hospital-Acquired Condition 2014 Baseline, Updated 2015, Updated 2016, Updated Preliminary 2017 2019 Goal (20% Reduction) Adverse Drug Events 33.7 30.0 27.1 24.2 26.9 Catheter-Associated Urinary Tract
  • 36. Infections 5.7 6.4 5.7 5.4 4.6 Central Line-Associated Bloodstream Infections 0.29 0.07 0.22 0.27 0.23 Clostridioides difficile Infections 2.9 2.6 2.5 1.8 2.3 Falls 8.0 7.6 7.5 7.6 6.4 Obstetric Adverse Events 2.3 2.2 2.2 2.2 1.8 Pressure Ulcers/Pressure Injuries 21.7 23.5 22.7 23.0 17.4 Surgical Site Infections 2.5 2.5 2.5 2.5 2.0 Ventilator-Associated Pneumonias 1.2 0.9 0.9 1.0 1.0 Venous Thromboembolisms 0.9 0.4 0.7 0.7 0.7 All Other HACs 19.6 16.1 15.7 17.2 15.7 Totals 98.7 92.3 87.6 85.9 79.0 Note: Data in cells may not add to the total due to rounding. AHRQ National Scorecard on Hospital-Acquired Conditions 16 Exhibit A2c. All 2014, 2015, 2016, and 2017 (preliminary) HACs (not rounded) Total 2014 Total 2015 HACs Total 2015 HAC Rate Total 2016
  • 37. HACs Total 2016 HAC Rate Preliminary Total 2017 Preliminary Total 2017 HAC Rate Normalized Normalized Normalized Normalized HACs HAC Rate HAC Type Source Measure Total 2014 HACs per 1,000 Discharges to 2014 Baseline to 2014 Baseline to 2014 Baseline to 2014 Baseline Normalized to 2014 Baseline
  • 38. Normalized to 2014 Baseline Adverse Drug Event MPSMS ADE Associated With Digoxin 6,204 0.21 795 0.03 169 0.01 2,671 0.09 MPSMS ADE Associated With 517,177 17.38 549,638 18.47 471,536 15.85 446,134 15.00 Hypoglycemic Agents MPSMS ADE Associated With IV Heparin 141,711 4.76 81,362 2.73 83,677 2.81 71,713 2.41 MPSMS ADE Associated With LMWH and 247,441 8.32 159,633 5.37 170,041 5.72 146,266 4.92 Factor Xa Inhibitor MPSMS ADE Associated With Warfarin 88,814 2.99 102,338 3.44 79,773 2.68 53,819 1.81
  • 39. MPSMS Total ADE (sum of 5 above) 1,001,348 33.66 893,766 30.04 805,196 27.06 720,604 24.22 CAUTI MPSMS Catheter- Associated 169,961 5.71 190,797 6.41 170,282 5.72 160,833 5.41 Urinary Tract Infections CDI MPSMS Clostridium difficile 85,753 2.88 76,650 2.58 73,114 2.46 53,943 1.81 Infections CLABSI MPSMS Blood Stream Infections 8,493 0.29 2,182 0.07 6,519 0.22 7,991 0.27 Associated With Central Venous Catheters Falls MPSMS In-Hospital Patient Falls 239,286 8.04 225,199 7.57 223,106 7.50 226,642 7.62 Obstetric Adverse
  • 40. Events PSI OB Trauma in Vaginal Delivery With (PSI 18) and Without 67,482 2.27 64,077 2.15 64,033 2.15 64,033 2.15 Instrument (PSI 19) Total 2014 Total 2015 HACs Total 2015 HAC Rate Total 2016 HACs Total 2016 HAC Rate Preliminary Total 2017 Preliminary Total 2017 HAC Rate Normalized Normalized Normalized Normalized HACs HAC Rate
  • 41. HAC Type Source Measure Total 2014 HACs per 1,000 Discharges to 2014 Baseline to 2014 Baseline to 2014 Baseline to 2014 Baseline Normalized to 2014 Baseline Normalized to 2014 Baseline Pressure Ulcer MPSMS Hospital- Acquired Pressure 647,096 21.75 699,790 23.52 676,834 22.75 682,984 22.96 Ulcers/Pressure Injuries
  • 42. Surgical Site Infection NHSN SSIs for 17 procedures w/CDC SCIP+5 data 73,158 2.46 73,212 2.46 73,162 2.46 73,162 2.46 VAP MPSMS Ventilator- Associated 35,894 1.21 27,548 0.93 25,695 0.86 31,213 1.05 Pneumonia VTE MPSMS Postoperative Venous 25,400 0.85 12,307 0.41 20,127 0.68 21,094 0.71 Thromboembolic Events All Other Hospital- Acquired Conditions MPSMS Femoral Artery Puncture for Catheter Angiographic Procedures
  • 43. 22,075 0.74 15,907 0.53 9,118 0.31 15,176 0.51 MPSMS Adverse Event Associated With 48,925 1.64 49,141 1.65 61,670 2.07 49,988 1.68 Hip Joint Replacements MPSMS Adverse Event Associated With 41,639 1.40 40,500 1.36 42,398 1.43 48,518 1.63 Knee Joint Replacements MPSMS Contrast Nephropathy Associated With 128,012 4.30 85,072 2.86 78,686 2.64 97,561 3.28 Catheter Angiography MPSMS Hospital- Acquired MRSA 19,526 0.66 6,840 0.23 3,095 0.10 15,272 0.51 AHRQ National Scorecard on Hospital-Acquired Conditions 17
  • 44. Total 2014 Total 2015 HACs Total 2015 HAC Rate Total 2016 HACs Total 2016 HAC Rate Preliminary Total 2017 Preliminary Total 2017 HAC Rate Normalized Normalized Normalized Normalized HACs HAC Rate HAC Type Source Measure Total 2014 HACs per 1,000 Discharges to 2014 Baseline to 2014 Baseline
  • 45. to 2014 Baseline to 2014 Baseline Normalized to 2014 Baseline Normalized to 2014 Baseline MPSMS Hospital- Acquired Vancomycin- Resistant 15,501 0.52 4,590 0.15 3,934 0.13 2,125 0.07 Enterococcus (VRE) MPSMS Mechanical Complications Associated With 59,610 2.00 53,033 1.78 67,004 2.25 59,924 2.01 Central Venous Catheters MPSMS Postoperative Cardiac Events 32,773 1.10 28,768 0.97 22,103 0.74 45,886 1.54
  • 46. for Cardiac and Noncardiac Surgeries MPSMS Postoperative Pneumonia 88,156 2.96 79,687 2.68 64,621 2.17 62,233 2.09 PSI Iatrogenic Pneumothorax 10,674 0.36 9,694 0.33 9,688 0.33 9,688 0.33 (PSI 6) PSI Post-Op Hemorrhage or Hematoma (PSI 9) 17,670 0.59 16,154 0.54 16,143 0.54 16,143 0.54 PSI Post-Op Respiratory Failure (PSI 11) 48,087 1.62 47,300 1.59 47,268 1.59 47,268 1.59 PSI Accidental Puncture or 51,249 1.72 42,599 1.43 42,570 1.43 42,570 1.43 Laceration (PSI 15)
  • 47. MPSMS & PSI Total All Other HACs (sum of 13 above) 583,897 19.63 479,286 16.11 468,299 15.74 512,352 17.22 AHRQ National Scorecard on Hospital-Acquired Conditions 18 Total 2014 Total 2015 HACs Total 2015 HAC Rate Total 2016 HACs Total 2016 HAC Rate Preliminary Total 2017 Preliminary Total 2017 HAC Rate Normalized Normalized Normalized Normalized HACs HAC Rate
  • 48. HAC Type Source Measure Total 2014 HACs per 1,000 Discharges to 2014 Baseline to 2014 Baseline to 2014 Baseline to 2014 Baseline Normalized to 2014 Baseline Normalized to 2014 Baseline Total MPSMS- 2,669,447 89.7 2,491,779 83.8 2,353,504 79.1 2,301,987 77.4 Based Measured HACs Total PSI-Based 195,162 6.6 179,824 6.0 179,701 6.0 179,701 6.0 Measured HACs Total NHSN- 73,158 2.5 73,212 2.5 73,162 2.5 73,162 2.5 Based Measured HACs Total HACs 2,937,767 98.7 2,744,815 92.3 2,606,367 87.6
  • 49. 2,554,850 85.9 AHRQ National Scorecard on Hospital-Acquired Conditions 19 AHRQ National Scorecard on Hospital-Acquired Conditions 20 The estimates that were previously used in 2016 to trend 2010 to 2014 results, and the estimates for 2014 that are being used to establish a new trend for 2014– 2019 results are shown below in Exhibit A2d. More details on the 2010-2014 results is available in the final data report for that period.15 Exhibit A2d. Historical and new estimates for 2014 (rounded) New Data for Trending 2014–2019 Results Historical Data for Trending 2010–2014 Results Hospital-Acquired Condition 2014 Updated Baseline for HACs 2014 Total HACs per 1,000 Discharges HAC Rate for 2014
  • 50. (Calculated for Comparison With 2010) Adverse Drug Events 1,001,000 33.7 41.4 Catheter-Associated Urinary Tract Infections 170,000 5.7 7.6 Central Line-Associated Bloodstream Infections 8,000 0.3 0.2 Clostridioides difficile Infections 86,000 2.9 (Included in All Other HACs) Falls 239,000 8.0 7.9 Obstetric Adverse Events 67,000 2.3 2.3 Pressure Ulcers/Pressure Injuries 647,000 21.7 30.9 Surgical Site Infections 73,000 2.5 2.5 Ventilator-Associated Pneumonias 36,000 1.2 1.2 (Post-Op) Venous Thromboembolisms 25,000 0.9 0.5 All Other HACs 584,000 19.6 26.4 Total 2,940,000 99 121
  • 51. Data in Exhibits A2e and A2f provide summary information on the trends from 2010 to 2014 based on historical data and methods as reported in 2016.11 They also provide new summary information on the data from 2014 to 2017’s preliminary results that were computed using the new methods established for tracking results from 2014 to 2019. 15 See the AHRQ HAC report at https://www.ahrq.gov/professionals/quality-patient- safety/pfp/2014-final.html. https://www.ahrq.gov/professionals/quality-patient- safety/pfp/2014-final.html AHRQ National Scorecard on Hospital-Acquired Conditions 21 Exhibit A2e. Summary data trended from 2010–2014 (historical) and 2014–2017 (new) 2010–2014 Historical Rate Annual Change From Previous Year Annual
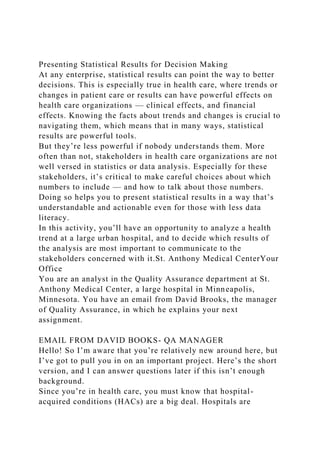
  • 52. Reduction From Baseline Year (2010) New Rate for 2014– 2019 Trending Annual Change From Previous Year Annual Reduction From Baseline Year (2014) 2010 145 2011 142 -2.1% -2.1% 2012 132 -7.0% -9.0% 2013 121 -8.3% -16.6% 2014 121 0.0% -16.6% 99 2015 92 -7.1% -7.1% 2016 88 -4.3% -11.1% 2017* 86 -2.3% -13.1%
  • 53. Average -4.4% -4.6% Annual Percent Change *Preliminary data. Exhibit A2f. Summary data trended from 2010–2014 (historical) and 2014–preliminary 2017 data 145 142 132 121 121 99 92 88 86 0 20 40 60 80 100 120 140 160 2010 2011 2012 2013 2014 2015 2016 2017* National HAC Rates: HACs per 1,000 Discharges 2010-2014 Historical rate New Rate for 2014-2019 Trending * Preliminary data.
  • 54. AHRQ National Scorecard on Hospital-Acquired Conditions 22 Appendix 3. National Goals for 2019 Based on 2014 NHR Baseline (Projected Reductions in HACs, Costs, and Deaths) Exhibit A3 shows annual summary data for achieving the goals associated with a 20 percent HAC reduction from 2014 to 2019. In these projections, which are based on annual reductions of 4.3 percent from 2014 to 2019 and an overall 20 percent reduction from 2014 to 2019, the total cumulative cost reductions total approximately $19.2 billion, and the total HAC-related deaths averted total approximately 53,000. Exhibit A3. HAC reduction goals for 2015 to 2019 based on new 2014 baseline and projected cost savings and deaths averted associated with meeting the HAC reduction goals Annual 2015 Goal 2016 Goal 2017 Goal 2018 Goal 2019 Goal (20% Reduction in HACs) Annual HAC Reductions From 2014 Baseline -126,000 -247,000 -363,000 -474,000 -580,000 Annual Cost Reductions
  • 55. Associated With Achieving Goal -$1,350,000,000 -$2,650,000,000 -$3,890,000,000 - $5,070,000,000 -$6,210,000,000 Annual Deaths Averted Associated With Achieving Goal -4,000 -7,000 -11,000 -14,000 -17,000 Cumulative Cumulative HAC Reductions From 2014 Baseline -126,000 -373,000 -736,000 -1,210,000 -1,790,000 Cumulative Cost Reductions Associated With Achieving Goal -1,350,000,000 -4,000,000,000 -7,890,000,000 -12,960,000,000 -19,170,000,000 Cumulative Deaths Averted Associated With Achieving Goal -4,000 -11,000 -22,000 -36,000 -53,000 AHRQ National Scorecard on Hospital-Acquired Conditions 23
  • 56. Appendix 4. Changes in the Samples Used for the MPSMS 2014–2017 Compared With 2010–2014 Previous Analyses The Medicare Patient Safety Monitoring System (MPSMS) methodology to identify adverse events within each chart from 2014 to 2017 is the same as in prior years. However, the methodology by which charts are identified, sampled, and included for review with the MPSMS has changed significantly during the period. The most significant changes are the result of changes to the requirements for the Hospital Inpatient Quality Reporting (IQR) Program and changes from International Classification of Diseases, 9th Revision (ICD-9) to 10th Revision (ICD-10) coding. The Hospital IQR Program is mandated by law. Changes to the Hospital IQR Program and Its Impact on the MPSMS Four- Condition Sample When the original method for calculating a national HAC rate (NHR) was developed,4 CMS and AHRQ monitored patient safety for the NHR using charts from patients treated for four conditions: • Acute myocardial infarction (AMI), • Congestive heart failure (CHF), • Pneumonia (PN), and • Major surgeries associated with the Surgical Care Improvement Project (SCIP).16 CMS reduced burden and costs by reusing charts for these conditions already obtained to support validation of the Hospital IQR Program as described in the Federal Register.17
  • 57. Briefly, all acute care hospitals subject to the inpatient prospective payment system (IPPS) receive payment incentives for meeting Hospital IQR Program reporting requirements. Therefore, from 2010 through 2014, nearly all IPPS hospitals submitted data to CMS on random samples of all inpatient stays that met the definitions for the four noted conditions. To validate the reported data on AMI, CHF, PN, and SCIP, CMS contractors randomly sampled between 400 and 800 hospitals (depending on the year) and requested 12 medical records (3 from each category) from each sampled hospital. CMS’s Hospital IQR Program requirements for AMI, CHF, PN, and SCIP remained similar for several consecutive years such that we obtained a stable consistent sample of medical charts from these four conditions from 2010 through 2014. From 2015 onward, the MPSMS four-condition sample (AMI, CHF, PN, and SCIP) has been an approximation of the previous four-condition samples used from 2010 through 2014. It had to be reconstructed by sampling hospitals reimbursed under IPPS and requesting charts from available all-payer data submitted to the Hospital IQR Program. 16 See https://www.qualitynet.org/dcs/ContentServer?c=Page&pagena me=QnetPublic%2FPage%2FQnetTier4& cid=1228773989482. 17 See “7. Chart Validation Requirements for Chart-Abstracted Measures” at 75 FR 50225-50229, August 16, 2010, at https://www.gpo.gov/fdsys/pkg/FR-2010-08-16/pdf/2010-
  • 58. 19092.pdf. https://www.qualitynet.org/dcs/ContentServer?c=Page&pagena me=QnetPublic%2FPage%2FQnetTier4&cid=1228773989482 https://www.qualitynet.org/dcs/ContentServer?c=Page&pagena me=QnetPublic%2FPage%2FQnetTier4&cid=1228773989482 https://www.gpo.gov/fdsys/pkg/FR-2010-08-16/pdf/2010- 19092.pdf AHRQ National Scorecard on Hospital-Acquired Conditions 24 As the hospital care environment changed, the Hospital IQR Program discontinued chart-based reporting requirements for these four conditions in 2015 (CHF, PN, and SCIP) and 2016 (AMI).18 Thus, from 2015 onward, after randomly sampling hospitals to provide data for MPSMS, CMS contractors identified medical records submitted to the Hospital IQR Program under global population specifications19 that also met the formally defined criteria for AMI, CHF, PN, or SCIP. The samples for 2015–2017 only approximate the data from 2014, so it is possible that the four- condition sample for 2015–2017 had a different risk profile than the sample data from 2014. This potential issue may be addressed by risk adjusting the data, which has been done in previous studies using MPSMS data. In general, the risk-adjusted results have shown trends similar to the results before risk adjustment.20 Changes From ICD-9 to ICD-10 Coding and Their Impact on the MPSMS Four-
  • 59. Condition Sample In quarter 4, 2015, hospitals began using ICD-10 coded data in place of ICD-9 coded data. It is notable that because MPSMS is based on chart-abstraction, results do not depend on this coding system. However, the specifications that CMS’s contractors used to identify charts for the four conditions (AMI, CHF, PN, and SCIP) did depend on these specifications. Therefore, this coding change introduced an inherent uncertainty regarding the nature of the comparability of the four- condition sample before and after quarter 4, 2015. Introduction of the Four-Condition Complement (“Global”) Sample To improve the number of conditions represented by MPSMS, we introduced the four-condition complement (“global”) sample designed to include most types of patients not included in the four-condition sample. All charts abstracted as part of MPSMS’s four-condition complement were originally submitted to the Clinical Data Abstraction Center for validation of Hospital IQR Program measures. 18 See “CY 2015 reporting period” and “CY 2016 reporting period” at https://www.qualitynet.org/dcs/ContentServer?c=Page&pagena me=QnetPublic%2FPage%2FQnetTier4&cid=12287 75411587. 19 See Section 2.9, “Global Initial Patient Population,” at https://www.qualitynet.org/dcs/ContentServer?c=Page&pagena me=QnetPublic%2FPage%2FQnetTier4&cid=12287 73989482. 20 See, for example, risk-adjusted data on ventilator-associated pneumonia rates in
  • 60. https://jamanetwork.com/journals/jama/fullarticle/2583369 or risk-adjusted physician-diagnosed catheter-associated urinary tract infection rates in https://www.ncbi.nlm.nih.gov/pubmed/28625702 and data without risk adjustment in https://www.ahrq.gov/sites/default/files/wysiwyg/professionals/ quality-patient-safety/pfp/2014finalhacreport-cx.pdf and earlier reports. https://www.qualitynet.org/dcs/ContentServer?c=Page&pagena me=QnetPublic%2FPage%2FQnetTier4&cid=1228775411587 https://www.qualitynet.org/dcs/ContentServer?c=Page&pagena me=QnetPublic%2FPage%2FQnetTier4&cid=1228775411587 https://www.qualitynet.org/dcs/ContentServer?c=Page&pagena me=QnetPublic%2FPage%2FQnetTier4&cid=1228773989482 https://www.qualitynet.org/dcs/ContentServer?c=Page&pagena me=QnetPublic%2FPage%2FQnetTier4&cid=1228773989482 https://jamanetwork.com/journals/jama/fullarticle/2583369 https://www.ncbi.nlm.nih.gov/pubmed/28625702 https://www.ahrq.gov/sites/default/files/wysiwyg/professionals/ quality-patient-safety/pfp/2014finalhacreport-cx.pdf AHRQ National Scorecard on Hospital-Acquired Conditions 25 The MPSMS-abstracted sample is representative of hospitals submitting cases to the Hospital IQR Program as specified for the “global” population.21 At first, we excluded cases younger than 18 years of age to increase consistency with the four-condition sample and cases meeting the definitions for AMI, CHF, PN, and SCIP, because these charts were monitored in the four- condition sample. Later, we excluded cases involving any major surgery to increase consistency in the observed sample from year to year.
  • 61. From 2014 to 2017, the overall number of charts used in the analyses to calculate the NHR and other information included in this document changed somewhat from year to year. Only the sample size of the global22 or four-condition complement group increased every year. Detailed information is provided in Exhibit A4. Exhibit A4. Number of charts used in the 2014, 2015, 2016, and 2017 MPSMS analyses for the NHR Year and Sample 2014 2015 2016 2017 AMI 4,234 4,076 3,797 2,651 CHF 4,820 2,423 5,330 3,779 Pneumonia 4,941 2,427 5,737 4,004 SCIP (CMS-defined major surgery cases) 5,480 2,817 5,920 3,880 "Global" (four-condition complement) 4,308 6,072 7,114 7,912 Total 23,783 17,815 27,898 22,226 Because the four-condition complement is defined by excluding cases with AMI, CHF, PN, and SCIP, the complement is also potentially affected by the introduction of ICD-10 in quarter 4, 2015. However, because this sample reflects a much broader spectrum of conditions treated in acute care hospitals, we anticipate that the influence of this change would be smaller when
  • 62. applied to the four-condition “complement” than to the four conditions themselves. Results for Individual Measures Depending on the year, the sample size varied from approximately 18,000 to 28,000 charts, reflecting care delivered in approximately 800 to 1,600 hospitals. Data are more precise for the overall harm rates than for individual metrics. MPSMS is also sensitive to changes in documentation practices, which in turn may be sensitive to changes in other measurement practices. For example, changes to the technical specifications used to define hospital-acquired 21 See “Section 2.9, “Global Initial Patient Population,” at https://www.qualitynet.org/dcs/ContentServer?c=Page&pagena me=QnetPublic%2FPage%2FQnetTier4&cid=12287 73989482. 22 The number of charts presented in Exhibit A4 for the global sample in 2015 and 2016 is 4.3% and 11.2% less, respectively, than indicated in the June 2018 report (see https://www.ahrq.gov/sites/default/files/wysiwyg/professionals/ quality-patient-safety/pfp/natlhacratereport- rebaselining2014-2016_0.pdf). The total charts in the samples were reduced due to the removal of AMI, CHF, and pneumonia charts that had been erroneously included in these samples previously. Removing these charts from the 2015 and 2016 global samples resulted in lower HAC rates. Due to these changes, the 2015 rate was reduced from 94 to 92 HACs per 1,000 discharges, and the 2016 rate was reduced from 90 to 88. https://www.qualitynet.org/dcs/ContentServer?c=Page&pagena me=QnetPublic%2FPage%2FQnetTier4&cid=1228773989482 https://www.qualitynet.org/dcs/ContentServer?c=Page&pagena
  • 63. me=QnetPublic%2FPage%2FQnetTier4&cid=1228773989482 https://www.ahrq.gov/sites/default/files/wysiwyg/professionals/ quality-patient-safety/pfp/natlhacratereport-rebaselining2014- 2016_0.pdf https://www.ahrq.gov/sites/default/files/wysiwyg/professionals/ quality-patient-safety/pfp/natlhacratereport-rebaselining2014- 2016_0.pdf AHRQ National Scorecard on Hospital-Acquired Conditions 26 infections or other adverse events might influence the way that harms get documented in the medical record over time. These changes to documentation in turn might influence some of the observed chart-abstracted HAC rates derived from the MPSMS. Changes in documentation and definitions also can influence the rates of other (PSI and NHSN- based) data used in this analysis. Possible Overrepresentation of Care Delivered in Small Hospitals The design of the MPSMS sample is closely linked to the current and historical designs of the Hospital IQR Program validation sample. Therefore, hospitals in any given quarter generally contributed approximately the same number of records of each type each quarter regardless of hospital size and volume. For example, a hospital that discharges 10 patients per day and one that discharges 100 patients per day would both have contributed approximately the same number of SCIP charts. Because of this strategy, the MPSMS sample overrepresents care delivered in smaller hospitals.
  • 64. We anticipate this overrepresentation to be consistent over time. However, because larger hospitals generally tend to treat more complex cases, it is conceivable that the overrepresentation of patients from smaller hospitals may have a greater impact on cases from the four-condition complement (“global”) sample, which is younger and has fewer comorbidities than the four- condition samples. A paper based on risk-adjusted MPSMS data covering the period of 2010 to 2017 is in preparation and is intended to follow up on results previously published based on MPSMS data for 2005–2011. 23 23 See https://www.ncbi.nlm.nih.gov/pubmed/24450892. https://www.ncbi.nlm.nih.gov/pubmed/24450892 AHRQ National Scorecard on Hospital-Acquired Conditions 27 Appendix 5. Estimates for HAC Costs and Mortality These data are based on the report Estimating the Additional Hospital Inpatient Cost and Mortality Associated With Selected Hospital-Acquired Conditions.24 These data update and replace the data available in Exhibit 1 in the 2013 Annual Hospital-Acquired Condition Rate and Estimates document.5 Exhibit A5. New estimates and comparisons with historical estimates used to calculate projections based on 2010–2014 data NORC (2017)
  • 65. Additional Cost per HAC Excess Mortality per HAC Current (New) Study Estimate (95% CI) 2010 AHRQ Estimate Current (New) Study Estimate (95% CI) 2010 AHRQ Estimate ADE $5,746 (-$3,950–$15,441) $5,452 0.012 (0.003–0.025) 0.02 CAUTI $13,793 ($5,019–$22,568) $1,090 0.036 (0.004–0.079) 0.023 CLABSI $48,108 ($27,232–$68,983) $18,537 0.150 (0.070– 0.270) 0.185 Falls $6,694 (-$1,277–$14,665) $7,888 0.050 (0.035–0.070) 0.055 OB Adverse Events $602 (-$578–$1,782) $3,271 0.005 (0.003–0.013) 0.0015 Pressure Ulcers/Pressure Injuries $14,506 (-$12,313–$41,326) $18,537 0.041 (0.013–0.093) 0.072 SSI $28,219 ($18,237–$38,202) $22,898 0.026 (0.009–0.059) 0.028
  • 66. VAP $47,238 ($21,890–$72,587) $22,898 0.140 (-0.110–0.730) 0.144 VTE $17,367 ($11,837–$22,898) $8,723 0.043 (0.040–0.078) 0.104 Clostridioides difficile Infection $17,260 ($9,341–$25,180) None 0.044 (0.028–0.064) None 24 This report is available at https://www.ahrq.gov/sites/default/files/wysiwyg/professionals/ quality-patient- safety/pfp/hac-cost-report2017.pdf. https://www.ahrq.gov/sites/default/files/wysiwyg/professionals/ quality-patient-safety/pfp/hac-cost-report2017.pdf https://www.ahrq.gov/sites/default/files/wysiwyg/professionals/ quality-patient-safety/pfp/hac-cost-report2017.pdfAHRQ National Scorecard on Hospital-Acquired ConditionsUpdated Baseline Rates and Preliminary Results 2014– 2017SummaryDetailed Goals for 2019Appendix 1. Method To Estimate the Baseline 2014 National Hospital-Acquired Condition RateAppendix 2. 2014–2017 NHR Data Tabulated (HACs and HAC Rate) and Compared With Summary 2010– 2014 DataAppendix 3. National Goals for 2019 Based on 2014 NHR Baseline (Projected Reductions in HACs, Costs, and Deaths)Appendix 4. Changes in the Samples Used for the MPSMS 2014–2017 Compared With 2010–2014 Previous AnalysesChanges to the Hospital IQR Program and Its Impact on the MPSMS Four-Condition SampleChanges From ICD-9 to ICD-10 Coding and Their Impact on the MPSMS Four- Condition SampleIntroduction of the Four-Condition Complement (“Global”) SampleResults for Individual MeasuresPossible Overrepresentation of Care Delivered in Small HospitalsAppendix 5. Estimates for HAC Costs and MortalityBlank Page
  • 67. January 2019 AHRQ National Scorecard on Hospital-Acquired Conditions Updated Baseline Rates and Preliminary Results 2014–2017 Summary Updated and new patient safety data for 2014 through 2017 continue to show a downward trend in the annual number of hospital-acquired conditions (HACs). As reported in 2016, from 2010 through 2014, the rate of HACs decreased 17 percent. New and updated data for 2014 to 2016 show an 11 percent decrease. When preliminary data for 2017 are included, the decrease in HACs from 2014 to 2017 is 13 percent. From 2010 through preliminary 2017 data, the average annual reduction in the overall rate of HACs was approximately 4.5 percent. For the trend beginning in 2014, methods were updated and a larger portion of hospital inpatients were included in the HAC calculations. The 2014 rate started at 99 HACs per 1,000 hospital discharges and is estimated at 86 HACs per 1,000 discharges for 2017. In the method previously used, the 2010 rate was calculated as 145 HACs per 1,000 discharges and the 2014 rate was 121 HACs per 1,000 discharges. Both methods use the same 28 measures of patient safety events, including many types of hospital-acquired infections, adverse drug events, and injuries due to procedures, as well as pressure ulcers/pressure injuries and
  • 68. falls. The newly established baseline of 99 HACs per 1,000 discharges in 2014 equates to approximately 2,940,000 HACs among all hospital inpatients 18 years old and over. The updated rate for 2017 equates to approximately 2,550,000 HACs. The final 2017 HAC rate will be updated and recalculated in the future to take into account changes seen in seven of the HAC measures that use ICD-101 data—these data will not be available until late 2019. However, these measures are responsible for only 8 to 10 percent of the annual HACs measured for 2014–2017, so the final calculations are unlikely to make meaningful changes to the data. Based on the HAC reductions seen in 2015, 2016, and 2017 compared with 2014, AHRQ estimates a total of 910,000 fewer HACs occurred than if the 2014 rates had persisted through 2017. These HAC reductions lead to estimates of approximately $7.7 billion in costs saved and approximately 20,500 HAC-related inpatient deaths averted from 2015 through 2017. Data reported in 2016 estimated that from 2011 through 2014, HAC reductions totaled 2.1 million, and these reductions resulted in approximately $19.9 billion in cost savings and 87,000 fewer HAC-related inpatient deaths.2 In the new and updated data for 2014–2017, not all types of HACs showed similar trends. For example, measured adverse drug events continued to drop from 2014 to 2017, while measured pressure ulcers/pressure injuries increased from 2014 to 2015
  • 69. and then decreased somewhat from 2015 to 2016 and 2017. A similar trend was seen for physician- diagnosed catheter-associated urinary tract infections. 1 ICD-10 = International Classification of Diseases, 10th Revision. The ninth revision is referred to as ICD-9. 2 See the AHRQ HAC report at https://www.ahrq.gov/professionals/quality-patient- safety/pfp/2014-final.html. https://www.ahrq.gov/professionals/quality-patient- safety/pfp/2014-final.html AHRQ National Scorecard on Hospital-Acquired Conditions 2 Of special interest may be the apparent reduction in the rate of antibiotic-associated Clostridioides difficile3 infections. Comparing these data with other sources of information, such as the Centers for Disease Control and Prevention (CDC) and the AHRQ Healthcare Cost and Utilization Project (HCUP), may help us determine if efforts to reduce the occurrence of this important HAC are effective at the national level. The new baseline of 99 HACs per 1,000 discharges was established and calculated for 2014 to monitor the progress of the Department of Health and Human Services (HHS) goal to reduce HACs by 20 percent from 2014 to 2019. This goal is specifically tied to the Centers for Medicare & Medicaid Services’ Hospital Improvement Innovation
  • 70. Networks, which work collaboratively with Federal and private partners to achieve this bold aim and build on prior successes. AHRQ estimates that if the 20 percent HAC reduction goal were achieved, the HAC rate in 2019 would be 79 per 1,000 discharges. That means approximately 1.8 million fewer HACs would occur compared with the number that would have occurred if HAC rates for 2015 through 2019 had stayed the same as in 2014. If a 20 percent reduction were to occur in each type of HAC measured, AHRQ projects that these 1.8 million fewer HACs would be associated with $19.2 billion in cost savings and 53,000 fewer deaths from 2015 through 2019. The results reported above through preliminary 2017 data are not inconsistent with achieving the 20 percent HAC reduction goal for 2019. Detailed Results The new 2014 baseline for the national HAC rate (NHR) is 99 HACs per 1,000 discharges. Exhibit 1 shows the details. Clostridioides difficile Infections is italicized because it was added as a “focus” HAC for reduction efforts and tracking for 2014 through 2019. Clostridioides difficile infections were previously tracked in the “All Other HACs” measure, a collection of 13 other types of HACs. Methods used to calculate the NHR are provided in Appendix 1, and all the measures used in the NHR are shown in Appendix 2, Exhibit A2c. Exhibit 1. New 2014 national HAC rate baseline (rounded),
  • 71. updated January 2019 Hospital-Acquired Condition 2014 Measured Baseline for HACs 2014 Total HACs per 1,000 Discharges Adverse Drug Events 1,001,000 33.7 Catheter-Associated Urinary Tract Infections 170,000 5.7 Central Line-Associated Bloodstream Infections 8500 0.3 Clostridioides difficile Infections 86,000 2.9 Falls 239,000 8.0 Obstetric Adverse Events 67,000 2.3 Pressure Ulcers/Pressure Injuries 647,000 21.8 Surgical Site Infections 73,000 2.5 3 Clostridium difficile has been changed to Clostridioides difficile. More information is available at https://www.ncbi.nlm.nih.gov/pubmed/27370902 and https://www.cdc.gov/hai/organisms/cdiff/cdiff_infect.html https://www.ncbi.nlm.nih.gov/pubmed/27370902 https://www.cdc.gov/hai/organisms/cdiff/cdiff_infect.html
  • 72. AHRQ National Scorecard on Hospital-Acquired Conditions 3 Hospital-Acquired Condition 2014 Measured Baseline for HACs 2014 Total HACs per 1,000 Discharges Ventilator-Associated Pneumonias 36,000 1.2 (Post-op) Venous Thromboembolisms 25,000 0.9 All Other HACs 584,000 19.6 Total 2,940,000 99 The new baseline established with the 2014 data was developed using a new method that was based on the method previously used to calculate the 2010-2014 NHR.4 The major difference between the new method and the previous method is that the new method includes patient charts for most conditions treated in acute care hospitals. Previously, the Medicare Patient Safety Monitoring System (MPSMS) used patient charts from only four groups of patients. Three were represented by the principal diagnosis (acute myocardial infarction [AMI], congestive heart failure [CHF], and pneumonia [PN]). The other comprised major surgery patients, as described by the Surgical Care Improvement Project [SCIP]). These groups were used to calculate the 2010–2014 NHR. With the new method, charts for conditions other than AMI, CHF, PN, and SCIP were sampled as a single group, starting with 2014, thus
  • 73. producing five sets of inpatient charts. The 2015 rate is 92 HACs per 1,000 discharges, and 2016 and preliminary 2017 rates are 88 and 86 HACs per 1,000 discharges, respectively (Exhibit 2). Also shown is the goal for 2019, 79 HACs per 1,000 discharges, which is a 20 percent reduction from the 2014 baseline NHR of 99. Detailed information on the number of HACs from 2015 to 2017 (preliminary) is shown in Appendix 2, Exhibit A2c. Appendix A2e shows how the current NHR, which starts in 2014 and will be tracked at least through 2019, compares with the NHR trended for 2010 to 2014. The 2010 to 2014 reduction was 17 percent over 4 years, and the 2014 to 2019 goal is a 20 percent reduction over 5 years. Appendix 3 shows the details of the HAC reductions, cost savings, and inpatient mortality reductions that are projected based on meeting this goal, which total 1.8 million HACs, $19.2 billion, and 53,000 lives. Appendix 4 describes changes in the samples used for the 2014–2017 analyses, compared with the 2010–2014 analyses. 4 See the report at https://www.ahrq.gov/sites/default/files/wysiwyg/professionals/ quality-patient- safety/pfp/pfphac.pdf. https://www.ahrq.gov/sites/default/files/wysiwyg/professionals/ quality-patient-safety/pfp/pfphac.pdf https://www.ahrq.gov/sites/default/files/wysiwyg/professionals/
  • 74. quality-patient-safety/pfp/pfphac.pdf AHRQ National Scorecard on Hospital-Acquired Conditions 4 Exhibit 2. Re-baselined 2014 data, with 2015, 2016, and preliminary 2017 national HAC rate data, and 2019 HAC goal Exhibit 3 provides the same information as Exhibit 2, but in table form that provides more details on the combined results to date, based on 2015 and 2016 data and preliminary data for 2017, compared with the 2014 baseline. AHRQ National Scorecard on Hospital-Acquired Conditions 5 Exhibit 3. Re-baselined 2014 data, with 2015, 2016, and preliminary 2017 national HAC rate data, and percent change through preliminary 2017data Hospital-Acquired Condition 2014 Measured Baseline for HACs 2015 Normalized Count of
  • 75. HACs 2016 Normalized Count of HACs Preliminary 2017 Normalized Count of HACs Percent Change in HACs, 2014 vs. Preliminary 2017 2019 Goal (20% Reduction of each HAC) Adverse Drug Events 33.7 30.0 27.1 24.2 -28% 26.9
  • 76. Catheter- Associated Urinary Tract Infections 5.7 6.4 5.7 5.4 -5% 4.6 Central Line- Associated Bloodstream Infections 0.29 0.07 0.22 0.27 -6% 0.23 Clostridioides difficile Infections 2.9 2.6 2.5 1.8 -37% 2.3 Falls 8.0 7.6 7.5 7.6 -5% 6.4 Obstetric Adverse Events 2.3 2.2 2.2 2.2 -5% 1.8 Pressure Ulcers/ Pressure Injuries 21.7 23.5 22.7 23.0 6% 17.4 Surgical Site Infections 2.5 2.5 2.5 2.5 0% 2.0 Ventilator-
  • 77. Associated Pneumonias 1.2 0.9 0.9 1.0 -13% 1.0 (Post-op) Venous Thromboembolisms 0.9 0.4 0.7 0.7 -17% 0.7 All Other HACs 19.6 16.1 15.8 17.2 -12% 15.7 Totals (rounded) 99 92 88 86 -13% 79 With the overall HAC reductions described above, and based on new per-HAC cost and mortality estimates updated in 2017 (see Appendix 5), we project that over 2015–2017, there were approximately $7.7 billion in cost savings and 20,500 fewer deaths associated with HACs. These projections are tabulated in Exhibit 4. In 2017, AHRQ released a special report on costs and inpatient mortality due to HACs.5 Appendix 5 shows the summary cost and mortality associated with each of the 10 focus HAC types, and the full report from which this table is excerpted is available on the AHRQ website.5 The cost and mortality for “all other HACs” was not estimated in this report and was estimated based on a weighted average of the 10 focus HACs, with the weighting based on the proportion of each of the 10 focus HACs in the 2014 baseline data. 5 This report is available at https://www.ahrq.gov/sites/default/files/wysiwyg/professionals/
  • 78. quality-patient- safety/pfp/hac-cost-report2017.pdf. https://www.ahrq.gov/sites/default/files/wysiwyg/professionals/ quality-patient-safety/pfp/hac-cost-report2017.pdf https://www.ahrq.gov/sites/default/files/wysiwyg/professionals/ quality-patient-safety/pfp/hac-cost-report2017.pdf AHRQ National Scorecard on Hospital-Acquired Conditions 6 Exhibit 4. Projected cost savings and deaths averted due to HAC changes to date from 2015 through preliminary 2017 data, compared with 2014 baseline Total Change in HACs, 2015, 2016, and Preliminary 2017 Data Compared With 2014 Estimate of Total Change in HAC- Related Costs Estimate of Total Change in HAC-Related Deaths Adverse Drug Events -585,000 -$3,360,000,000 -7,000 Catheter-Associated Urinary Tract Infections
  • 79. 12,000 $170,000,000 400 Central Line-Associated Bloodstream Infections -9,000 -$420,000,000 -1,300 Clostridioides difficile Infections -54,000 -$920,000,000 -2,400 Falls -43,000 -$290,000,000 -2,100 Obstetric Adverse Events -9,000 -$10,000,000 -100 Pressure Ulcers/Pressure Injuries 119,000 $1,720,000,000 4,900 Surgical Site Infections 0 $0 0 Ventilator-Associated Pneumonias -23,000 -$1,100,000,000 -3,300 Venous Thromboembolisms -22,000 -$390,000,000 -1,000 All Other HACs (not including Clostridioides difficile Infections) -293,000 -$3,130,000,000 -8,700 Totals From Annual Changes in HACs, HAC-Related Costs, and Deaths
  • 80. -910,000 -$7,730,000,000 -20,500 Note: Totals are rounded and thus may not reflect the total obtained by adding the individual cells. Detailed Goals for 2019 Achieving the goal of a 20 percent reduction in HACs (going from 99 to 79 HACs per 1,000 discharges; see Exhibit 3) would result in approximately 1.8 million fewer HACs in the years from 2015 to 2019. With constant annual reductions toward a 20 percent reduction across all measured HACs, and based on the new per-HAC estimates for costs and mortality from the 2017 study funded by AHRQ (see Appendix 5), our projections indicate approximately $19.2 billion in cost savings for the 5 years and 53,000 HAC-related deaths averted. These data are tabulated in Appendix 3. Data reported in late 2016 estimated that for the 4 years from 2011 through 2014, HAC reductions totaled 2.1 million compared with 2010 baseline data. These reductions resulted in approximately $19.9 billion in cost savings and 87,000 fewer HAC-related inpatient deaths.6 6 See report at https://www.ahrq.gov/professionals/quality- patient-safety/pfp/2014-final.html. https://www.ahrq.gov/professionals/quality-patient- safety/pfp/2014-final.html
  • 81. AHRQ National Scorecard on Hospital-Acquired Conditions 7 Looking Ahead In spite of the volume and velocity of data flowing into and through healthcare, providers, health system leaders, and other stakeholders lack sufficient information to guide their efforts as they work to prevent HACs. Similarly, patients’ choices often occur without the robust information they need, and this limitation constrains their efforts to be engaged in their own care. In addition, numerous other unmet needs must be addressed to continue preventing HACs and sustain the improvements documented in this report. In particular, we must continue to advance patient safety measurement, expand the evidence base for patient safety improvement strategies, and create resources to help providers and the healthcare workforce improve patient safety at the point of care. For example, it is critically important that we continue to drive innovation that efficiently harnesses the full potential of data and measurement. AHRQ’s patient safety measurement projects, including QSRS, are making progress by moving information closer to points of care where it can support providers and the safer care that all stakeholders want to achieve. A powerful foundation of knowledge about how to improve patient safety has been established over more than two decades of AHRQ-funded research and implementation projects, and, if we
  • 82. want to use this knowledge to address persistent patient safety challenges, it is crucial to pair it with capabilities that help clinicians and other healthcare workers reliably measure patient safety threats. When providers trust information they receive about patient safety, they are in better positions to understand these ongoing problems and to effectively prioritize and target them with safer practices. QSRS is being developed in part to serve this purpose by providing information that clinicians and other healthcare workers will trust and use to improve safety. AHRQ and other HHS agencies recognize that improving the safety and quality of healthcare is the ultimate purpose of measurement systems, and the ability to support this improvement effectively and efficiently is a desirable characteristic of these systems. AHRQ and CMS are using the MPSMS as the primary system to measure the NHR, but AHRQ has been working with CMS and other Federal partners, contractors, and other experts to develop the Quality and Safety Review System (QSRS), an improved system to succeed MPSMS. The QSRS has been developed and is undergoing use in the Clinical Data Abstraction Center, pilot testing at non-Federal settings,7 and refinement pursuant to the goal of supporting safe, high-quality care. QSRS has been designed as a robust measurement platform that will serve the shared needs of different healthcare stakeholders.
  • 83. 7 See https://www.ahrq.gov/professionals/quality-patient- safety/qsrs/index.html and https://www.ahrq.gov/sites/ default/files/wysiwyg/research/findings/factsheets/translating/ac tion3/actioniii-2016-summaries.pdf. https://www.ahrq.gov/professionals/quality-patient- safety/qsrs/index.html https://www.ahrq.gov/sites/default/files/wysiwyg/research/findi ngs/factsheets/translating/action3/actioniii-2016-summaries.pdf https://www.ahrq.gov/sites/default/files/wysiwyg/research/findi ngs/factsheets/translating/action3/actioniii-2016-summaries.pdf https://www.psoppc.org/psoppc_web/publicpages/surveillanceco mmonformats https://www.ncbi.nlm.nih.gov/pubmed/28671914 http://www.pso.ahrq.gov/common/development AHRQ National Scorecard on Hospital-Acquired Conditions 8 QSRS is designed to provide up-to-date national HAC rates, including rates of some additional types of HACs not currently measured with MPSMS, the AHRQ Patient Safety Indicators (PSIs), the Centers for Disease Control and Prevention National Healthcare Safety Network (NHSN), or other sources of information concerning patient safety in hospitals. It has been developed so that non-Federal entities, including hospitals and healthcare systems, will be able use it to measure patient safety. QSRS will allow assessment of safety for new patient populations not currently captured by MPSMS, which was originally designed to focus on adverse events experienced by Medicare
  • 84. patients. In addition, QSRS will allow organizations to consider aligning their local patient safety measurements with the same methods and measures used at the national level. Standard methods for measurement, such as those in QSRS, have been a valuable component of other healthcare improvement initiatives, including some that have addressed more specific safety challenges. The AHRQ Common Formats for Surveillance8 serve as the underlying content that provides the foundation of QSRS measures and cover a broad range of common and uncommon threats to patient safety. Development and revision of the Common Formats for Surveillance and QSRS are ongoing processes that include structured review and public feedback facilitated by the National Quality Forum. After release of QSRS, AHRQ will rely on feedback, especially from users, to inform the development of new versions of the Common Formats for Surveillance and for QSRS. This process will enable the Common Formats and QSRS to keep pace with users’ needs and the emerging scientific evidence base for patient safety and quality improvement. Some data needed for patient safety measurement may be increasingly available from electronic health records. AHRQ continues to explore the feasibility of automated approaches to data abstraction9 in order to further improve efficiency and reduce burden while maintaining the validity of QSRS and enhancing its ease of use. These include the AHRQ Common Formats for Surveillance, a subset of the AHRQ Common Formats.10
  • 85. 8 More information is available at https://www.psoppc.org/psoppc_web/publicpages/surveillanceco mmonformats. 9 See publication in the Journal of Patient Safety online at: https://www.ncbi.nlm.nih.gov/pubmed/28671914. A new study and report is currently in preparation and is expected to be complete later this year. 10 More information is available at www.pso.ahrq.gov/common/development. AHRQ National Scorecard on Hospital-Acquired Conditions 9 Appendix 1. Method To Estimate the Baseline 2014 National Hospital- Acquired Condition Rate This document describes the methods AHRQ has developed to estimate the national rate of HACs for 2014 to 2019, which has a goal of a 20 percent reduction in HACs. The estimate includes a wide variety of adverse events, including the 10 HACs selected for special focus by CMS as part of the programs to achieve the 20 percent reduction, as well as several other HACs. Collectively, 28 specific measures are used (Exhibit A1a): 15 measures to generate rates for the 10 specific focus HACs and 13 measures to generate a summary rate for “all other” HACs. Of the 28 measures, 21 are from the MPSMS, 6 are from the PSIs, and 1 is based on NHSN data. Exhibit A1a. Measures used to estimate the national HAC rate
  • 86. HAC Type Source Measure Adverse Drug Event MPSMS ADE Associated With Digoxin MPSMS ADE Associated With Hypoglycemic Agents MPSMS ADE Associated With IV Heparin MPSMS ADE Associated With LMWH and Factor Xa Inhibitor MPSMS ADE Associated With Warfarin CAUTI MPSMS Catheter-Associated Urinary Tract Infections CDI MPSMS Clostridioides difficile Infections CLABSI MPSMS Blood Stream Infections Associated With Central Venous Catheters Falls MPSMS In-Hospital Patient Falls Obstetric Adverse Events PSI OB Trauma in Vaginal Delivery (PSI 19) With (PSI 18) and Without Instrument Pressure Ulcer MPSMS Hospital-Acquired Pressure Ulcers/Pressure Injuries Surgical Site Infection NHSN SSIs for 17 procedures w/CDC SCIP+5 data VAP MPSMS Ventilator-Associated Pneumonia VTE MPSMS Postoperative Venous Thromboembolic Events All Other Hospital-
  • 87. Acquired Conditions MPSMS Femoral Artery Puncture for Catheter Angiographic Procedures MPSMS Adverse Event Associated With Hip Joint Replacements MPSMS Adverse Event Associated With Knee Joint Replacements MPSMS Contrast Nephropathy Associated With Catheter Angiography MPSMS Hospital-Acquired MRSA MPSMS Hospital-Acquired Vancomycin-Resistant Enterococcus (VRE) MPSMS Mechanical Complications Associated With Central Venous Catheters MPSMS Postoperative Cardiac Events for Cardiac and Noncardiac Surgeries MPSMS Postoperative Pneumonia PSI Iatrogenic Pneumothorax (PSI 6) PSI Post-Op Hemorrhage or Hematoma (PSI 9) PSI Post-Op Respiratory Failure (PSI 11) PSI Accidental Puncture or Laceration (PSI 15) AHRQ National Scorecard on Hospital-Acquired Conditions 10 Data from these 28 measures are combined to generate a summary national HAC rate (NHR) that has been calculated annually since 2010.4 The current method is built on the 2010–2014 methods but includes some changes. The current method removes the use of reference data from 2005– 2006 and includes a fifth set or sample of charts to augment the four samples used in the 2010–
  • 88. 2014 method. In the 2010–2014 method, Clostridioides difficile Infection data were included in “All Other HACs” rather than as a focus HAC, which is the case with the new method. As before, the new method uses HCUP data on the annual number of hospital inpatient discharges as the denominator for the rate calculations. The details of how the current NHR is calculated are summarized below. 1. The NHR is calculated using the following variables: a. Rate of 21 MPSMS adverse events in the MPSMS sample provided by CMS, including those in the SCIP (major surgery) sample, those with a principal diagnosis of AMI, CHF, or pneumonia, and a “global” sample intended to complement these four groups of patients. The sample is limited to patients 18 years old and over. For the NHR calculation, the rates of the 21 MPSMS adverse events are expressed as a rate for the whole sample population, rather than as a rate for the subpopulation that has the opportunity to experience the adverse event. For example, the CLABSI rate, like all rates in the sample, uses all patients in the denominator, not just the patients who had a central line inserted during their hospital stay. For each of the 21 MPSMS HACs, the estimate is a weighted average of the HAC rate for each group, where each group is given a weight that
  • 89. approximates the fraction of patients the group represents in the hospital discharge population age 18 and over. This approach ensures that the estimated rate will not be affected by variation across years in the percentage of patients in the samples of charts representing each of the five groups (SCIP, AMI, CHF, pneumonia, and global). It also uses the data from each sample in a way that best represents the conditions treated in the actual hospital inpatient population. The weights follow, based on their percentage11 of the inpatient population: • AMI: 2.15%, • CHF: 3.24%, • Pneumonia: 4.41%, • SCIP plus 5 other major surgeries: 19.17%, • Global: 71.03%. 11 These weights (percentages) are slightly different than in the report released in June 2018 (see https://www.ahrq.gov/sites/default/files/wysiwyg/professionals/ quality-patient-safety/pfp/natlhacratereport- rebaselining2014-2016_0.pdf). The change in weights to incorporate newer information is the reason that the HAC rate calculated in the June 2018 report for 2014 was 98 HACs per 1,000 discharges, while the rate for 2014 in this report is 99. https://www.ahrq.gov/sites/default/files/wysiwyg/professionals/ quality-patient-safety/pfp/natlhacratereport-rebaselining2014- 2016_0.pdf https://www.ahrq.gov/sites/default/files/wysiwyg/professionals/
  • 90. quality-patient-safety/pfp/natlhacratereport-rebaselining2014- 2016_0.pdf AHRQ National Scorecard on Hospital-Acquired Conditions 11 These AMI, CHF, and pneumonia patient data percentages were based on data from 2014 from the AHRQ National Inpatient Sample. The percentage of SCIP+5 patients was calculated based on the number of surgeries in the SCIP+5 sample from CDC, which was 5,704,493 among 29,751,955 discharges in 2014. The weighting for the global sample was 100 percent minus the contribution from the other four samples. b. National number of adverse events captured by PSIs 18 and 19 on obstetric injury and national number of four other PSIs (6, 9, 11, and 15) included among “all other” HACs.12 c. National number of selected surgical site infections computed in a special calculation for CDC. This calculation is based on NHSN data for 17 specific operations: the 12 SCIP operations and 5 other major surgical procedures not included in the SCIP.13 d. To estimate the rate of adverse events for each of the 21 HACs for all patients for which the MPSMS data are used, we follow these steps: • Multiply the adverse event rate for each of the 21 HACs for
  • 91. patients with one of the five conditions included in the 2014–2017 MPSMS samples by the number of hospital inpatients represented by the sample, as calculated by the weight of each sample and the overall total annual national discharges listed above. • Sum the estimates for each of the five samples for each measure to produce an estimate for each of the 21 measures. 2. The estimated total count of annual HACs in the national HAC rate is calculated as the sum of the total number of HACs for the 21 MPSMS HACs in (d) above, plus the estimated number of PSI HACs in (b), plus the number of NHSN-estimated HACs in (c). 3. The national HAC rate is the total HAC count in (2) above divided by the number of annual hospital inpatient discharges of patients at least 18 years old, as provided by HCUP. 4. As of January 2019, this method established for 2014 has been repeated for 2015, 2016, and 2017; we used 2016 data preliminarily for the number of annual hospital discharges in 2017. We aim to compare the estimated total number of HACs for 2015–2019 with the 2014 baseline without having the comparison affected by changes in the total number of discharges. Thus, for each year to date (2015, 2016, and preliminary 2017) we normalized the data to generate national estimates of HACs based on 29,751,955 discharges, which
  • 92. was the total number of discharges in 2014 for inpatients 18 years old and over. This method will be used again to finalize estimates for 2017 and to establish new estimates for 2018, and 2019 as the data become available. 12 Due to the transition from ICD-9 to ICD-10 that occurred with the start of the fourth quarter of 2015 and the effect of this change on the PSI data, only data from the first three quarters of 2015 were used to calculate the number of PSI events for 2015. The number of PSI events for January through September 2015 was multiplied by 4/3 to estimate the number of events (HACs) for the full year of 2015. 13 Due to the ICD-9 to ICD-10 transition that occurred with the start of the fourth quarter of 2015, only data from the first three quarters of 2015 were used to calculate the number of CDC NHSN SSI events for 2015. The CDC estimate provided for 2015 was based on 12 months of data, from October 2014 through September 2015. AHRQ National Scorecard on Hospital-Acquired Conditions 12 5. Due to changes in how some conditions and adverse events are described in ICD-9 and ICD-10, the data for the 7 of 28 measures that depend entirely or partly on administrative data cannot be compared for 2015 and 2016. These measures include the 6 PSI-based measures and the SSI data that constitute about 8 to 10 percent of the overall NHR for 2014 through 2017. To address this situation, we have reused the data from 2015 in the 2016 and 2017 results for these measures. In late 2019, we anticipate receiving new data
  • 93. for 2017 based on ICD-10 data that will enable us to compare the data with the 2016 data we currently have for these measures and to develop a method to continue the trending from 2014 to 2019 for these measures within the overall NHR. The data for 2016 we have received from the AHRQ HCUP team and the CDC NHSN statistician are tabulated below in Exhibit A1b. For the reasons described above, these data are not used in the 2016 NHR computed in this report but are included for completeness. Exhibit A1b. Data from AHRQ HCUP and CDC NHSN on total numbers of HACs associated with each ICD-10-dependent measure for 2016 Number of Patients Number of Cases of Included in Sample Measure Name for 2016 Adverse Events for This Measure PSI 6, Iatrogenic Pneumothorax 7,372 18,948,556 PSI 9, Perioperative Hemorrhage or Hematoma 12,285 5,368,607 PSI 11, Postoperative Respiratory Failure 35,971 2,384,676 PSI 15, Unrecognized Abdominopelvic Accidental 32,396 19,811,918 Puncture/Laceration PSI 18, Obstetric Trauma - Vaginal Delivery with 14,663 121,323 Instrument PSI 19, Obstetric Trauma - Vaginal Delivery without 34,066 1,874,410 Instrument Surgical Site Infections (special calculation performed 80,157 5,999,045 (estimate)
  • 94. by CDC NHSN to include SSIs in a consistent set of major surgeries since 2010) These data were not used in this report because they cannot be directly compared with prior years of data. AHRQ National Scorecard on Hospital-Acquired Conditions 13 Appendix 2. 2014–2017 NHR Data Tabulated (HACs and HAC Rate) and Compared With Summary 2010–2014 Data Information on the HACs for 2014, 2015, 2016, and 2017 is provided below. Exhibit A2a shows the calculated number of HACs (rounded), and Exhibit A2b shows the calculated HAC rates per 1,000 discharges. Exhibit A2c shows all the measures, including those used in the calculation of “All Other HACs.” These data have been normalized to account for the changes in annual discharges, i.e., the number of HACs shown in 2015–2017 is based on the number of HACs that would have occurred if the number of hospital discharges in 2015 (30,167,977) and 2016 (30,188,612) were unchanged from that in 2014 (29,751,955). The 2017 data shown are also normalized to 2014, but with 2016 data being used because 2017 hospital discharge data are not yet available. Hospital discharge data are from HCUP, and the exact numbers are based on a special analysis performed for this study to limit hospital discharges to those 18 years old and over. Data for the
  • 95. six PSIs and the SSI data from CDC are also wholly or partially based on HCUP data that depend on ICD-9 (through quarter 3 of 2015) or ICD-10 (beginning with quarter 4 of 2015). Because data based on ICD-9 and ICD-10 cannot be directly compared with each other, we cannot compare the measures for Obstetric Adverse Events and SSIs, as well as four of the PSI measures that contribute to “All Other HACs.” The data for 2017 are not currently available, and 2015 data are used in the preliminary estimates for 2017 as well. When 2017 data are available, we expect to compare 2016–2017 data that are dependent on ICD-10 and to continue that new trend through 2019. At present, we do not expect to be able to develop a method that will enable us to compare the data from ICD-based measures for 2015 with 2016. AHRQ National Scorecard on Hospital-Acquired Conditions 14 Exhibit A2a. HAC count estimates (rounded) Hospital-Acquired Condition 2014 Measured Baseline for HACs 2015 Normalized
  • 96. Count of HACs 2016 Normalized Count of HACs Preliminary 2017 Normalized Count of HACs Change in HACs, 2014 vs. Preliminary 2017 Percent Change in HACs, 2014 vs Preliminary 2017 14 Adverse Drug Events 1,001,000 894,000 805,000 721,000 - 280,000 -28% Catheter-Associated Urinary Tract Infections 170,000 191,000 170,000 161,000 -9,000 -5% Central Line-Associated Bloodstream Infections