Z Score,T Score, Percential Rank and Box Plot Graph
Nr293 pharmacology for nursing practice medication teac
1. NR293 Pharmacology for Nursing Practice
Medication Teaching Plan Guidelines
NR293_RUA_Medication_Teaching_Plan_Guidelines_V2.docx
Revised: 4/2020 1
Purpose
The purpose of this assignment is for the student to synthesize
pharmacological knowledge (i.e., core drug
knowledge, core patient variables, and nursing implications) of
pharmacotherapeutic agents into a useful
teaching and learning tool for nurses and patients.
Course outcomes: This assignment enables the student to meet
the following course outcomes:
CO1 Apply the concepts of pharmacotherapeutics,
pharmacokinetics, pharmacodynamics, and pharmacogenomics
to
the use of specific medication classifications in specific health
conditions and in consideration of medication
side/adverse effects, nursing implications, and medication
teaching. (POs 1, 2, and 3)
CO2 Apply principles of health promotion, as well as i llness
and injury prevention, to promote safety and effectiveness
of commonly used pharmacologic therapy across the lifespan,
2. taking into consideration sociocultural,
genetic/genomic, developmental, and gender implications. (POs
3 and 8)
CO3 Utilize the nursing process in understanding the effects of
drug therapy on health outcomes across the lifespan
within the framework of a diverse population of individuals,
families, and communities. (PO 4)
Due date: Your faculty member will inform you when this
assignment is due . The Late Assignment Policy applies
to this assignment.
Total points possible: 100 points
Preparing the assignment
Follow these guidelines when completing this assignment.
Speak with your faculty member if you have questions.
1. Choose a pharmacological agent that has been on the market
less than 5 years.
2. Research the literature and obtain two to three resources for
current, evidence-based information related to the
pharmacological agent.
3. Develop a teaching brochure and one page paper following
these guidelines.
a. Brochure
• Key/Relevant Drug Information (30 points/30%)
o Drug Class
o Mechanism of Action
o Drug Administration and Dosage
3. o Drug Interactions
o Lab effects/interference
o Special Considerations
o Potential Side Effects/Adverse Effects/Toxicities
• Patient Education Considerations (35 points/35%)
o Nursing Management
o Patient Education Considerations
o Patient Assessment
o Side Effects/Adverse Effects/Toxicities
o Special considerations
• Visual Effects/Creativity (10 points/10%)
o Developed per the required standard
o Appropriate for the intended audience
o Flesch-Kincaid reading level seventh grade or lower
o Graphics enhance the purpose of the brochure
o Brochure is visually appealing
NR293 Pharmacology for Nursing Practice
Medication Teaching Plan Guidelines
NR293_RUA_Medication_Teaching_Plan_Guidelines_V2.docx
Revised: 4/2020 2
b. One Page Paper (15 points/15%)
• Describes intended brochure audience
• Describes intended use of brochure
• Includes
o Name
o Date
o Class
4. o Reference page
c. APA Format (5 points/5%)
• Includes no more than 3 unique errors with APA format
(current ed.)
• At least two (2) scholarly, primary sources from the last 5
years, excluding the textbook, are provided
d. Writing and Mechanics (5 points/5%)
• Clearly written
• Includes no more than three unique errors of grammar
• Includes no more than three unique errors in writing
mechanics
• Paper is one page, excluding references and title page
For writing assistance (APA, formatting, or grammar) visit the
APA Citation and Writing Assistance page in the online
library.
Please note that your instructor may provide you with additional
assessments in any form to determine that you
fully understand the concepts learned in the review module.
https://library.chamberlain.edu/APA
NR293 Pharmacology for Nursing Practice
Medication Teaching Plan Guidelines
5. NR293_RUA_Medication_Teaching_Plan_Guidelines_V2.docx
Revised: 4/2020 3
Grading Rubric: Criteria are met when the student’s application
of knowledge demonstrates achievement of the outcomes for
this assignment.
Assignment Section and
Required Criteria
(Points possible/% of total points available)
Highest Level of
Performance
High Level of
Performance
Satisfactory Level
of Performance
Unsatisfactory
Level of
Performance
Section not
present in
paper
Brochure: Relevant Drug Information
(30 points/30%)
30 points 26 points 23 points 22 points 0 points
6. Required criteria
1. Drug Class
2. Mechanism of Action
3. Drug Administration and Dosage
4. Drug Interactions
5. Lab effects/interference
6. Special Considerations
7. Potential Side Effects/Adverse Effects/Toxicities
Includes no fewer
than 7 requirements
for section.
Includes no fewer
than 6
requirements for
section.
Includes no fewer
than 5
requirements for
section.
Includes 1-4 criteria
for section.
No requirements
for this section
present
7. Brochure: Patient Education Considerations
(35 points/35%)
35 points 28 points 26 points 23 points 0 points
Required criteria
1. Nursing Management
2. Patient Education Considerations
3. Patient Assessment
4. Side Effects/Adverse Effects/Toxicities
5. Special Considerations
Includes no fewer
than 5 requirements
for section.
Includes no fewer
than 4
requirements for
section.
Includes no fewer
than 3 requirements
for section.
Includes 1-2
requirements for
section.
No requirements
for this section
present.
8. Brochure: Visual Effects/Creativity
(10 points/10%)
10 points 8 points 7 points 4 points 0 points
Required criteria
1. Developed per the required standard
2. Appropriate for the intended audience
3. Flesch-Kincaid reading level seventh grade or lower
4. Graphics enhance the purpose of the brochure
5. Brochure is visually appealing
Includes no fewer
than 5 requirements
for section.
Includes no fewer
than 4 requirements
for section.
Includes no fewer
than 3 requirements
for section.
Includes 1-2
requirements for
section.
No requirements
for this section
present.
9. One Page Paper
(15 points/15%)
15 points 12 points 11 points 8 points 0 points
Required criteria
1. Describes intended brochure audience
2. Describes intended use of brochure
3. Includes
Includes no fewer
than 6
requirements for
section.
Includes no fewer
than 5
requirements for
section.
Includes no fewer
than 4
requirements for
section.
Includes 1-3 criteria
for section.
No requirements
for this section
present.
10. NR293 Pharmacology for Nursing Practice
Medication Teaching Plan Guidelines
NR293_RUA_Medication_Teaching_Plan_Guidelines_V2.docx
Revised: 4/2020 4
Assignment Section and
Required Criteria
(Points possible/% of total points available)
Highest Level of
Performance
High Level of
Performance
Satisfactory Level
of Performance
Unsatisfactory
Level of
Performance
Section not
present in
paper
o Name
o Date
11. o Class
o Reference page
APA Format
(5 points/5%)
5 points 2 points 0 points
Required criteria
1. Includes no more than 3 unique errors with APA
format (current ed.)
2. At least two (2) scholarly, primary sources from the
last 5 years, excluding the textbook, are provided
Includes 2 requirements for section. Includes 1
requirement for
section.
No requirements
for this section
present.
Writing Mechanics
(5 points/5%)
5 points
4 points 2 points 0 points
Required criteria
1. Clearly written
12. 2. Includes no more than three unique errors of
grammar
3. Includes no more than three unique errors in
writing mechanics
4. Paper is 1 page, excluding title and reference pages
Includes no fewer than 4 requirements for
section.
Includes no fewer
than 3 requirements
for section.
Includes 1-2
requirements for
section.
No requirements
for this section
present.
Total Points Possible = 100 points
Page 1 of 4
(Sample) Curve-Fitting Project - Linear Model: Men's 400
13. Meter Dash Submitted by Suzanne Sands
(LR-1) Purpose: To analyze the winning times for the Olympic
Men's 400 Meter Dash using a linear model
Data: The winning times were retrieved from
http://www.databaseolympics.com/sport/sportevent.htm?sp=AT
H&enum=130
The winning times were gathered for the most recent 16
Summer Olympics, post-WWII. (More data was available, back
to 1896.)
DATA:
Summer Olympics:
Men's 400 Meter Dash
Winning Times
Year
Time
(seconds)
1948 46.20
1952 45.90
1956 46.70
1960 44.90
14. 1964 45.10
1968 43.80
1972 44.66
1976 44.26
1980 44.60
1984 44.27
1988 43.87
1992 43.50
1996 43.49
2000 43.84
2004 44.00
2008 43.75
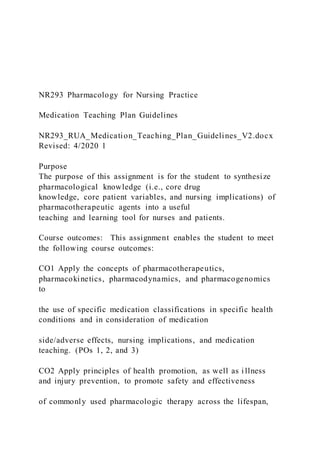
(LR-2) SCATTERPLOT:
As one would expect, the winning times generally show a
downward trend, as stronger competition and training
methods result in faster speeds. The trend is somewhat linear.
43.00
16. Year
Summer Olympics: Men's 400 Meter Dash Winning Times
Page 2 of 4
(LR-3)
Line of Best Fit (Regression Line)
y = −0.0431x + 129.84 where x = Year and y = Winning
Time (in seconds)
(LR-4) The slope is −0.0431 and is negative since the winning
times are generally decreasing.
The slope indicates that in general, the winning time decreases
by 0.0431 second a year, and so the winning time decreases at
an
average rate of 4(0.0431) = 0.1724 second each 4-year Olympic
interval.
y = -0.0431x + 129.84
R² = 0.6991
43.00
43.50
18. Summer Olympics: Men's 400 Meter Dash Winning Times
Page 3 of 4
(LR-5) Values of r
2
and r:
r
2
= 0.6991
We know that the slope of the regression line is negative so the
correlation coefficient r must be negative.
� = −√0.6991 = −0.84
Recall that r = −1 corresponds to perfect negative correlation,
and so r = −0.84 indicates moderately strong negative
correlation
(relatively close to -1 but not very strong).
(LR-6) Prediction: For the 2012 Summer Olympics, substitute x
= 2012 to get y = −0.0431(2012) + 129.84 ≈ 43.1 seconds.
The regression line predicts a winning time of 43.1 seconds for
the Men's 400 Meter Dash in the 2012 Summer Olympics in
London.
19. (LR-7) Narrative:
The data consisted of the winning times for the men's 400m
event in the Summer Olympics, for 1948 through 2008. The data
exhibit
a moderately strong downward linear trend, looking overall at
the 60 year period.
The regression line predicts a winning time of 43.1 seconds for
the 2012 Summer Olympics, which would be nearly 0.4 second
less
than the existing Olympic record of 43.49 seconds, quite a feat!
Will the regression line's prediction be accurate? In the last two
decades, there appears to be more of a cyclical (up and down)
trend. Could winning times continue to drop at the same average
rate? Extensive searches for talented potential athletes and
improved full-time training methods can lead to decreased
winning times, but ultimately, there will be a physical limit for
humans.
Note that there were some unusual data points of 46.7 seconds
in 1956 and 43.80 in 1968, which are far above and far below
the
regression line.
If we restrict ourselves to looking just at the most recent
winning times, beyond 1968, for Olympic winning times in
20. 1972 and
beyond (10 winning times), we have the following scatterplot
and regression line.
Page 4 of 4
Using the most recent ten winning times, our regression line is
y = −0.025x + 93.834.
When x = 2012, the prediction is y = −0.025(2012) + 93.834 ≈
43.5 seconds. This line predicts a winning time of 43.5
seconds for 2012 and
that would indicate an excellent time close to the existing
record of 43.49 seconds, but not dramatically below it.
Note too that for r
2
= 0.5351 and for the negatively sloping line, the correlation
coefficient is � = −√0.5351 = −0.73, not as strong as when
we considered the time period going back to 1948. The most
recent set of 10 winning times do not visually exhibit as strong
a linear trend as the
set of 16 winning times dating back to 1948.
21. CONCLUSION:
I have examined two linear models, using different subsets of
the Olympic winning times for the men's 400 meter dash and
both have
moderately strong negative correlation coefficients. One model
uses data extending back to 1948 and predicts a winning time of
43.1 seconds
for the 2012 Olympics, and the other model uses data from the
most recent 10 Olympic games and predicts 43.5 seconds. My
guess is that 43.5
will be closer to the actual winning time. We will see what
happens later this summer!
UPDATE: When the race was run in August, 2012, the
winning time was 43.94 seconds.
y = -0.025x + 93.834
R² = 0.5351
43.40
43.60
43.80
44.00
44.20
44.40
22. 44.60
44.80
1968 1976 1984 1992 2000 2008
T
im
e
(
s
e
c
o
n
d
s
)
Year
Summer Olympics: Men's 400 Meter Dash Winning Times
ProjectInformation/LinearModelInfo/LinearProjectInstructions.
html
Curve-fitting Project - Linear Model (due at the end of Week 5)
Instructions
23. For this assignment, collect data exhibiting a relatively linear
trend, find the line of best fit, plot the data and the line,
interpret the slope, and use the linear equation to make a
prediction. Also, find r2 (coefficient of determination)
and r (correlation coefficient). Discuss your findings. Your
topic may be that is related to sports, your work, a hobby, or
something you find interesting. If you choose, you may use the
suggestions described below.
A Linear Model Example and Technology Tips are provided in
separate documents.
Tasks for Linear Regression Model (LR)
(LR-1) Describe your topic, provide your data, and cite
your source. Collect at least 8 data points. Label
appropriately. (Highly recommended: Post this information in
the Linear Model Project discussion as well as in your
completed project. Include a brief informative description in the
title of your posting. Each student must use different data.)
The idea with the discussion posting is two-fold: (1) To share
your interesting project idea with your classmates, and (2) To
give me a chance to give you a brief thumbs-up or thumbs-down
about your proposed topic and data. Sometimes students get off
on the wrong foot or misunderstand the intent of the project,
and your posting provides an opportunity for some feedback.
Remark: Students may choose similar topics, but must
have different data sets. For example, several students may be
interested in a particular Olympic sport, and that is fine, but
they must collect different data, perhaps from different events
or different gender.
(LR-2) Plot the points (x, y) to obtain a scatterplot. Use an
appropriate scale on the horizontal and vertical axes and be sure
to label carefully. Visually judge whether the data points
exhibit a relatively linear trend. (If so, proceed. If not, try a
different topic or data set.)
(LR-3) Find the line of best fit (regression line) and graph it on
the scatterplot. State the equation of the line.
24. (LR-4) State the slope of the line of best fit.
Carefully interpret the meaning of the slope in a sentence or
two.
(LR-5) Find and state the value of r2, the coefficient of
determination, and r, the correlation coefficient. Discuss your
findings in a few sentences. Is r positive or negative? Why? Is a
line a good curve to fit to this data? Why or why not? Is the
linear relationship very strong, moderately strong, weak, or
nonexistent?
(LR-6) Choose a value of interest and use the line of best fit to
make an estimate or prediction. Show calculation work.
(LR-7) Write a brief narrative of a paragraph or two. Summarize
your findings and be sure to mention any aspect of the linear
model project (topic, data, scatterplot, line, r, or estimate, etc.)
that you found particularly important or interesting.
You may submit all of your project in one document or a
combination of documents, which may consist of word
processing documents or spreadsheets or scanned handwritten
work, provided it is clearly labeled where each task can be
found. Be sure to include your name. Projects are graded on the
basis of completeness, correctness, ease in locating all of the
checklist items, and strength of the narrative portions.
Here are some possible topics: Choose an Olympic sport -- an
event that interests you. Go to
https://www.olympic.org/olympic-results and collect data for
winners in the event for at least 8 Olympic games (dating back
to at least 1980). (Example: Winning times in Men's 400 m
dash). Make a quick plot for yourself to "eyeball" whether the
data points exhibit a relatively linear trend. (If so, proceed. If
not, try a different event.) After you find the line of best fit, use
your line to make a prediction for the next Olympics (2014 for a
winter event, 2016 for a summer event ).Choose a particular
type of food. (Examples: Fish sandwich at fast-food chains,
cheese pizza, breakfast cereal) For at least 8 brands, look up the
25. fat content and the associated calorie total per serving. Make a
quick plot for yourself to "eyeball" whether the data exhibit a
relatively linear trend. (If so, proceed. If not, try a different
type of food.) After you find the line of best fit, use your line to
make a prediction corresponding to a fat amount not occurring
in your data set.) Alternative: Look up carbohydrate content and
associated calorie total per serving.Choose a sport that
particularly interests you and find two variables that may
exhibit a linear relationship. For instance, for each team for a
particular season in baseball, find the total runs scored and the
number of wins. Excellent
websites: http://www.databasesports.com/
and http://www.baseball-reference.com/