SlideShare a Scribd company logo
1 of 12
Download to read offline
NOVEMBER 2023
CRANBERRY
AGRICULTURE AND
WATER QUALITY
IN BUZZARDS BAY
A Decade of Scientific Investigation
• Watershed management plans can be developed with
confidence that there is adequate information about the
amount of nitrogen and phosphorus that cranberry bogs
contribute to downstream waters.
• The slow steady flow coming out of bogs during most of
the year should be targeted to most efficiently reduce the
nitrogen washing downstream from cranberry bogs.
• Restoring to natural wetlands actively farmed cranberry
bogs that intercept high-nitrogen groundwater could
significantly reduce the amount of nitrogen pollution that
cranberry bogs currently contribute to the Wareham and
Weweantic Rivers.
• To maximize nutrient removal benefits, bogs that should
be prioritized for restoration are flow-through bogs, bogs
closest to the estuary, and those that intercept water
carrying a lot of nitrogen from upstream developed areas.
SUMMARY CONCLUSIONS
PROJECT PARTNERS
ACKNOWLEDGEMENTS
This report captures work with a number of
project partners and individuals. In addition to the
authors, contributors to this work include: Carolyn
DeMoranville, Krystal DeMoranville, Benjamin
Hoekstra, Adrian Wiegman, Kirby Gilmore, Cass
Gilmore, Matthew Beaton, Lindsay Scott, Richard
McHorney, Megan Bartholomew, Paul Lefebvre,
Jeffrey LaFleur, Richard LaFond, Sarah Hewins
and the Town of Carver. We thank Joseph Costa of
the Buzzards Bay National Estuary Program, Mark
Rasmussen of the Buzzards Bay Coalition, and the
staff of the Cranberry Station for their long-standing
interest and support for work to quantify the role
of cranberry bogs in nutrient movement within the
watershed of Buzzards Bay.
FINANCIAL SUPPORT
This work was partially funded with Federal Funds
from the Environmental Protection Agency (EPA)
to the Massachusetts Department of Environmental
Protection (MassDEP) under a s.604(b) competitive
grant and under assistance agreement CE-96185701
to the Massachusetts Executive Office of Energy and
Environmental Affairs Buzzards Bay National Estuary
Program. Federal funding was also provided through
the Woods Hole Sea Grant. Additional support was
provided by the U.S. Department of Agriculture
Agricultural Research Service to Casey Kennedy, by
the University of Massachusetts Cranberry Station to
Hilary Sandler, by the Buzzards Bay Coalition to
Rachel Jakuba, and from the Northeast Climate
Science Center, Marine Biological Laboratory and
Woodwell Climate Research Center to Christopher
Neill. Any views or opinions presented in this
report are solely those of the authors and do not
necessarily represent those of the Massachusetts
Office of Coastal Zone Management, the Executive
Office of Energy and Environmental Affairs, or the
Commonwealth of Massachusetts. The contents do
not necessarily reflect the views and policies of EPA
or MassDEP, nor does the mention of trade names
or commercial products constitute endorsement or
recommendation for use.
SUGGESTED CITATION
Jakuba, R. W., Neill, C., Kennedy, C., Sandler, H., Wick, B., and
B. Napolitano (2023) Cranberry agriculture and water quality in
Buzzards Bay. A Decade of Scientific Investigation. 9pp.
REFERENCES
DeMoranville, C. and Howes, B. (2005) Final Report for Phosphorus Dynamics in Cranberry
Production Systems: Developing the Information Required for the TMDL process for 303d
water bodies receiving cranberry bog discharge, Project 01-12/319.
Hoekstra, B. R., Neill, C., and Kennedy, C. D. (2019) Trends in the Massachusetts cranberry
industry create opportunities for the restoration of cultivated riparian wetlands.
Restoration Ecology. doi: 10.1111/re.13037.
Howes, B. L., Teal, J. M. (1995) Nutrient Balance of a Massachusetts Cranberry Bog and Rela-
tionships to Coastal Eutrophication. Environmental Science & Technology, 29 (4): 960–976.
Howes, B., Samimy, R., Eichner, E., Schlezinger, D., Ramsey, J., and Kelley, S. W. (2014)
Linked Watershed-Embayment Model to Determine Critical Nitrogen Loading Thresholds
for the Wareham River, Broad Marsh and Mark’s Cove Embayment System, Wareham,
Massachusetts.
Kennedy, C., Neill, C., Jakuba, R. W., Napolitano, B. (2023) Final Report for Assessing
Nutrient Reduction Scenarios in the Wareham River Watershed, Project 2018-04/604.
Neill, C., Scott, L., Jakuba, R., Kennedy, C., DeMoranville, C. (2017) Final Report for Nutrient
Balances in Southeastern Massachusetts Cranberry Bogs.
Neill, C., Lefebvre, P., Hoekstra, B., Jakuba, R., Kennedy, C. (2021) Prioritizing restoration of
cranberry bogs in Buzzards Bay, Massachusetts watersheds using a stream network model.
Oral presentation. Coastal and Estuarine Research Federation 26th Biennial Conference.
Town of Carver, Buzzards Bay Coalition, Marine Biological Laboratory, University of
Massachusetts Cranberry Station (2015) Final Report for Cranberry Bog Nutrient Loss
Study, Project 2011-03/604.
Valiela, I., Collins, G., Kremer, J., Lajtha, K., Geist, M., Seely, B., Brawley, J., Sham, C. H. (1997),
Nitrogen loading from coastal watersheds to receiving estuaries: New method and
application. Ecological Applications, 7, 358–380.
Williamson, S. C., Rheuban, J. E., Costa, J. E., Glover, D. M., Doney, S. C. (2017), Assessing
the impact of local and regional influences on nitrogen loads to Buzzards Bay, MA.
Frontiers in Marine Science, 3: 1– 17.
Wollheim, W. M., Vorosmarty, C. J., Peterson, B. J., Seitzinger, S. P., Hopkinson, C. S.
(2006) Relationship between river size and nutrient removal. Geophysical Research
Letters, 33: L06410.
1
Discharge of nitrogen and phosphorus pollutes freshwater ponds,
streams, and rivers and the saltwater bays and harbors of Buzzards
Bay. In fresh waters, phosphorus, or phosphorus in combination
with nitrogen, triggers excess algae growth. In salt waters, nitrogen
leads to an overabundance of algae. Most of the nitrogen pollution
that reaches Buzzards Bay comes from septic systems, wastewater
treatment plants, and road runoff. However, in parts of the
watershed where there are dense concentrations of cranberry bogs,
bogs can contribute significant amounts of nutrients.
This report describes work by the Buzzards Bay Coalition and
partner organizations committed to protecting water quality in
Buzzards Bay. The work was supported by a series of grants over
10 years. The goal was to improve understanding of how cranberry
bogs contribute to nutrient pollution of coastal watersheds and to
use this understanding to inform management actions that minimize
nutrient discharges and maximize nutrient removal.
ABOUT THIS REPORT
BACKGROUND
sources of water to irrigate bogs,
protect cranberry plants from frost,
and flood the bogs for harvest. Water
that leaves cranberry bogs may carry
with it nitrogen and phosphorus
that come in part from fertilizer
that is applied to bogs to help
cranberries grow. Nutrients released
from cranberry bogs then travel in
groundwater, streams, and rivers to
Buzzards Bay.
The Weweantic River and Wareham
River Watersheds contain more than
9,000 acres of cranberry bogs. In
total, cranberry bogs are estimated
to account for roughly 30% of the
2
Cranberries are wetland plants
that have been harvested for food,
medicine, and dyes dating to before
Europeans colonized North America.
Cranberry bogs have historically been
an important part of the landscape,
heritage, and local economy of
southeastern Massachusetts.
Approximately 20% of the nation’s
cranberry crop is produced within
Massachusetts and much of that
occurs within the watershed of
Buzzards Bay (51%).
Cranberry agriculture is intimately
connected to natural waterways.
Growers use ponds and rivers as
nitrogen pollution to the Weweantic
River and 20% to the Wareham
River (residential septic systems
are the major source of nitrogen to
both rivers). Nitrogen pollution has
plagued these estuaries for years. In
the Wareham River, the Massachusetts
Estuaries Project determined that
close to 40% of the total nitrogen load
to the river needs to be reduced to
restore clean water (Howes et al., 2014).
New technology and cranberry
cultivars have led to the recent, rapid
expansion of the cranberry industry
in other parts of North America.
Massachusetts cranberry farmers face
fruit prices that are not keeping up
with increasing costs, and generally
low yields from bogs still planted with
native cranberry cultivars. Farmers
have to decide whether it makes
sense to invest in renovating bogs
with updated technology and hybrid
cultivars that bring higher yields,
produce high-value berries, and
require less water. Less productive
bogs have the potential to be retired
and restored to natural wetlands
where they could serve as sinks that
absorb and remove nutrients. Retired
bogs are those where farming no
longer occurs. Restored bogs are
those where additional steps are taken
to return the bog to a natural wetland.
ACTIVE CRANBERRY BOGS
BUZZARDS BAY WATERSHED
WEWEANTIC RIVER WATERSHED
WAREHAM RIVER WATERSHED
Beginning in 2011, the Buzzards Bay Coalition, U.S. Department of Agriculture Agricultural Research Service (USDA),
Woodwell Climate Research Center, University of Massachusetts (UMass) Cranberry Station, Cape Cod Cranberry
Growers’ Association, Marine Biological Laboratory, Southeastern Regional Planning & Economic Development District,
and the Town of Carver began collaborating to quantify how cranberry agriculture affects downstream waters. The work
involved both field sampling and improving watershed models. Local farmers facilitated sampling on their farms.
THE RESEARCH
2) Modeling how cranberry bogs impact watershed
nutrients – Using watershed models we estimated the
amount of nitrogen from all watershed sources, includ-
ing cranberry bogs, in the Wareham River watershed.
We used models to estimate nitrogen that reaches
Buzzards Bay from bogs in different places in the
watershed as the water moves through creeks and
streams on its way to the estuary.
3) Potential water quality benefits of restoring natural
wetlands at current cranberry bogs – We used models
to estimate the potential nitrogen removal that might
be achieved by restoring some cranberry bogs to natu-
ral wetlands, which are excellent at retaining nutrients.
Research Summary – Our studies covered three main
research areas: 1) Measuring nutrient releases from
cranberry bogs, 2) Modeling how cranberry bogs impact
overall watershed nutrients, and 3) Potential water
quality benefits of restoring natural wetlands at current
cranberry bogs.
1) Measuring nutrient releases from cranberry bogs – We
used field studies of water, nitrogen, and phosphorus
movement on multiple cranberry farms to quantify
the magnitude of nutrient inputs and outputs and
nutrient movement in different phases of cranberry
crop management.
3
RESEARCH AREA 1
Measuring Nutrient Releases
from Cranberry Bogs
Background
Prior to our work, only two studies had estimated how
much nitrogen or phosphorus is released from cranberry
bogs (DeMoranville and Howes, 2005; Howes and Teal, 1995).
One study focused on a flow-through bog, which is a type
of bog where a river channel flows through the bog. Flow-
through bogs represent only about 20% of the bogs in
Massachusetts (Hoekstra et al., 2019).The other study looked
at six traditional wetland-type bogs.Wetland-type bogs,
rather than lining a river channel, are set in areas that were
former wetlands, often on the edges of forest or near ponds
and are connected to streams by ditches or channels. These
studies showed losses of nitrogen and phosphorus were
higher for the flow-through bogs than traditional wetland
bogs. However, there was a wide range of outputs across
bogs that made it hard to develop bog management
strategies to reduce watershed nutrient pollution.
Methods
We monitored nitrogen and phosphorus inputs and outputs
in traditional wetland bogs that all had similar fertilizer
amounts applied. In an initial study, we monitored six
bogs for one-and-a-half years with surface water samples
collected by hand from the bog inlets and outlets. Because
previous research suggested that flood events accounted
for most of the annual nutrient loss, the initial study
focused on flood events.
To get a more complete understanding of the nutrient
losses over the whole year, we then carefully tracked the
amount of water moving into and out of three bogs and
the nitrogen and phosphorus concentrations of that water.
We instrumented these bogs with automated samplers
that collected water more frequently than was possible by
hand. For one year, the samplers collected water during
flood releases and during low flows between floods. The
samplers were set to collect samples daily during most of
the year when the bogs were not flooded. During fall harvest
floods and winter freeze protection floods, we programmed
samplers to collect frequently (every 20 minutes) when water
volumes were changing fast and less frequently (every several
hours) when less water was moving.
The volumes of water that moved during floods were
estimated with water level and flow recorders. We paired
the water flow data with measured nutrient concentrations
to calculate how much nitrogen and phosphorus moved
downstream during floods and during the rest of the year.
Results
By comparing six bogs, we found that the variation in
nitrogen concentrations leaving the bogs was influenced
more by nitrogen sources in the watershed and how much
water flows through a bog than by cranberry management.
Although there was variability among bogs, the nitrogen
exiting the six bogs was close to that estimated for wetland
bogs from other studies (Town of Carver, 2015). The more
detailed sampling of three bogs showed similar variability
(Neill et al., 2017). Net stream transport of nitrogen averaged
3.1 lb/ac (range of -0.1 to 11.3 lb/ac). This provided greater
certainty about nutrient loading rates that should be used
in watershed planning. We found a smaller range of
phosphorus concentrations among the bogs than for
nitrogen concentrations.The amount of phosphorus
washing downstream from the bogs (1.9 to 4.0 lb/ac,
average of 2.7 lb/ac) was similar to or slightly higher than
measured in previous studies.The amount of nitrogen
fertilizer applied is well-balanced with the amount of
nitrogen in the crop harvest.
The automated samplers deployed at three bogs revealed
how much nitrogen and phosphorus was leaving the bogs
during different times of year.The small, steady trickle of
water that left the bogs during non-flooding times
accounted for the majority of the water flowing downstream.
4
Nitrogen Export
Phosphorus Export
Because most of the annual nitrogen and phosphorus
losses occurred during non-flooding times, management
measures aimed at nutrient removal from the small
but steady outflows during non-flood periods could be
beneficial. Such management might include additional
storage time in ponds or increased naturalization of stream
channels to enhance nitrogen uptake and denitrification.
Bogs discharging higher amounts of flow are good targets
for nutrient removal measures because larger amounts of
nitrogen and phosphorus are passing through them.
Though the concentrations of nitrogen and phosphorus
in this trickle were generally low, because the amount of
water added up over the course of the year, the steady
trickle made up the largest fraction of both nitrogen and
phosphorus released downstream.
The amount of nitrogen and phosphorus released in the
steady of trickle of water leaving the bogs is linked to how
much water the steady trickle represented, which was
influenced by where a bog sits in the landscape. Some
bogs were very wet and water flowed through their ditches
constantly. Others bogs had ditches that were mostly dry
or with water that was not flowing.Two of the bogs studied
had groundwater springs that brought water into the bogs
over the course of a year, while the third bog did not. The
difference in the amount of nutrients washed downstream
between bogs was primarily related to how much water
moved through the bog systems rather than specific
farming practices. One bog was fed with a particularly
large amount of natural groundwater input from springs.
The larger amount of water flow resulted in higher overall
amounts of nutrients washing downstream from this bog.
Management Implications
This work improved our estimates of how much nitrogen
and phosphorus are released from cranberry bogs.This
provides confidence that the estimates can be used for
effectively developing nitrogen reduction management
plans such as Total Maximum Daily Loads (TMDLs)
required by the Clean Water Act.
HARVEST FLOOD
WINTER FLOOD
GROUNDWATER
STREAM FLOW
Nitrogen Export
5
17%
75% 63.5%
27%
2%
6%
2.5%
7%
above Diagrams show the annual movement of nitrogen (top)
and phosphorus (bottom) through cranberry bogs. Numbers are
the average of three bogs in pounds nitrogen or phosphorus per
acre. Nitrogen and phosphorus are deposited on bogs through
application of fertilizer, precipitation, water pumped onto the bogs
through irrigation and during harvest and winter floods, and from
groundwater flowing into the bogs. Nitrogen and phosphorus flow
out of bogs by removal of berries and leaves during harvest, when
flood waters are released, and when water on the bog soaks into
the groundwater or flows from the ditches into streams.
Nitrogen Balance
Phosphorus Balance
Groundwater
Harvest and
winter floods
Harvest biomass
Fertilizer
Precipitation
Irrigation
Stream flow (0.3)
(3.1)
(7.9)
(3.2)
(2.4)
14.8
(4.7)
31.6 27.4
Groundwater
Harvest and
winter floods
Harvest biomass
Fertilizer
Precipitation
Irrigation
Stream flow (0.1)
(0.5)
(0)
(0.2) (0.2)
2.3 (1.2)
4.1
6.6
Groundwater
Harvest and
winter floods
Harvest biomass
Fertilizer
Precipitation
Irrigation
Stream flow (0.3)
(3.1)
(7.9)
(3.2)
(2.4)
14.8
(4.7)
31.6 27.4
Groundwater
Harvest and
winter floods
Harvest biomass
Fertilizer
Precipitation
Irrigation
Stream flow (0.1)
(0.5)
(0)
(0.2) (0.2)
2.3 (1.2)
4.1
6.6
6
RESEARCH AREA 2
Modeling How Cranberry Bogs
Impact Watershed Nutrients
Background
Nitrogen pollution comes from a number of sources.
To understand the importance of any nutrients coming
from cranberry bogs, it is necessary to compare them
with other nutrient sources in the watershed. Models are
effective tools for estimating the amount of nutrients
different sources contribute to a waterbody. The
Wareham and Weweantic River watersheds are the two
watersheds in Southeastern Massachusetts that have the
most cranberry farm acreage. We used the Wareham
River as a case study to model how nutrients that enter
the watershed from cranberry agriculture contribute to
nutrient pollution downstream in the estuary.
Methods
We used a well-established model called the Nutrient
Loading Model (NLM), to estimate how much nitrogen
reaches waterbodies (Valiela et al., 1997). Nitrogen loads
are based on detailed information about the watershed
and studies of how much nitrogen comes from different
features in the landscape (e.g., residential areas, sew-
age treatment plants, the atmosphere, natural areas, and
agriculture). The NLM model has been regularly used in
Southeastern Massachusetts over the last 20 years. For
this study, new data were collected on the concentration
of nitrogen coming from rain. Recent reports (2016-2018)
were obtained on how much nitrogen is released from
the Wareham Pollution Control Facility. Cranberry fertil-
izer rates were estimated based on a survey of cranberry
growers in the watershed.
The NLM model estimates how much nitrogen reaches
surface waters. We paired the NLM with a stream chan-
nel model (Wollheim et al., 2006) to see what happens to
the nitrogen once it reaches the water and moves down-
stream through progressively larger streams to the Bay.
The stream channel model uses information about the size
of different stream and river stretches to estimate how
much nitrogen will be taken up by plants and microbes as
the water moves in stream channels filled with plants and
organic matter.
Both of these models estimate the nitrogen moving
through the system but not phosphorus. Phosphorus
sticks to soils and sediments so it does not travel as easily
downstream as nitrogen. As a result, phosphorus is not as
large a problem as nitrogen at the watershed scale, and
there are currently no plans to create watershed scale
management plans for phosphorus. We therefore focused
only on nitrogen since it poses the most concern at the
watershed scale.
above UMass Cranberry Station scientists collect
groundwater samples near a bog.
7
Nitrogen Sources to the Wareham River Management Implications
Cranberry bogs are an important source of nitrogen to
the Wareham River. As watershed management plans are
developed to reduce nitrogen, the impact of cranberry
agriculture should be considered.This could include
encouraging or incentivizing best practices that prevent
nitrogen from washing downstream from bogs such as
creating storage ponds, naturalizing stream channels, or
avoiding fertilizer application prior to predicted rain. Our
work focused on cranberry varieties that have been most
abundant in Southeastern Massachusetts. However, the
industry is beginning to transition bogs to newer varieties
that yield more fruit. Researchers at the UMass Cranberry
Station/USDA are studying the potential impact of these
newer varieties.
Results
The updated NLM modeling showed that cranberry bogs
accounted for about 20% of the nitrogen flowing into
the Wareham River (Kennedy et al., 2023), which is similar
to previous estimates (Howes et al., 2014; Williamson et al.,
2017). However, not all bogs contributed equal amounts of
nitrogen. Flow-through type bogs that line river channels
release more nitrogen than wetland bogs that connect
to water bodies through streams or ditches. As water
travels from bogs to small streams that connect with
larger streams and eventually the Wareham River, some
of the nitrogen from the bogs is used by aquatic plants
and bacteria. This uptake by plants and bacteria helps to
reduce the impact of nitrogen from cranberry bogs. We
estimated that currently, two-thirds of the nitrogen leaving
the bogs in the Wareham River watershed is removed by
uptake by plants and bacteria as the water moves through
natural streams and wetlands (Neill et al., 2021).
CRANBERRY FERTILIZER
SEPTIC SYSTEMS
ATMOSPHERIC DEPOSITION
LAWN FERTILIZER
WASTEWATER
TREATMENT PLANT
above Water samples collected from a bog are filtered prior to
laboratory analysis for nitrogen and phosphorus.
21%
30%
24%
9%
16%
RESEARCH AREA 3
Potential Water Quality Benefits Of Restoring
Natural Wetlands At Current Cranberry Bogs
Background
The evolving economics of cranberry agriculture is leading
some growers to retire a portion of their bogs currently in
production that are more difficult to farm or less profitable
in order to modernize farm operations, invest in new, high-
yield cranberry cultivars, and prioritize higher-performing
bogs. At the same time, the Massachusetts Division of
Ecological Restoration has developed techniques for
restoring retired cranberry bogs to naturalized wetlands.
Wetland restoration provides ecological benefits
including nutrient removal, improved habitat for birds,
fish, amphibians and reptiles, greater natural floodwater
storage, and locations for recreation and access to nature.
State and federal programs currently provide funding
to retire farmland and restore some retired bogs to natural
wetlands. At the same time, towns are under pressure
to reduce nitrogen pollution to estuaries.We wanted to
understand how much nitrogen could be reduced by
restoring bogs to natural wetlands in the Wareham River
watershed. How retirement and restoration of cranberry
bogs may influence phosphorus in the watershed was not
studied since there are currently no management plans
targeting phosphorus reduction at the watershed scale.
Methods
We classified all the bogs in the Wareham River watershed
using aerial photographs to determine whether they
were flow-through, traditional non-flow-through, or
newly renovated or newly constructed non-flow-through.
They were also classified based on what size stream
they connected to. The amount of nitrogen released
downstream from all the bogs was calculated based on
the total area of each type of bog and whether the water
traveled through natural streams and wetlands.
We then developed scenarios to test how retiring or
restoring bogs would impact the amount of nitrogen
flowing to the Wareham River estuary. When a cranberry
bog is retired from active farming, fertilizer is no longer
applied, which reduces nitrogen inputs, though the amount
of nitrogen leaving the system as harvested cranberries
is also reduced.Wetlands have the potential to remove
substantial amounts of nitrogen, but even bogs that were
originally built in wetlands do not necessarily revert to
wetlands when farming stops. Because cranberry farming
involves adding layers of sand to bogs, which raises the
height of bogs over time, many retired bogs naturally
turn into forest or shrubland rather than wetlands. Active
restoration of cranberry bogs aims to disturb the top soil
layer, exposing the organic material below and create
more natural stream channels to encourage retired bogs
to become wetlands.
8
above Drone image of the Coonamessett River where former flow-
through cranberry bogs have been restored to natural wetlands.
Photo credit: Adam Soule
9
9
Management Implications
Retiring and restoring cranberry bogs could be a valuable
part of the overall management plan for reducing nitrogen
pollution to the Wareham River. A targeted strategy for
restoration could reduce nitrogen to the Wareham River
estuary by about 10%, which is one-quarter of the overall
reduction needed to restore water quality.To maximize
nutrient removal benefits, bogs that should be prioritized
for restoration are flow-through bogs, bogs closest to the
estuary, and those that intercept upstream water carrying
high levels of nitrogen from developed areas.
Results
The location and type of bogs that are retired or restored
had an important impact on the potential nitrogen benefit
of retiring and restoring bogs. If all of the flow-through
type bogs in the Wareham River watershed (which
represent 19% of the total bog area) were restored, it
would cut the amount of nitrogen from cranberry bogs
making it to the Wareham River estuary by about 40%,
which represents a reduction of overall nitrogen to the
watershed of about 10% (Kennedy et al., 2023).
With wetland type non-flow-through bogs, targeting
bogs in specific locations can greatly influence how much
nitrogen makes it to the estuary. For example, restoration
of randomly selected bogs or bogs that are high in the
watershed that connect through many streams to the
estuary will have only a small impact on the nitrogen
reaching the Wareham River estuary. Restoring bogs close
to the estuary will have a greater reduction in nitrogen
pollution to the estuary than those farther away. More
nitrogen makes it to the estuary from bogs close to the
estuary because there is less time for the nitrogen from
these bogs to be taken up by plants and bacteria in
streams and channels (Neill et al., 2020).
Restoration of wetlands on retired bogs has the potential
to remove not just fertilizer from cranberry bogs, but
any source of nitrogen that moves through wetlands as
surface water and groundwater. Some cranberry bogs are
in locations where they intercept surface and groundwater
flowing from residential areas that contains high amounts
of nitrogen. Restoring bogs that intercept high nitrogen
groundwater would yield a high benefit relative to the
area of cranberry bogs restored. By restoring less than
half the acreage of flow-through bogs, restoring bogs
that intercept high nitrogen groundwater would result in
a slightly greater percentage of nitrogen reduction to the
estuary (12%) than restoring all the flow-through bogs
(Kennedy et al., 2023).
Relative
Watershed
Nitrogen
Load
(%)
100
75
50
25
0
Watershed N Load
Current
350
262.5
175
87.5
0
Area
to
be
Restored
(acres)
Retire all
flow-through
Retire and
restore all
flow-through
Retire and restore
bogs that intercept
high nitrogen
groundwater
Scenarios
Restored Area
above The blue bars show model results for the nitrogen loading
to the Wareham River under current conditions (100%) and
under three scenarios for retiring and restoring bogs. The red
bars indicate the acres of bogs that would be restored under
each scenario.
114 Front Street • New Bedford, Massachusetts 02740
(508) 999-6363
info@savebuzzardsbay.org
www.savebuzzardsbay.org
• Watershed management plans can be developed with confidence that there is
adequate information about the amount of nitrogen and phosphorus that cranberry
bogs contribute to downstream waters.
• The slow steady flow coming out of bogs during most of the year should be targeted
to most efficiently reduce the nitrogen washing downstream from cranberry bogs.
• Restoring to natural wetlands actively farmed cranberry bogs that intercept high-
nitrogen groundwater could significantly reduce the amount of nitrogen pollution
that cranberry bogs currently contribute to the Wareham and Weweantic Rivers.
• To maximize nutrient removal benefits, bogs that should be prioritized for restoration
are flow-through bogs, bogs closest to the estuary, and those that intercept water
carrying a lot of nitrogen from upstream developed areas.
SUMMARY CONCLUSIONS

More Related Content

Similar to Cranberries and Water Quality_Nov2023 (1).pdf

Maui County Council - Save the Reefs - Course Correction - Due Diligence
Maui County Council - Save the Reefs - Course Correction - Due DiligenceMaui County Council - Save the Reefs - Course Correction - Due Diligence
Maui County Council - Save the Reefs - Course Correction - Due DiligenceClifton M. Hasegawa & Associates, LLC
 
Healthy Coastal Ecosystems
Healthy Coastal EcosystemsHealthy Coastal Ecosystems
Healthy Coastal EcosystemsOregon Sea Grant
 
Farms, Floods and Fluvial Geomorphology: Making The Most Of Our Natural Resou...
Farms, Floods and Fluvial Geomorphology: Making The Most Of Our Natural Resou...Farms, Floods and Fluvial Geomorphology: Making The Most Of Our Natural Resou...
Farms, Floods and Fluvial Geomorphology: Making The Most Of Our Natural Resou...National Institute of Food and Agriculture
 
Buzzards Bay Coalition 2016 Annual Report
Buzzards Bay Coalition 2016 Annual ReportBuzzards Bay Coalition 2016 Annual Report
Buzzards Bay Coalition 2016 Annual ReportBuzzards Bay Coalition
 
Puget Sound Nutrient Source Reduction Project
Puget Sound Nutrient Source Reduction ProjectPuget Sound Nutrient Source Reduction Project
Puget Sound Nutrient Source Reduction ProjectNisqually River Council
 
Dr. Eileen Kladivko - Transforming Drainage Project
Dr. Eileen Kladivko - Transforming Drainage ProjectDr. Eileen Kladivko - Transforming Drainage Project
Dr. Eileen Kladivko - Transforming Drainage ProjectJohn Blue
 
Sean McMahon - Farmer-led Efforts to Improve Water Quality
Sean McMahon - Farmer-led Efforts to Improve Water QualitySean McMahon - Farmer-led Efforts to Improve Water Quality
Sean McMahon - Farmer-led Efforts to Improve Water QualityJohn Blue
 
EPA\'s Source Water Protection Program
EPA\'s Source Water Protection ProgramEPA\'s Source Water Protection Program
EPA\'s Source Water Protection ProgramJohnUngvarsky1
 
Water Wise: Residential Landscape and Irrigation Guide for Western Colorado
Water Wise: Residential Landscape and Irrigation Guide for Western ColoradoWater Wise: Residential Landscape and Irrigation Guide for Western Colorado
Water Wise: Residential Landscape and Irrigation Guide for Western ColoradoKaila694m
 
Cooley Preville Snyder Final Draft
Cooley Preville Snyder Final DraftCooley Preville Snyder Final Draft
Cooley Preville Snyder Final DraftOlivia Cooley
 
Implications of Household (Domestic) Use of Hard water on Molepolole Residents
Implications of Household (Domestic) Use of Hard water on Molepolole ResidentsImplications of Household (Domestic) Use of Hard water on Molepolole Residents
Implications of Household (Domestic) Use of Hard water on Molepolole Residentskoketso Kanekane
 
Mesa County Town Hall Meeting
Mesa County Town Hall MeetingMesa County Town Hall Meeting
Mesa County Town Hall MeetingWalter Davidson
 
Hydrogeology-of-the-Dry-Zone-Central-Myanmar PART-1
Hydrogeology-of-the-Dry-Zone-Central-Myanmar PART-1Hydrogeology-of-the-Dry-Zone-Central-Myanmar PART-1
Hydrogeology-of-the-Dry-Zone-Central-Myanmar PART-1MYO AUNG Myanmar
 
Buzzards Bay Coalition 2014 Annual Report
Buzzards Bay Coalition 2014 Annual ReportBuzzards Bay Coalition 2014 Annual Report
Buzzards Bay Coalition 2014 Annual ReportBuzzards Bay Coalition
 
BerggrenWatershedConservationAreaReport
BerggrenWatershedConservationAreaReportBerggrenWatershedConservationAreaReport
BerggrenWatershedConservationAreaReportEric Mullen
 

Similar to Cranberries and Water Quality_Nov2023 (1).pdf (20)

Maui County Council - Save the Reefs - Course Correction - Due Diligence
Maui County Council - Save the Reefs - Course Correction - Due DiligenceMaui County Council - Save the Reefs - Course Correction - Due Diligence
Maui County Council - Save the Reefs - Course Correction - Due Diligence
 
Implementing Watershed Conservation Goals - Kirkham
Implementing Watershed Conservation Goals - KirkhamImplementing Watershed Conservation Goals - Kirkham
Implementing Watershed Conservation Goals - Kirkham
 
Healthy Coastal Ecosystems
Healthy Coastal EcosystemsHealthy Coastal Ecosystems
Healthy Coastal Ecosystems
 
Farms, Floods and Fluvial Geomorphology: Making The Most Of Our Natural Resou...
Farms, Floods and Fluvial Geomorphology: Making The Most Of Our Natural Resou...Farms, Floods and Fluvial Geomorphology: Making The Most Of Our Natural Resou...
Farms, Floods and Fluvial Geomorphology: Making The Most Of Our Natural Resou...
 
Buzzards Bay Coalition 2016 Annual Report
Buzzards Bay Coalition 2016 Annual ReportBuzzards Bay Coalition 2016 Annual Report
Buzzards Bay Coalition 2016 Annual Report
 
Swcs grand challenge gulf hypoxia g white
Swcs grand challenge gulf hypoxia g whiteSwcs grand challenge gulf hypoxia g white
Swcs grand challenge gulf hypoxia g white
 
Puget Sound Nutrient Source Reduction Project
Puget Sound Nutrient Source Reduction ProjectPuget Sound Nutrient Source Reduction Project
Puget Sound Nutrient Source Reduction Project
 
Dr. Eileen Kladivko - Transforming Drainage Project
Dr. Eileen Kladivko - Transforming Drainage ProjectDr. Eileen Kladivko - Transforming Drainage Project
Dr. Eileen Kladivko - Transforming Drainage Project
 
Sean McMahon - Farmer-led Efforts to Improve Water Quality
Sean McMahon - Farmer-led Efforts to Improve Water QualitySean McMahon - Farmer-led Efforts to Improve Water Quality
Sean McMahon - Farmer-led Efforts to Improve Water Quality
 
Opperman CV 010317
Opperman CV 010317Opperman CV 010317
Opperman CV 010317
 
EPA\'s Source Water Protection Program
EPA\'s Source Water Protection ProgramEPA\'s Source Water Protection Program
EPA\'s Source Water Protection Program
 
Water Wise: Residential Landscape and Irrigation Guide for Western Colorado
Water Wise: Residential Landscape and Irrigation Guide for Western ColoradoWater Wise: Residential Landscape and Irrigation Guide for Western Colorado
Water Wise: Residential Landscape and Irrigation Guide for Western Colorado
 
Cooley Preville Snyder Final Draft
Cooley Preville Snyder Final DraftCooley Preville Snyder Final Draft
Cooley Preville Snyder Final Draft
 
Bob Bastian
Bob BastianBob Bastian
Bob Bastian
 
How understanding field to stream sediment
How understanding field to stream sedimentHow understanding field to stream sediment
How understanding field to stream sediment
 
Implications of Household (Domestic) Use of Hard water on Molepolole Residents
Implications of Household (Domestic) Use of Hard water on Molepolole ResidentsImplications of Household (Domestic) Use of Hard water on Molepolole Residents
Implications of Household (Domestic) Use of Hard water on Molepolole Residents
 
Mesa County Town Hall Meeting
Mesa County Town Hall MeetingMesa County Town Hall Meeting
Mesa County Town Hall Meeting
 
Hydrogeology-of-the-Dry-Zone-Central-Myanmar PART-1
Hydrogeology-of-the-Dry-Zone-Central-Myanmar PART-1Hydrogeology-of-the-Dry-Zone-Central-Myanmar PART-1
Hydrogeology-of-the-Dry-Zone-Central-Myanmar PART-1
 
Buzzards Bay Coalition 2014 Annual Report
Buzzards Bay Coalition 2014 Annual ReportBuzzards Bay Coalition 2014 Annual Report
Buzzards Bay Coalition 2014 Annual Report
 
BerggrenWatershedConservationAreaReport
BerggrenWatershedConservationAreaReportBerggrenWatershedConservationAreaReport
BerggrenWatershedConservationAreaReport
 

Recently uploaded

Is RISC-V ready for HPC workload? Maybe?
Is RISC-V ready for HPC workload? Maybe?Is RISC-V ready for HPC workload? Maybe?
Is RISC-V ready for HPC workload? Maybe?Patrick Diehl
 
Temporomandibular joint Muscles of Mastication
Temporomandibular joint Muscles of MasticationTemporomandibular joint Muscles of Mastication
Temporomandibular joint Muscles of Masticationvidulajaib
 
Call Us ≽ 9953322196 ≼ Call Girls In Lajpat Nagar (Delhi) |
Call Us ≽ 9953322196 ≼ Call Girls In Lajpat Nagar (Delhi) |Call Us ≽ 9953322196 ≼ Call Girls In Lajpat Nagar (Delhi) |
Call Us ≽ 9953322196 ≼ Call Girls In Lajpat Nagar (Delhi) |aasikanpl
 
Grafana in space: Monitoring Japan's SLIM moon lander in real time
Grafana in space: Monitoring Japan's SLIM moon lander  in real timeGrafana in space: Monitoring Japan's SLIM moon lander  in real time
Grafana in space: Monitoring Japan's SLIM moon lander in real timeSatoshi NAKAHIRA
 
Call Girls In Nihal Vihar Delhi ❤️8860477959 Looking Escorts In 24/7 Delhi NCR
Call Girls In Nihal Vihar Delhi ❤️8860477959 Looking Escorts In 24/7 Delhi NCRCall Girls In Nihal Vihar Delhi ❤️8860477959 Looking Escorts In 24/7 Delhi NCR
Call Girls In Nihal Vihar Delhi ❤️8860477959 Looking Escorts In 24/7 Delhi NCRlizamodels9
 
Recombinant DNA technology( Transgenic plant and animal)
Recombinant DNA technology( Transgenic plant and animal)Recombinant DNA technology( Transgenic plant and animal)
Recombinant DNA technology( Transgenic plant and animal)DHURKADEVIBASKAR
 
Bentham & Hooker's Classification. along with the merits and demerits of the ...
Bentham & Hooker's Classification. along with the merits and demerits of the ...Bentham & Hooker's Classification. along with the merits and demerits of the ...
Bentham & Hooker's Classification. along with the merits and demerits of the ...Nistarini College, Purulia (W.B) India
 
Best Call Girls In Sector 29 Gurgaon❤️8860477959 EscorTs Service In 24/7 Delh...
Best Call Girls In Sector 29 Gurgaon❤️8860477959 EscorTs Service In 24/7 Delh...Best Call Girls In Sector 29 Gurgaon❤️8860477959 EscorTs Service In 24/7 Delh...
Best Call Girls In Sector 29 Gurgaon❤️8860477959 EscorTs Service In 24/7 Delh...lizamodels9
 
Call Girls in Munirka Delhi 💯Call Us 🔝9953322196🔝 💯Escort.
Call Girls in Munirka Delhi 💯Call Us 🔝9953322196🔝 💯Escort.Call Girls in Munirka Delhi 💯Call Us 🔝9953322196🔝 💯Escort.
Call Girls in Munirka Delhi 💯Call Us 🔝9953322196🔝 💯Escort.aasikanpl
 
zoogeography of pakistan.pptx fauna of Pakistan
zoogeography of pakistan.pptx fauna of Pakistanzoogeography of pakistan.pptx fauna of Pakistan
zoogeography of pakistan.pptx fauna of Pakistanzohaibmir069
 
Speech, hearing, noise, intelligibility.pptx
Speech, hearing, noise, intelligibility.pptxSpeech, hearing, noise, intelligibility.pptx
Speech, hearing, noise, intelligibility.pptxpriyankatabhane
 
insect anatomy and insect body wall and their physiology
insect anatomy and insect body wall and their  physiologyinsect anatomy and insect body wall and their  physiology
insect anatomy and insect body wall and their physiologyDrAnita Sharma
 
TOPIC 8 Temperature and Heat.pdf physics
TOPIC 8 Temperature and Heat.pdf physicsTOPIC 8 Temperature and Heat.pdf physics
TOPIC 8 Temperature and Heat.pdf physicsssuserddc89b
 
Module 4: Mendelian Genetics and Punnett Square
Module 4:  Mendelian Genetics and Punnett SquareModule 4:  Mendelian Genetics and Punnett Square
Module 4: Mendelian Genetics and Punnett SquareIsiahStephanRadaza
 
Cytokinin, mechanism and its application.pptx
Cytokinin, mechanism and its application.pptxCytokinin, mechanism and its application.pptx
Cytokinin, mechanism and its application.pptxVarshiniMK
 
Forest laws, Indian forest laws, why they are important
Forest laws, Indian forest laws, why they are importantForest laws, Indian forest laws, why they are important
Forest laws, Indian forest laws, why they are importantadityabhardwaj282
 
RESPIRATORY ADAPTATIONS TO HYPOXIA IN HUMNAS.pptx
RESPIRATORY ADAPTATIONS TO HYPOXIA IN HUMNAS.pptxRESPIRATORY ADAPTATIONS TO HYPOXIA IN HUMNAS.pptx
RESPIRATORY ADAPTATIONS TO HYPOXIA IN HUMNAS.pptxFarihaAbdulRasheed
 
SOLUBLE PATTERN RECOGNITION RECEPTORS.pptx
SOLUBLE PATTERN RECOGNITION RECEPTORS.pptxSOLUBLE PATTERN RECOGNITION RECEPTORS.pptx
SOLUBLE PATTERN RECOGNITION RECEPTORS.pptxkessiyaTpeter
 
Transposable elements in prokaryotes.ppt
Transposable elements in prokaryotes.pptTransposable elements in prokaryotes.ppt
Transposable elements in prokaryotes.pptArshadWarsi13
 

Recently uploaded (20)

Is RISC-V ready for HPC workload? Maybe?
Is RISC-V ready for HPC workload? Maybe?Is RISC-V ready for HPC workload? Maybe?
Is RISC-V ready for HPC workload? Maybe?
 
Hot Sexy call girls in Moti Nagar,🔝 9953056974 🔝 escort Service
Hot Sexy call girls in  Moti Nagar,🔝 9953056974 🔝 escort ServiceHot Sexy call girls in  Moti Nagar,🔝 9953056974 🔝 escort Service
Hot Sexy call girls in Moti Nagar,🔝 9953056974 🔝 escort Service
 
Temporomandibular joint Muscles of Mastication
Temporomandibular joint Muscles of MasticationTemporomandibular joint Muscles of Mastication
Temporomandibular joint Muscles of Mastication
 
Call Us ≽ 9953322196 ≼ Call Girls In Lajpat Nagar (Delhi) |
Call Us ≽ 9953322196 ≼ Call Girls In Lajpat Nagar (Delhi) |Call Us ≽ 9953322196 ≼ Call Girls In Lajpat Nagar (Delhi) |
Call Us ≽ 9953322196 ≼ Call Girls In Lajpat Nagar (Delhi) |
 
Grafana in space: Monitoring Japan's SLIM moon lander in real time
Grafana in space: Monitoring Japan's SLIM moon lander  in real timeGrafana in space: Monitoring Japan's SLIM moon lander  in real time
Grafana in space: Monitoring Japan's SLIM moon lander in real time
 
Call Girls In Nihal Vihar Delhi ❤️8860477959 Looking Escorts In 24/7 Delhi NCR
Call Girls In Nihal Vihar Delhi ❤️8860477959 Looking Escorts In 24/7 Delhi NCRCall Girls In Nihal Vihar Delhi ❤️8860477959 Looking Escorts In 24/7 Delhi NCR
Call Girls In Nihal Vihar Delhi ❤️8860477959 Looking Escorts In 24/7 Delhi NCR
 
Recombinant DNA technology( Transgenic plant and animal)
Recombinant DNA technology( Transgenic plant and animal)Recombinant DNA technology( Transgenic plant and animal)
Recombinant DNA technology( Transgenic plant and animal)
 
Bentham & Hooker's Classification. along with the merits and demerits of the ...
Bentham & Hooker's Classification. along with the merits and demerits of the ...Bentham & Hooker's Classification. along with the merits and demerits of the ...
Bentham & Hooker's Classification. along with the merits and demerits of the ...
 
Best Call Girls In Sector 29 Gurgaon❤️8860477959 EscorTs Service In 24/7 Delh...
Best Call Girls In Sector 29 Gurgaon❤️8860477959 EscorTs Service In 24/7 Delh...Best Call Girls In Sector 29 Gurgaon❤️8860477959 EscorTs Service In 24/7 Delh...
Best Call Girls In Sector 29 Gurgaon❤️8860477959 EscorTs Service In 24/7 Delh...
 
Call Girls in Munirka Delhi 💯Call Us 🔝9953322196🔝 💯Escort.
Call Girls in Munirka Delhi 💯Call Us 🔝9953322196🔝 💯Escort.Call Girls in Munirka Delhi 💯Call Us 🔝9953322196🔝 💯Escort.
Call Girls in Munirka Delhi 💯Call Us 🔝9953322196🔝 💯Escort.
 
zoogeography of pakistan.pptx fauna of Pakistan
zoogeography of pakistan.pptx fauna of Pakistanzoogeography of pakistan.pptx fauna of Pakistan
zoogeography of pakistan.pptx fauna of Pakistan
 
Speech, hearing, noise, intelligibility.pptx
Speech, hearing, noise, intelligibility.pptxSpeech, hearing, noise, intelligibility.pptx
Speech, hearing, noise, intelligibility.pptx
 
insect anatomy and insect body wall and their physiology
insect anatomy and insect body wall and their  physiologyinsect anatomy and insect body wall and their  physiology
insect anatomy and insect body wall and their physiology
 
TOPIC 8 Temperature and Heat.pdf physics
TOPIC 8 Temperature and Heat.pdf physicsTOPIC 8 Temperature and Heat.pdf physics
TOPIC 8 Temperature and Heat.pdf physics
 
Module 4: Mendelian Genetics and Punnett Square
Module 4:  Mendelian Genetics and Punnett SquareModule 4:  Mendelian Genetics and Punnett Square
Module 4: Mendelian Genetics and Punnett Square
 
Cytokinin, mechanism and its application.pptx
Cytokinin, mechanism and its application.pptxCytokinin, mechanism and its application.pptx
Cytokinin, mechanism and its application.pptx
 
Forest laws, Indian forest laws, why they are important
Forest laws, Indian forest laws, why they are importantForest laws, Indian forest laws, why they are important
Forest laws, Indian forest laws, why they are important
 
RESPIRATORY ADAPTATIONS TO HYPOXIA IN HUMNAS.pptx
RESPIRATORY ADAPTATIONS TO HYPOXIA IN HUMNAS.pptxRESPIRATORY ADAPTATIONS TO HYPOXIA IN HUMNAS.pptx
RESPIRATORY ADAPTATIONS TO HYPOXIA IN HUMNAS.pptx
 
SOLUBLE PATTERN RECOGNITION RECEPTORS.pptx
SOLUBLE PATTERN RECOGNITION RECEPTORS.pptxSOLUBLE PATTERN RECOGNITION RECEPTORS.pptx
SOLUBLE PATTERN RECOGNITION RECEPTORS.pptx
 
Transposable elements in prokaryotes.ppt
Transposable elements in prokaryotes.pptTransposable elements in prokaryotes.ppt
Transposable elements in prokaryotes.ppt
 

Cranberries and Water Quality_Nov2023 (1).pdf

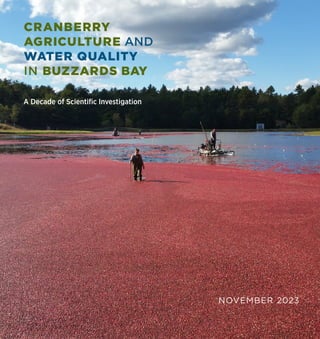
  • 1. NOVEMBER 2023 CRANBERRY AGRICULTURE AND WATER QUALITY IN BUZZARDS BAY A Decade of Scientific Investigation
  • 2. • Watershed management plans can be developed with confidence that there is adequate information about the amount of nitrogen and phosphorus that cranberry bogs contribute to downstream waters. • The slow steady flow coming out of bogs during most of the year should be targeted to most efficiently reduce the nitrogen washing downstream from cranberry bogs. • Restoring to natural wetlands actively farmed cranberry bogs that intercept high-nitrogen groundwater could significantly reduce the amount of nitrogen pollution that cranberry bogs currently contribute to the Wareham and Weweantic Rivers. • To maximize nutrient removal benefits, bogs that should be prioritized for restoration are flow-through bogs, bogs closest to the estuary, and those that intercept water carrying a lot of nitrogen from upstream developed areas. SUMMARY CONCLUSIONS PROJECT PARTNERS
  • 3. ACKNOWLEDGEMENTS This report captures work with a number of project partners and individuals. In addition to the authors, contributors to this work include: Carolyn DeMoranville, Krystal DeMoranville, Benjamin Hoekstra, Adrian Wiegman, Kirby Gilmore, Cass Gilmore, Matthew Beaton, Lindsay Scott, Richard McHorney, Megan Bartholomew, Paul Lefebvre, Jeffrey LaFleur, Richard LaFond, Sarah Hewins and the Town of Carver. We thank Joseph Costa of the Buzzards Bay National Estuary Program, Mark Rasmussen of the Buzzards Bay Coalition, and the staff of the Cranberry Station for their long-standing interest and support for work to quantify the role of cranberry bogs in nutrient movement within the watershed of Buzzards Bay. FINANCIAL SUPPORT This work was partially funded with Federal Funds from the Environmental Protection Agency (EPA) to the Massachusetts Department of Environmental Protection (MassDEP) under a s.604(b) competitive grant and under assistance agreement CE-96185701 to the Massachusetts Executive Office of Energy and Environmental Affairs Buzzards Bay National Estuary Program. Federal funding was also provided through the Woods Hole Sea Grant. Additional support was provided by the U.S. Department of Agriculture Agricultural Research Service to Casey Kennedy, by the University of Massachusetts Cranberry Station to Hilary Sandler, by the Buzzards Bay Coalition to Rachel Jakuba, and from the Northeast Climate Science Center, Marine Biological Laboratory and Woodwell Climate Research Center to Christopher Neill. Any views or opinions presented in this report are solely those of the authors and do not necessarily represent those of the Massachusetts Office of Coastal Zone Management, the Executive Office of Energy and Environmental Affairs, or the Commonwealth of Massachusetts. The contents do not necessarily reflect the views and policies of EPA or MassDEP, nor does the mention of trade names or commercial products constitute endorsement or recommendation for use. SUGGESTED CITATION Jakuba, R. W., Neill, C., Kennedy, C., Sandler, H., Wick, B., and B. Napolitano (2023) Cranberry agriculture and water quality in Buzzards Bay. A Decade of Scientific Investigation. 9pp. REFERENCES DeMoranville, C. and Howes, B. (2005) Final Report for Phosphorus Dynamics in Cranberry Production Systems: Developing the Information Required for the TMDL process for 303d water bodies receiving cranberry bog discharge, Project 01-12/319. Hoekstra, B. R., Neill, C., and Kennedy, C. D. (2019) Trends in the Massachusetts cranberry industry create opportunities for the restoration of cultivated riparian wetlands. Restoration Ecology. doi: 10.1111/re.13037. Howes, B. L., Teal, J. M. (1995) Nutrient Balance of a Massachusetts Cranberry Bog and Rela- tionships to Coastal Eutrophication. Environmental Science & Technology, 29 (4): 960–976. Howes, B., Samimy, R., Eichner, E., Schlezinger, D., Ramsey, J., and Kelley, S. W. (2014) Linked Watershed-Embayment Model to Determine Critical Nitrogen Loading Thresholds for the Wareham River, Broad Marsh and Mark’s Cove Embayment System, Wareham, Massachusetts. Kennedy, C., Neill, C., Jakuba, R. W., Napolitano, B. (2023) Final Report for Assessing Nutrient Reduction Scenarios in the Wareham River Watershed, Project 2018-04/604. Neill, C., Scott, L., Jakuba, R., Kennedy, C., DeMoranville, C. (2017) Final Report for Nutrient Balances in Southeastern Massachusetts Cranberry Bogs. Neill, C., Lefebvre, P., Hoekstra, B., Jakuba, R., Kennedy, C. (2021) Prioritizing restoration of cranberry bogs in Buzzards Bay, Massachusetts watersheds using a stream network model. Oral presentation. Coastal and Estuarine Research Federation 26th Biennial Conference. Town of Carver, Buzzards Bay Coalition, Marine Biological Laboratory, University of Massachusetts Cranberry Station (2015) Final Report for Cranberry Bog Nutrient Loss Study, Project 2011-03/604. Valiela, I., Collins, G., Kremer, J., Lajtha, K., Geist, M., Seely, B., Brawley, J., Sham, C. H. (1997), Nitrogen loading from coastal watersheds to receiving estuaries: New method and application. Ecological Applications, 7, 358–380. Williamson, S. C., Rheuban, J. E., Costa, J. E., Glover, D. M., Doney, S. C. (2017), Assessing the impact of local and regional influences on nitrogen loads to Buzzards Bay, MA. Frontiers in Marine Science, 3: 1– 17. Wollheim, W. M., Vorosmarty, C. J., Peterson, B. J., Seitzinger, S. P., Hopkinson, C. S. (2006) Relationship between river size and nutrient removal. Geophysical Research Letters, 33: L06410. 1 Discharge of nitrogen and phosphorus pollutes freshwater ponds, streams, and rivers and the saltwater bays and harbors of Buzzards Bay. In fresh waters, phosphorus, or phosphorus in combination with nitrogen, triggers excess algae growth. In salt waters, nitrogen leads to an overabundance of algae. Most of the nitrogen pollution that reaches Buzzards Bay comes from septic systems, wastewater treatment plants, and road runoff. However, in parts of the watershed where there are dense concentrations of cranberry bogs, bogs can contribute significant amounts of nutrients. This report describes work by the Buzzards Bay Coalition and partner organizations committed to protecting water quality in Buzzards Bay. The work was supported by a series of grants over 10 years. The goal was to improve understanding of how cranberry bogs contribute to nutrient pollution of coastal watersheds and to use this understanding to inform management actions that minimize nutrient discharges and maximize nutrient removal. ABOUT THIS REPORT
  • 4. BACKGROUND sources of water to irrigate bogs, protect cranberry plants from frost, and flood the bogs for harvest. Water that leaves cranberry bogs may carry with it nitrogen and phosphorus that come in part from fertilizer that is applied to bogs to help cranberries grow. Nutrients released from cranberry bogs then travel in groundwater, streams, and rivers to Buzzards Bay. The Weweantic River and Wareham River Watersheds contain more than 9,000 acres of cranberry bogs. In total, cranberry bogs are estimated to account for roughly 30% of the 2 Cranberries are wetland plants that have been harvested for food, medicine, and dyes dating to before Europeans colonized North America. Cranberry bogs have historically been an important part of the landscape, heritage, and local economy of southeastern Massachusetts. Approximately 20% of the nation’s cranberry crop is produced within Massachusetts and much of that occurs within the watershed of Buzzards Bay (51%). Cranberry agriculture is intimately connected to natural waterways. Growers use ponds and rivers as nitrogen pollution to the Weweantic River and 20% to the Wareham River (residential septic systems are the major source of nitrogen to both rivers). Nitrogen pollution has plagued these estuaries for years. In the Wareham River, the Massachusetts Estuaries Project determined that close to 40% of the total nitrogen load to the river needs to be reduced to restore clean water (Howes et al., 2014). New technology and cranberry cultivars have led to the recent, rapid expansion of the cranberry industry in other parts of North America. Massachusetts cranberry farmers face fruit prices that are not keeping up with increasing costs, and generally low yields from bogs still planted with native cranberry cultivars. Farmers have to decide whether it makes sense to invest in renovating bogs with updated technology and hybrid cultivars that bring higher yields, produce high-value berries, and require less water. Less productive bogs have the potential to be retired and restored to natural wetlands where they could serve as sinks that absorb and remove nutrients. Retired bogs are those where farming no longer occurs. Restored bogs are those where additional steps are taken to return the bog to a natural wetland. ACTIVE CRANBERRY BOGS BUZZARDS BAY WATERSHED WEWEANTIC RIVER WATERSHED WAREHAM RIVER WATERSHED
  • 5. Beginning in 2011, the Buzzards Bay Coalition, U.S. Department of Agriculture Agricultural Research Service (USDA), Woodwell Climate Research Center, University of Massachusetts (UMass) Cranberry Station, Cape Cod Cranberry Growers’ Association, Marine Biological Laboratory, Southeastern Regional Planning & Economic Development District, and the Town of Carver began collaborating to quantify how cranberry agriculture affects downstream waters. The work involved both field sampling and improving watershed models. Local farmers facilitated sampling on their farms. THE RESEARCH 2) Modeling how cranberry bogs impact watershed nutrients – Using watershed models we estimated the amount of nitrogen from all watershed sources, includ- ing cranberry bogs, in the Wareham River watershed. We used models to estimate nitrogen that reaches Buzzards Bay from bogs in different places in the watershed as the water moves through creeks and streams on its way to the estuary. 3) Potential water quality benefits of restoring natural wetlands at current cranberry bogs – We used models to estimate the potential nitrogen removal that might be achieved by restoring some cranberry bogs to natu- ral wetlands, which are excellent at retaining nutrients. Research Summary – Our studies covered three main research areas: 1) Measuring nutrient releases from cranberry bogs, 2) Modeling how cranberry bogs impact overall watershed nutrients, and 3) Potential water quality benefits of restoring natural wetlands at current cranberry bogs. 1) Measuring nutrient releases from cranberry bogs – We used field studies of water, nitrogen, and phosphorus movement on multiple cranberry farms to quantify the magnitude of nutrient inputs and outputs and nutrient movement in different phases of cranberry crop management. 3
  • 6. RESEARCH AREA 1 Measuring Nutrient Releases from Cranberry Bogs Background Prior to our work, only two studies had estimated how much nitrogen or phosphorus is released from cranberry bogs (DeMoranville and Howes, 2005; Howes and Teal, 1995). One study focused on a flow-through bog, which is a type of bog where a river channel flows through the bog. Flow- through bogs represent only about 20% of the bogs in Massachusetts (Hoekstra et al., 2019).The other study looked at six traditional wetland-type bogs.Wetland-type bogs, rather than lining a river channel, are set in areas that were former wetlands, often on the edges of forest or near ponds and are connected to streams by ditches or channels. These studies showed losses of nitrogen and phosphorus were higher for the flow-through bogs than traditional wetland bogs. However, there was a wide range of outputs across bogs that made it hard to develop bog management strategies to reduce watershed nutrient pollution. Methods We monitored nitrogen and phosphorus inputs and outputs in traditional wetland bogs that all had similar fertilizer amounts applied. In an initial study, we monitored six bogs for one-and-a-half years with surface water samples collected by hand from the bog inlets and outlets. Because previous research suggested that flood events accounted for most of the annual nutrient loss, the initial study focused on flood events. To get a more complete understanding of the nutrient losses over the whole year, we then carefully tracked the amount of water moving into and out of three bogs and the nitrogen and phosphorus concentrations of that water. We instrumented these bogs with automated samplers that collected water more frequently than was possible by hand. For one year, the samplers collected water during flood releases and during low flows between floods. The samplers were set to collect samples daily during most of the year when the bogs were not flooded. During fall harvest floods and winter freeze protection floods, we programmed samplers to collect frequently (every 20 minutes) when water volumes were changing fast and less frequently (every several hours) when less water was moving. The volumes of water that moved during floods were estimated with water level and flow recorders. We paired the water flow data with measured nutrient concentrations to calculate how much nitrogen and phosphorus moved downstream during floods and during the rest of the year. Results By comparing six bogs, we found that the variation in nitrogen concentrations leaving the bogs was influenced more by nitrogen sources in the watershed and how much water flows through a bog than by cranberry management. Although there was variability among bogs, the nitrogen exiting the six bogs was close to that estimated for wetland bogs from other studies (Town of Carver, 2015). The more detailed sampling of three bogs showed similar variability (Neill et al., 2017). Net stream transport of nitrogen averaged 3.1 lb/ac (range of -0.1 to 11.3 lb/ac). This provided greater certainty about nutrient loading rates that should be used in watershed planning. We found a smaller range of phosphorus concentrations among the bogs than for nitrogen concentrations.The amount of phosphorus washing downstream from the bogs (1.9 to 4.0 lb/ac, average of 2.7 lb/ac) was similar to or slightly higher than measured in previous studies.The amount of nitrogen fertilizer applied is well-balanced with the amount of nitrogen in the crop harvest. The automated samplers deployed at three bogs revealed how much nitrogen and phosphorus was leaving the bogs during different times of year.The small, steady trickle of water that left the bogs during non-flooding times accounted for the majority of the water flowing downstream. 4
  • 7. Nitrogen Export Phosphorus Export Because most of the annual nitrogen and phosphorus losses occurred during non-flooding times, management measures aimed at nutrient removal from the small but steady outflows during non-flood periods could be beneficial. Such management might include additional storage time in ponds or increased naturalization of stream channels to enhance nitrogen uptake and denitrification. Bogs discharging higher amounts of flow are good targets for nutrient removal measures because larger amounts of nitrogen and phosphorus are passing through them. Though the concentrations of nitrogen and phosphorus in this trickle were generally low, because the amount of water added up over the course of the year, the steady trickle made up the largest fraction of both nitrogen and phosphorus released downstream. The amount of nitrogen and phosphorus released in the steady of trickle of water leaving the bogs is linked to how much water the steady trickle represented, which was influenced by where a bog sits in the landscape. Some bogs were very wet and water flowed through their ditches constantly. Others bogs had ditches that were mostly dry or with water that was not flowing.Two of the bogs studied had groundwater springs that brought water into the bogs over the course of a year, while the third bog did not. The difference in the amount of nutrients washed downstream between bogs was primarily related to how much water moved through the bog systems rather than specific farming practices. One bog was fed with a particularly large amount of natural groundwater input from springs. The larger amount of water flow resulted in higher overall amounts of nutrients washing downstream from this bog. Management Implications This work improved our estimates of how much nitrogen and phosphorus are released from cranberry bogs.This provides confidence that the estimates can be used for effectively developing nitrogen reduction management plans such as Total Maximum Daily Loads (TMDLs) required by the Clean Water Act. HARVEST FLOOD WINTER FLOOD GROUNDWATER STREAM FLOW Nitrogen Export 5 17% 75% 63.5% 27% 2% 6% 2.5% 7% above Diagrams show the annual movement of nitrogen (top) and phosphorus (bottom) through cranberry bogs. Numbers are the average of three bogs in pounds nitrogen or phosphorus per acre. Nitrogen and phosphorus are deposited on bogs through application of fertilizer, precipitation, water pumped onto the bogs through irrigation and during harvest and winter floods, and from groundwater flowing into the bogs. Nitrogen and phosphorus flow out of bogs by removal of berries and leaves during harvest, when flood waters are released, and when water on the bog soaks into the groundwater or flows from the ditches into streams. Nitrogen Balance Phosphorus Balance Groundwater Harvest and winter floods Harvest biomass Fertilizer Precipitation Irrigation Stream flow (0.3) (3.1) (7.9) (3.2) (2.4) 14.8 (4.7) 31.6 27.4 Groundwater Harvest and winter floods Harvest biomass Fertilizer Precipitation Irrigation Stream flow (0.1) (0.5) (0) (0.2) (0.2) 2.3 (1.2) 4.1 6.6 Groundwater Harvest and winter floods Harvest biomass Fertilizer Precipitation Irrigation Stream flow (0.3) (3.1) (7.9) (3.2) (2.4) 14.8 (4.7) 31.6 27.4 Groundwater Harvest and winter floods Harvest biomass Fertilizer Precipitation Irrigation Stream flow (0.1) (0.5) (0) (0.2) (0.2) 2.3 (1.2) 4.1 6.6
  • 8. 6 RESEARCH AREA 2 Modeling How Cranberry Bogs Impact Watershed Nutrients Background Nitrogen pollution comes from a number of sources. To understand the importance of any nutrients coming from cranberry bogs, it is necessary to compare them with other nutrient sources in the watershed. Models are effective tools for estimating the amount of nutrients different sources contribute to a waterbody. The Wareham and Weweantic River watersheds are the two watersheds in Southeastern Massachusetts that have the most cranberry farm acreage. We used the Wareham River as a case study to model how nutrients that enter the watershed from cranberry agriculture contribute to nutrient pollution downstream in the estuary. Methods We used a well-established model called the Nutrient Loading Model (NLM), to estimate how much nitrogen reaches waterbodies (Valiela et al., 1997). Nitrogen loads are based on detailed information about the watershed and studies of how much nitrogen comes from different features in the landscape (e.g., residential areas, sew- age treatment plants, the atmosphere, natural areas, and agriculture). The NLM model has been regularly used in Southeastern Massachusetts over the last 20 years. For this study, new data were collected on the concentration of nitrogen coming from rain. Recent reports (2016-2018) were obtained on how much nitrogen is released from the Wareham Pollution Control Facility. Cranberry fertil- izer rates were estimated based on a survey of cranberry growers in the watershed. The NLM model estimates how much nitrogen reaches surface waters. We paired the NLM with a stream chan- nel model (Wollheim et al., 2006) to see what happens to the nitrogen once it reaches the water and moves down- stream through progressively larger streams to the Bay. The stream channel model uses information about the size of different stream and river stretches to estimate how much nitrogen will be taken up by plants and microbes as the water moves in stream channels filled with plants and organic matter. Both of these models estimate the nitrogen moving through the system but not phosphorus. Phosphorus sticks to soils and sediments so it does not travel as easily downstream as nitrogen. As a result, phosphorus is not as large a problem as nitrogen at the watershed scale, and there are currently no plans to create watershed scale management plans for phosphorus. We therefore focused only on nitrogen since it poses the most concern at the watershed scale. above UMass Cranberry Station scientists collect groundwater samples near a bog.
  • 9. 7 Nitrogen Sources to the Wareham River Management Implications Cranberry bogs are an important source of nitrogen to the Wareham River. As watershed management plans are developed to reduce nitrogen, the impact of cranberry agriculture should be considered.This could include encouraging or incentivizing best practices that prevent nitrogen from washing downstream from bogs such as creating storage ponds, naturalizing stream channels, or avoiding fertilizer application prior to predicted rain. Our work focused on cranberry varieties that have been most abundant in Southeastern Massachusetts. However, the industry is beginning to transition bogs to newer varieties that yield more fruit. Researchers at the UMass Cranberry Station/USDA are studying the potential impact of these newer varieties. Results The updated NLM modeling showed that cranberry bogs accounted for about 20% of the nitrogen flowing into the Wareham River (Kennedy et al., 2023), which is similar to previous estimates (Howes et al., 2014; Williamson et al., 2017). However, not all bogs contributed equal amounts of nitrogen. Flow-through type bogs that line river channels release more nitrogen than wetland bogs that connect to water bodies through streams or ditches. As water travels from bogs to small streams that connect with larger streams and eventually the Wareham River, some of the nitrogen from the bogs is used by aquatic plants and bacteria. This uptake by plants and bacteria helps to reduce the impact of nitrogen from cranberry bogs. We estimated that currently, two-thirds of the nitrogen leaving the bogs in the Wareham River watershed is removed by uptake by plants and bacteria as the water moves through natural streams and wetlands (Neill et al., 2021). CRANBERRY FERTILIZER SEPTIC SYSTEMS ATMOSPHERIC DEPOSITION LAWN FERTILIZER WASTEWATER TREATMENT PLANT above Water samples collected from a bog are filtered prior to laboratory analysis for nitrogen and phosphorus. 21% 30% 24% 9% 16%
  • 10. RESEARCH AREA 3 Potential Water Quality Benefits Of Restoring Natural Wetlands At Current Cranberry Bogs Background The evolving economics of cranberry agriculture is leading some growers to retire a portion of their bogs currently in production that are more difficult to farm or less profitable in order to modernize farm operations, invest in new, high- yield cranberry cultivars, and prioritize higher-performing bogs. At the same time, the Massachusetts Division of Ecological Restoration has developed techniques for restoring retired cranberry bogs to naturalized wetlands. Wetland restoration provides ecological benefits including nutrient removal, improved habitat for birds, fish, amphibians and reptiles, greater natural floodwater storage, and locations for recreation and access to nature. State and federal programs currently provide funding to retire farmland and restore some retired bogs to natural wetlands. At the same time, towns are under pressure to reduce nitrogen pollution to estuaries.We wanted to understand how much nitrogen could be reduced by restoring bogs to natural wetlands in the Wareham River watershed. How retirement and restoration of cranberry bogs may influence phosphorus in the watershed was not studied since there are currently no management plans targeting phosphorus reduction at the watershed scale. Methods We classified all the bogs in the Wareham River watershed using aerial photographs to determine whether they were flow-through, traditional non-flow-through, or newly renovated or newly constructed non-flow-through. They were also classified based on what size stream they connected to. The amount of nitrogen released downstream from all the bogs was calculated based on the total area of each type of bog and whether the water traveled through natural streams and wetlands. We then developed scenarios to test how retiring or restoring bogs would impact the amount of nitrogen flowing to the Wareham River estuary. When a cranberry bog is retired from active farming, fertilizer is no longer applied, which reduces nitrogen inputs, though the amount of nitrogen leaving the system as harvested cranberries is also reduced.Wetlands have the potential to remove substantial amounts of nitrogen, but even bogs that were originally built in wetlands do not necessarily revert to wetlands when farming stops. Because cranberry farming involves adding layers of sand to bogs, which raises the height of bogs over time, many retired bogs naturally turn into forest or shrubland rather than wetlands. Active restoration of cranberry bogs aims to disturb the top soil layer, exposing the organic material below and create more natural stream channels to encourage retired bogs to become wetlands. 8 above Drone image of the Coonamessett River where former flow- through cranberry bogs have been restored to natural wetlands. Photo credit: Adam Soule
  • 11. 9 9 Management Implications Retiring and restoring cranberry bogs could be a valuable part of the overall management plan for reducing nitrogen pollution to the Wareham River. A targeted strategy for restoration could reduce nitrogen to the Wareham River estuary by about 10%, which is one-quarter of the overall reduction needed to restore water quality.To maximize nutrient removal benefits, bogs that should be prioritized for restoration are flow-through bogs, bogs closest to the estuary, and those that intercept upstream water carrying high levels of nitrogen from developed areas. Results The location and type of bogs that are retired or restored had an important impact on the potential nitrogen benefit of retiring and restoring bogs. If all of the flow-through type bogs in the Wareham River watershed (which represent 19% of the total bog area) were restored, it would cut the amount of nitrogen from cranberry bogs making it to the Wareham River estuary by about 40%, which represents a reduction of overall nitrogen to the watershed of about 10% (Kennedy et al., 2023). With wetland type non-flow-through bogs, targeting bogs in specific locations can greatly influence how much nitrogen makes it to the estuary. For example, restoration of randomly selected bogs or bogs that are high in the watershed that connect through many streams to the estuary will have only a small impact on the nitrogen reaching the Wareham River estuary. Restoring bogs close to the estuary will have a greater reduction in nitrogen pollution to the estuary than those farther away. More nitrogen makes it to the estuary from bogs close to the estuary because there is less time for the nitrogen from these bogs to be taken up by plants and bacteria in streams and channels (Neill et al., 2020). Restoration of wetlands on retired bogs has the potential to remove not just fertilizer from cranberry bogs, but any source of nitrogen that moves through wetlands as surface water and groundwater. Some cranberry bogs are in locations where they intercept surface and groundwater flowing from residential areas that contains high amounts of nitrogen. Restoring bogs that intercept high nitrogen groundwater would yield a high benefit relative to the area of cranberry bogs restored. By restoring less than half the acreage of flow-through bogs, restoring bogs that intercept high nitrogen groundwater would result in a slightly greater percentage of nitrogen reduction to the estuary (12%) than restoring all the flow-through bogs (Kennedy et al., 2023). Relative Watershed Nitrogen Load (%) 100 75 50 25 0 Watershed N Load Current 350 262.5 175 87.5 0 Area to be Restored (acres) Retire all flow-through Retire and restore all flow-through Retire and restore bogs that intercept high nitrogen groundwater Scenarios Restored Area above The blue bars show model results for the nitrogen loading to the Wareham River under current conditions (100%) and under three scenarios for retiring and restoring bogs. The red bars indicate the acres of bogs that would be restored under each scenario.
  • 12. 114 Front Street • New Bedford, Massachusetts 02740 (508) 999-6363 info@savebuzzardsbay.org www.savebuzzardsbay.org • Watershed management plans can be developed with confidence that there is adequate information about the amount of nitrogen and phosphorus that cranberry bogs contribute to downstream waters. • The slow steady flow coming out of bogs during most of the year should be targeted to most efficiently reduce the nitrogen washing downstream from cranberry bogs. • Restoring to natural wetlands actively farmed cranberry bogs that intercept high- nitrogen groundwater could significantly reduce the amount of nitrogen pollution that cranberry bogs currently contribute to the Wareham and Weweantic Rivers. • To maximize nutrient removal benefits, bogs that should be prioritized for restoration are flow-through bogs, bogs closest to the estuary, and those that intercept water carrying a lot of nitrogen from upstream developed areas. SUMMARY CONCLUSIONS