Downloaded 703 times

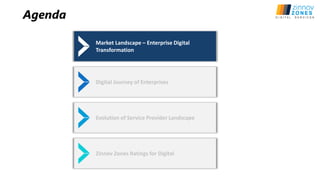
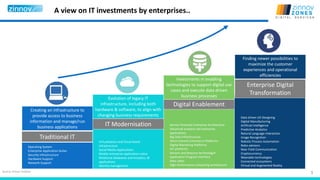
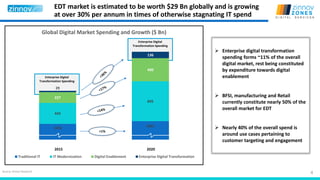
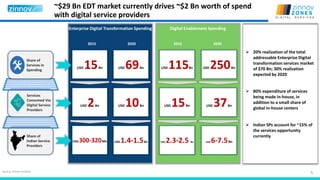
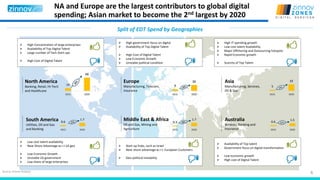
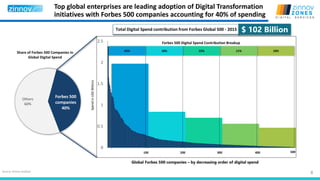
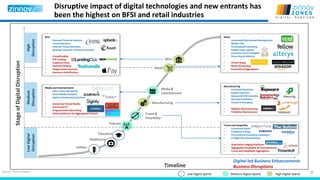
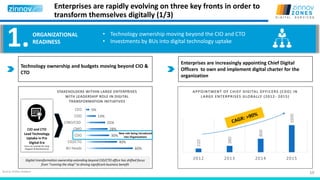
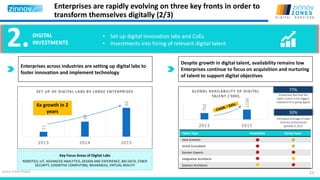
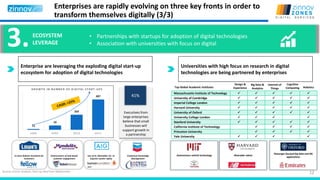
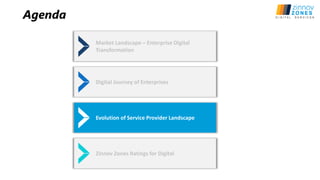
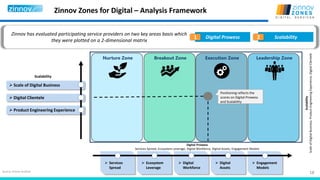
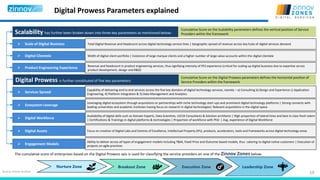
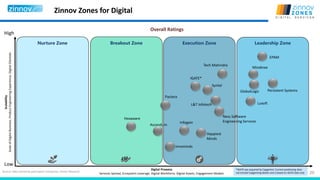
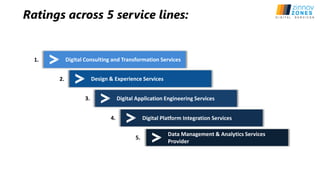
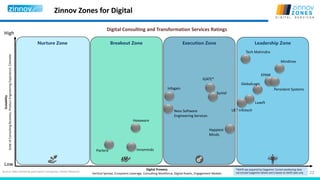
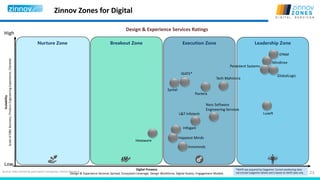
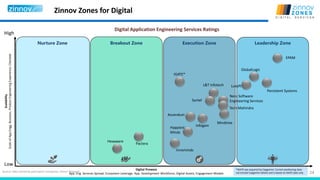


This document discusses Zinnov Zones ratings for digital services and the enterprise digital transformation landscape. It covers three key areas: the digital journey of enterprises and their evolving organizational structure, investments, and ecosystem leverage; the market landscape for enterprise digital transformation and trends in spending; and the evolution of the service provider landscape and their ratings in Zinnov Zones for digital capabilities.


![[Flevy.com Free Download] Digital Transformation Strategy Primer.ppt](https://cdn.slidesharecdn.com/ss_thumbnails/flevy-241013210140-abd44410-thumbnail.jpg?width=640&height=640&fit=bounds)


![Getting Started with Apache Spark: Big Data Made Simple [Free Meetup]](https://cdn.slidesharecdn.com/ss_thumbnails/apachesparkgettingstarted-260203175547-8361bcc3-thumbnail.jpg?width=640&height=640&fit=bounds)


