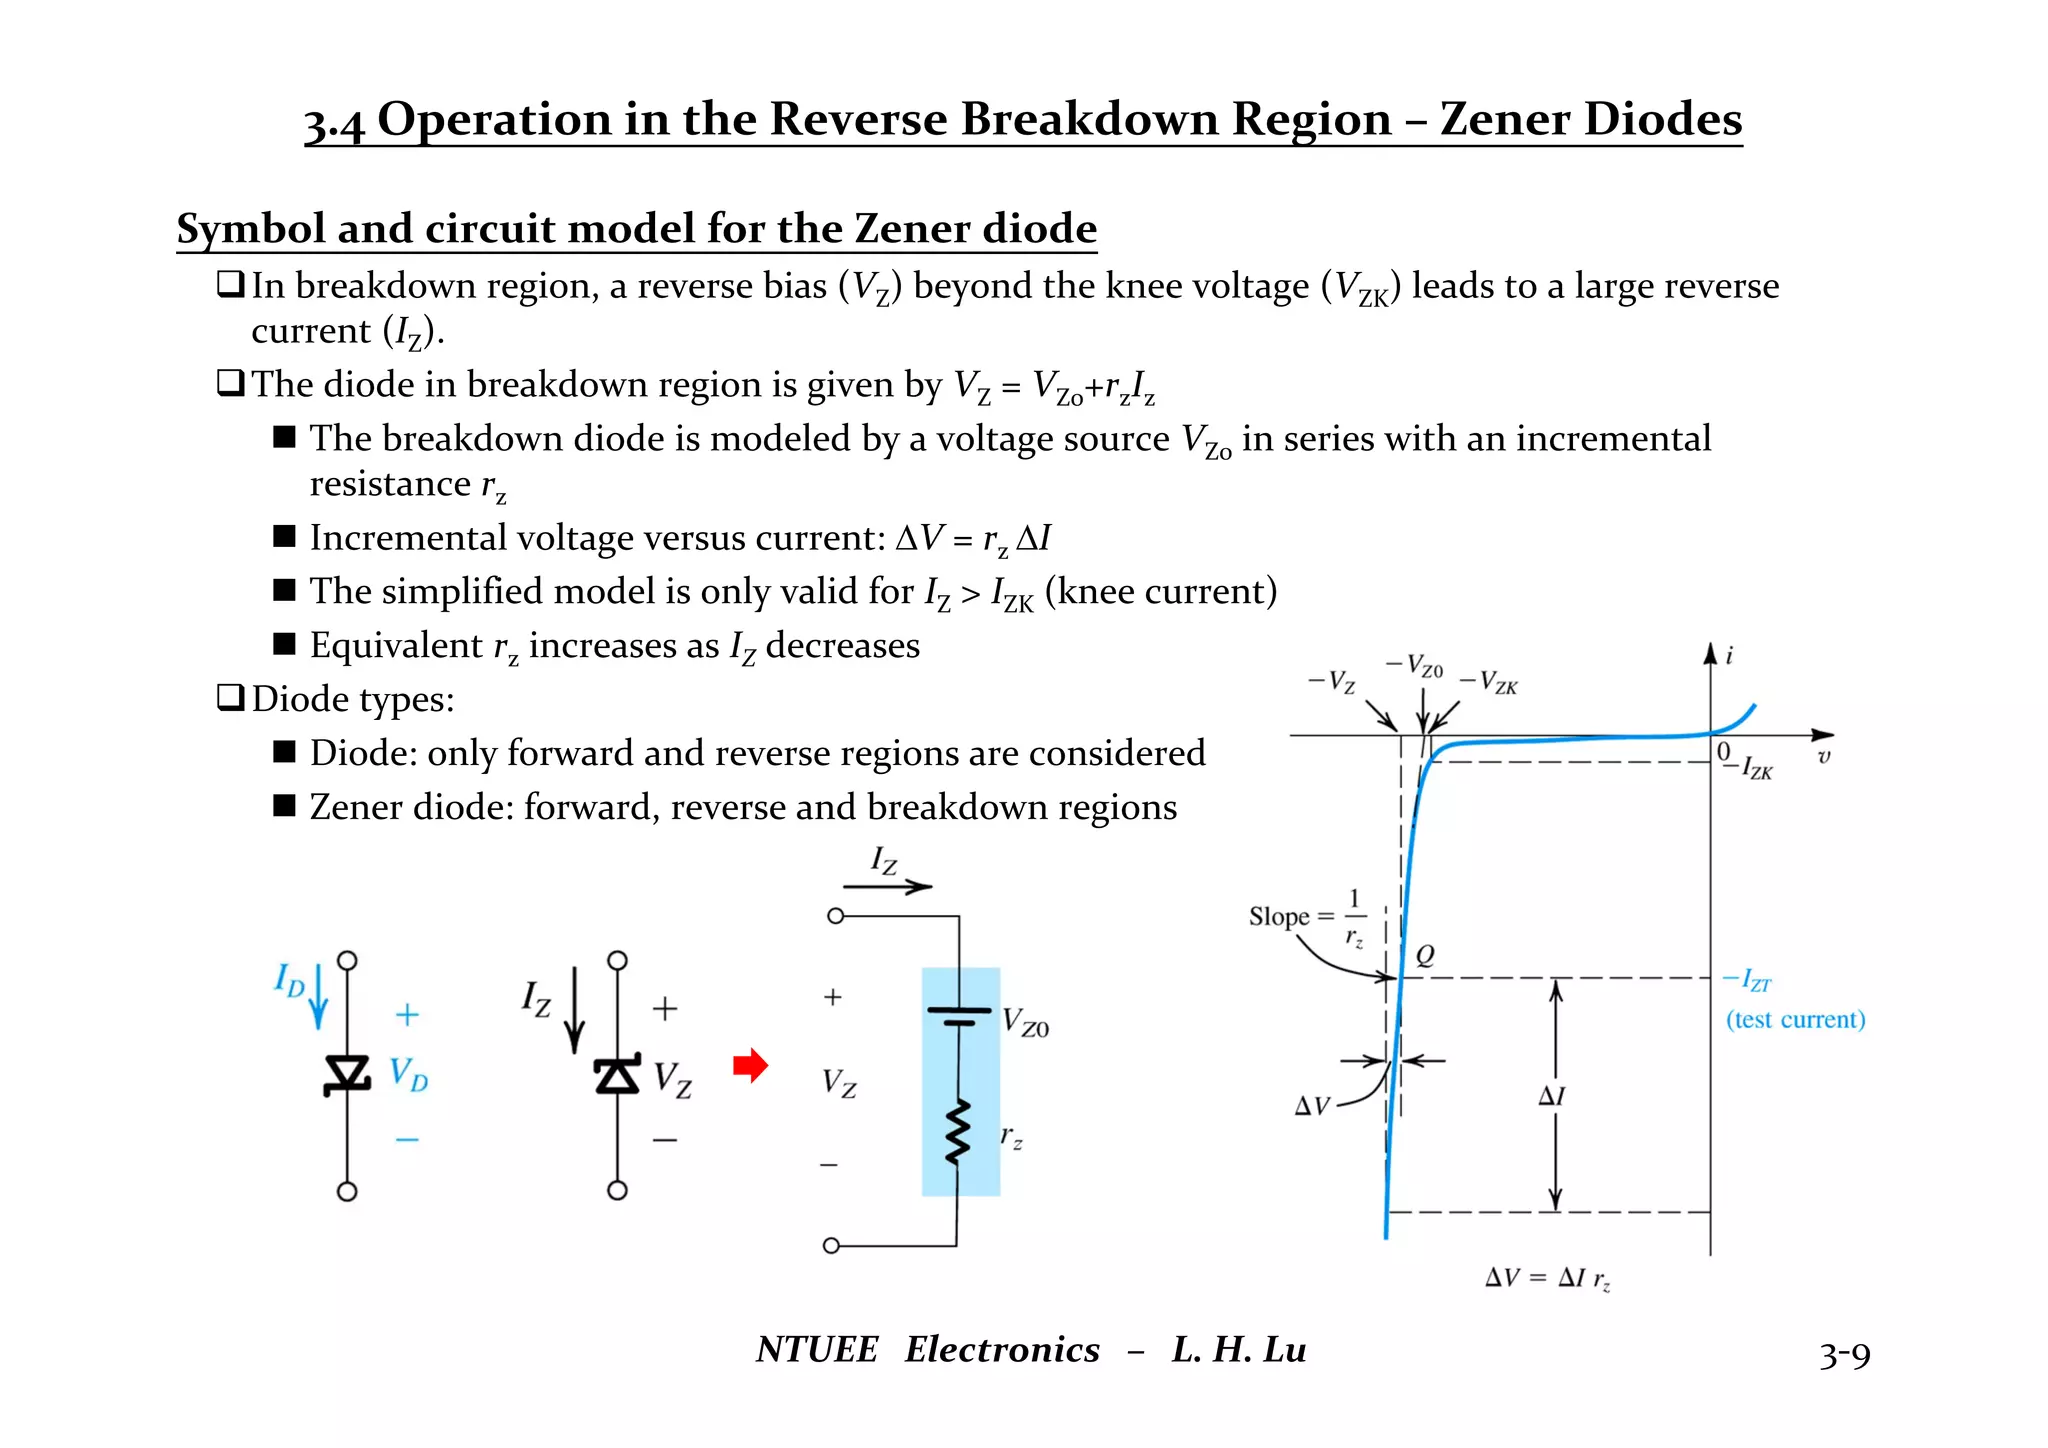
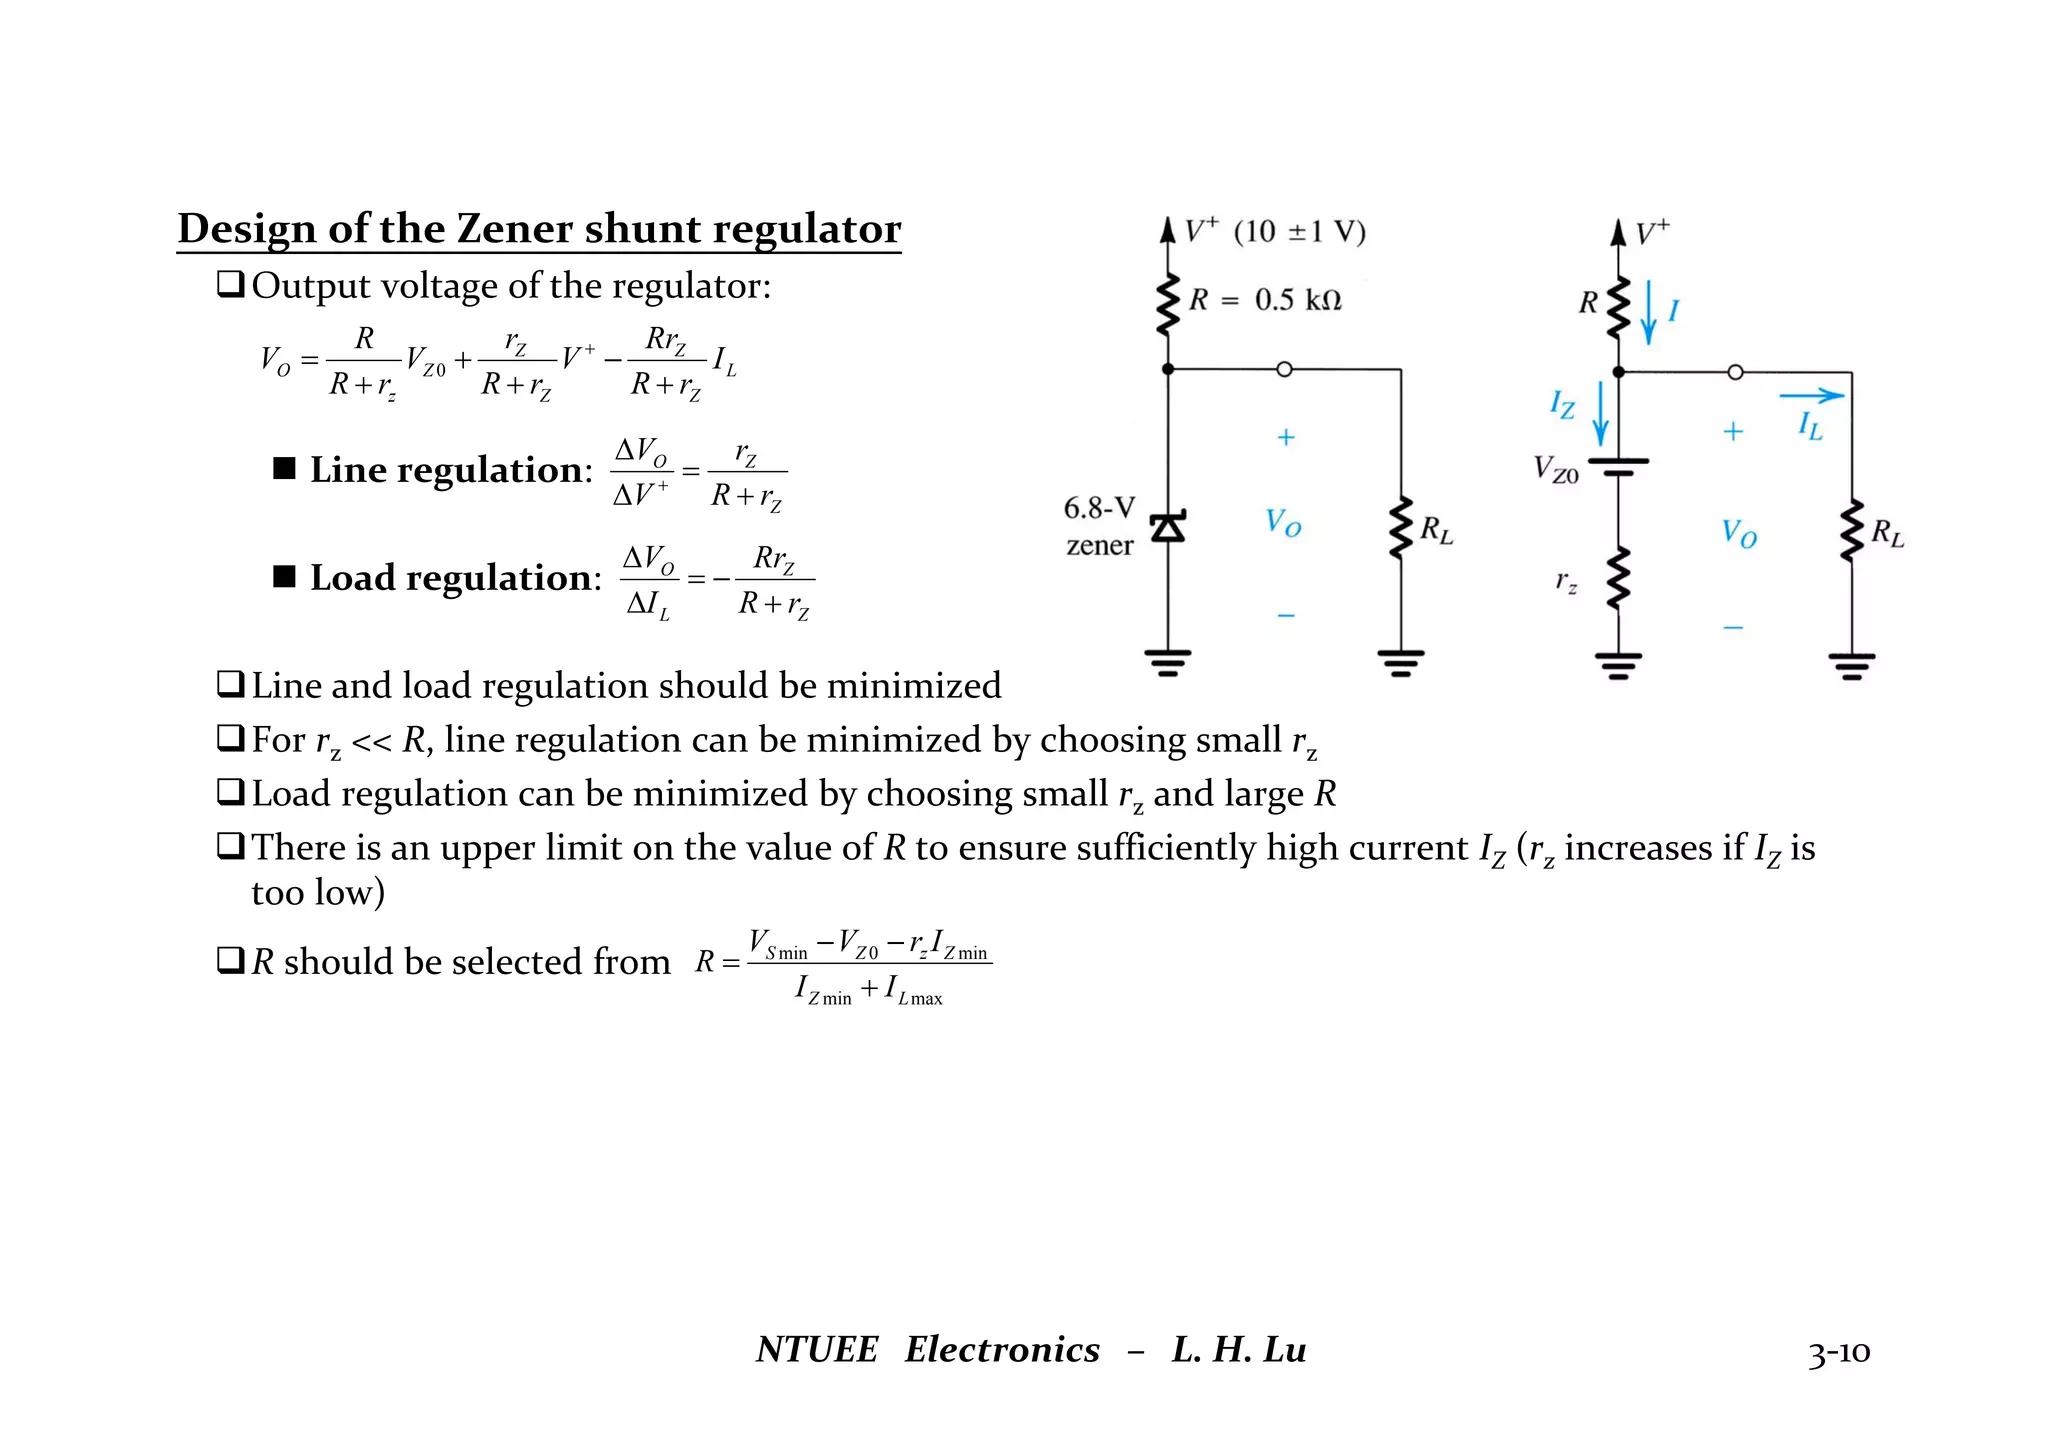
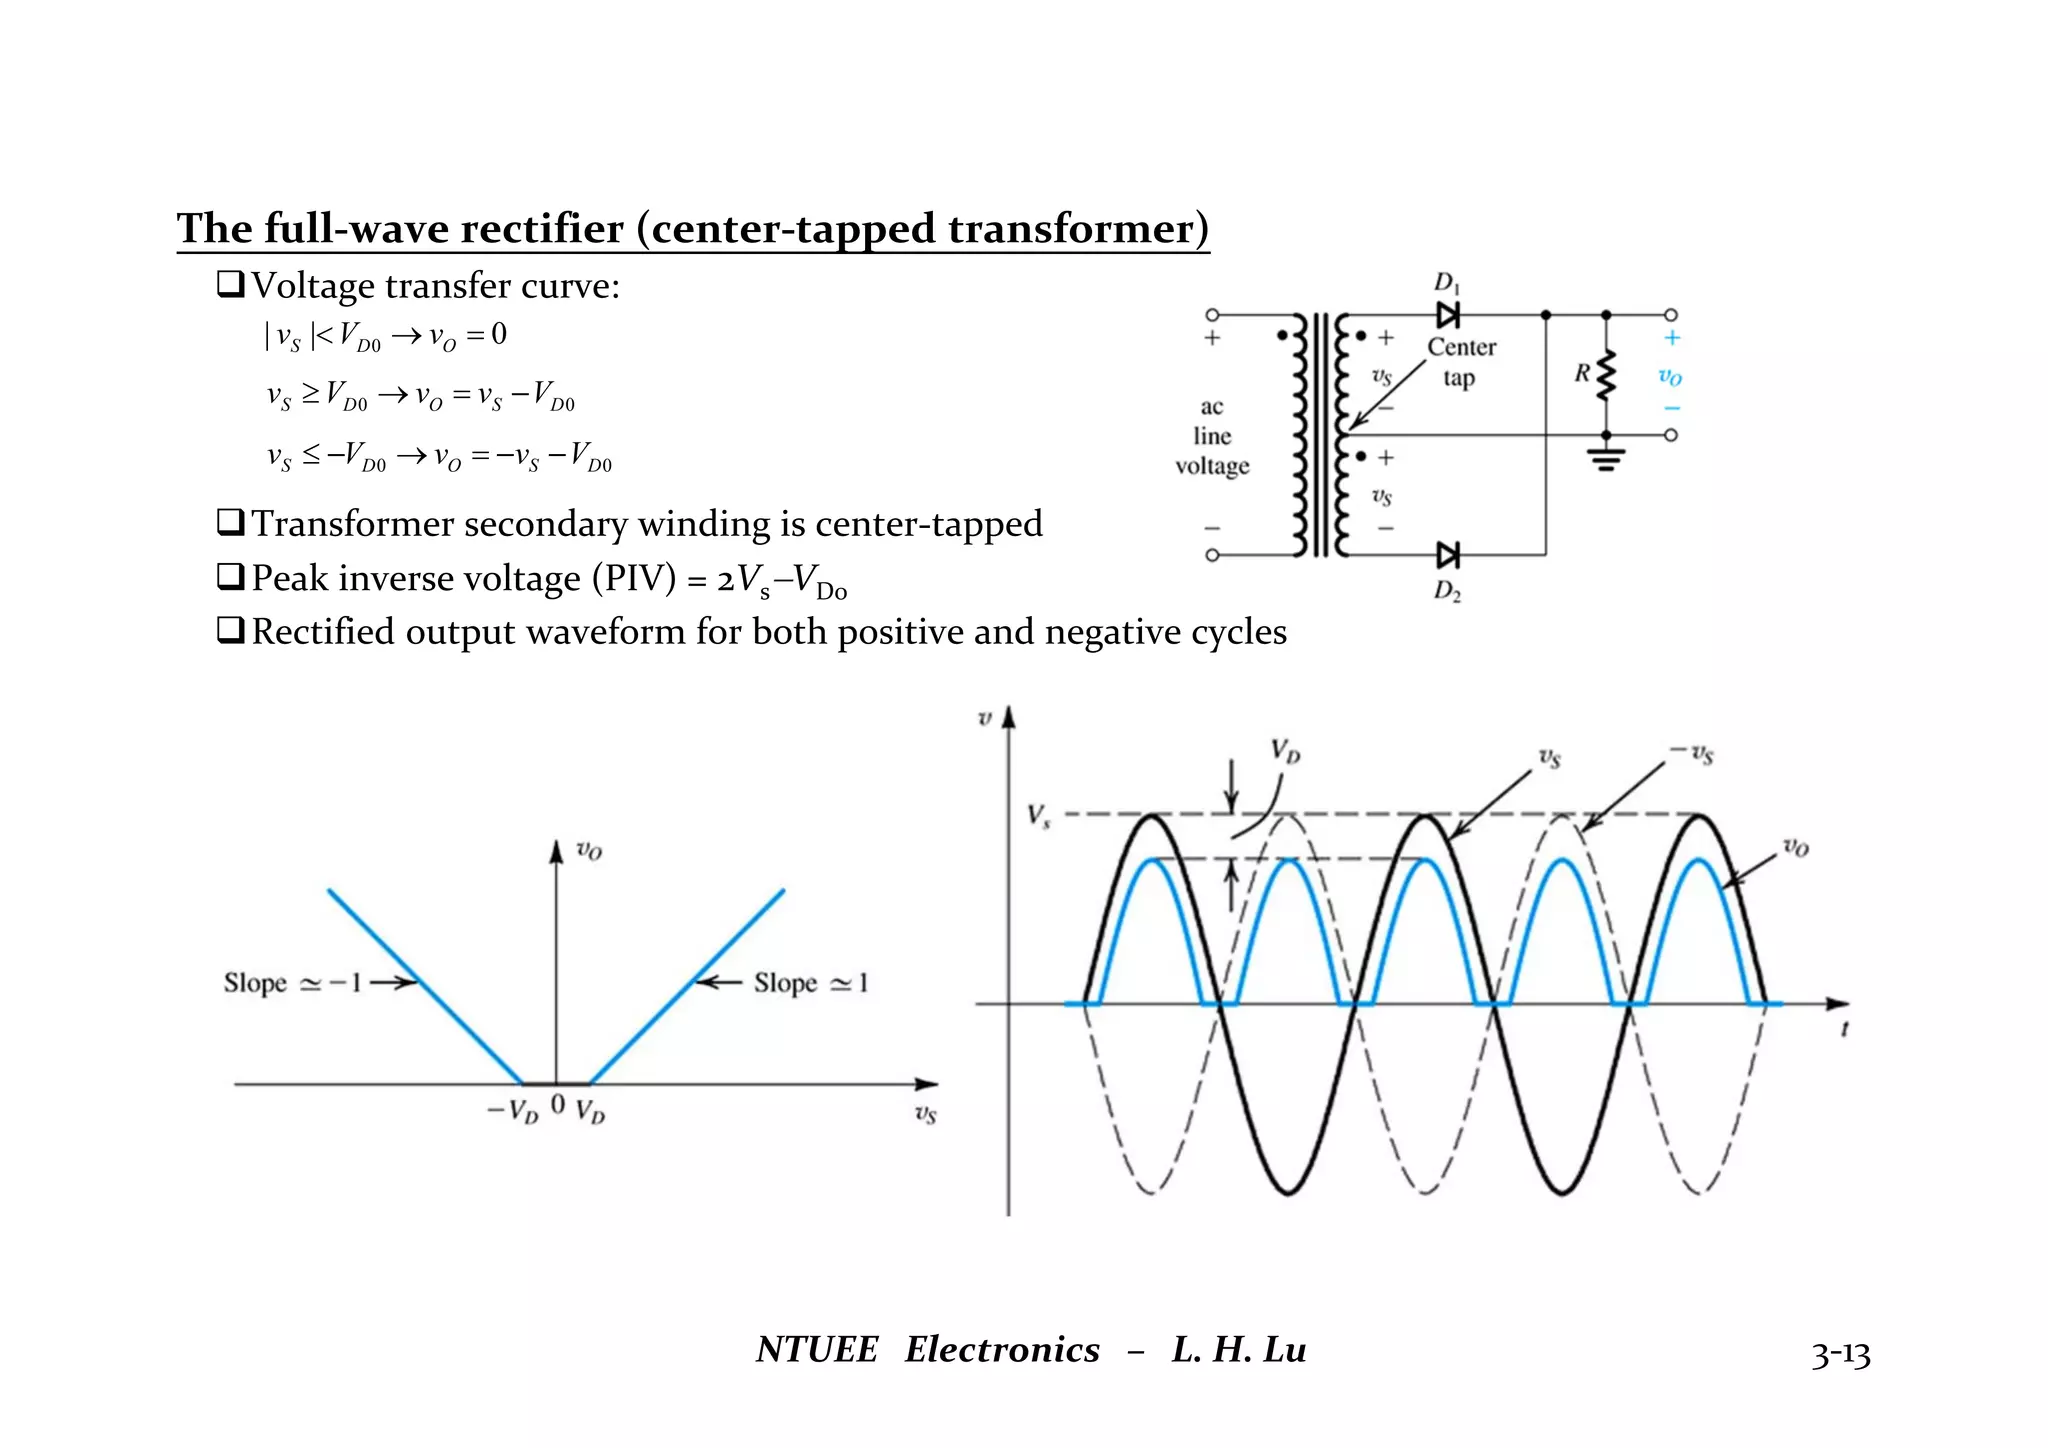
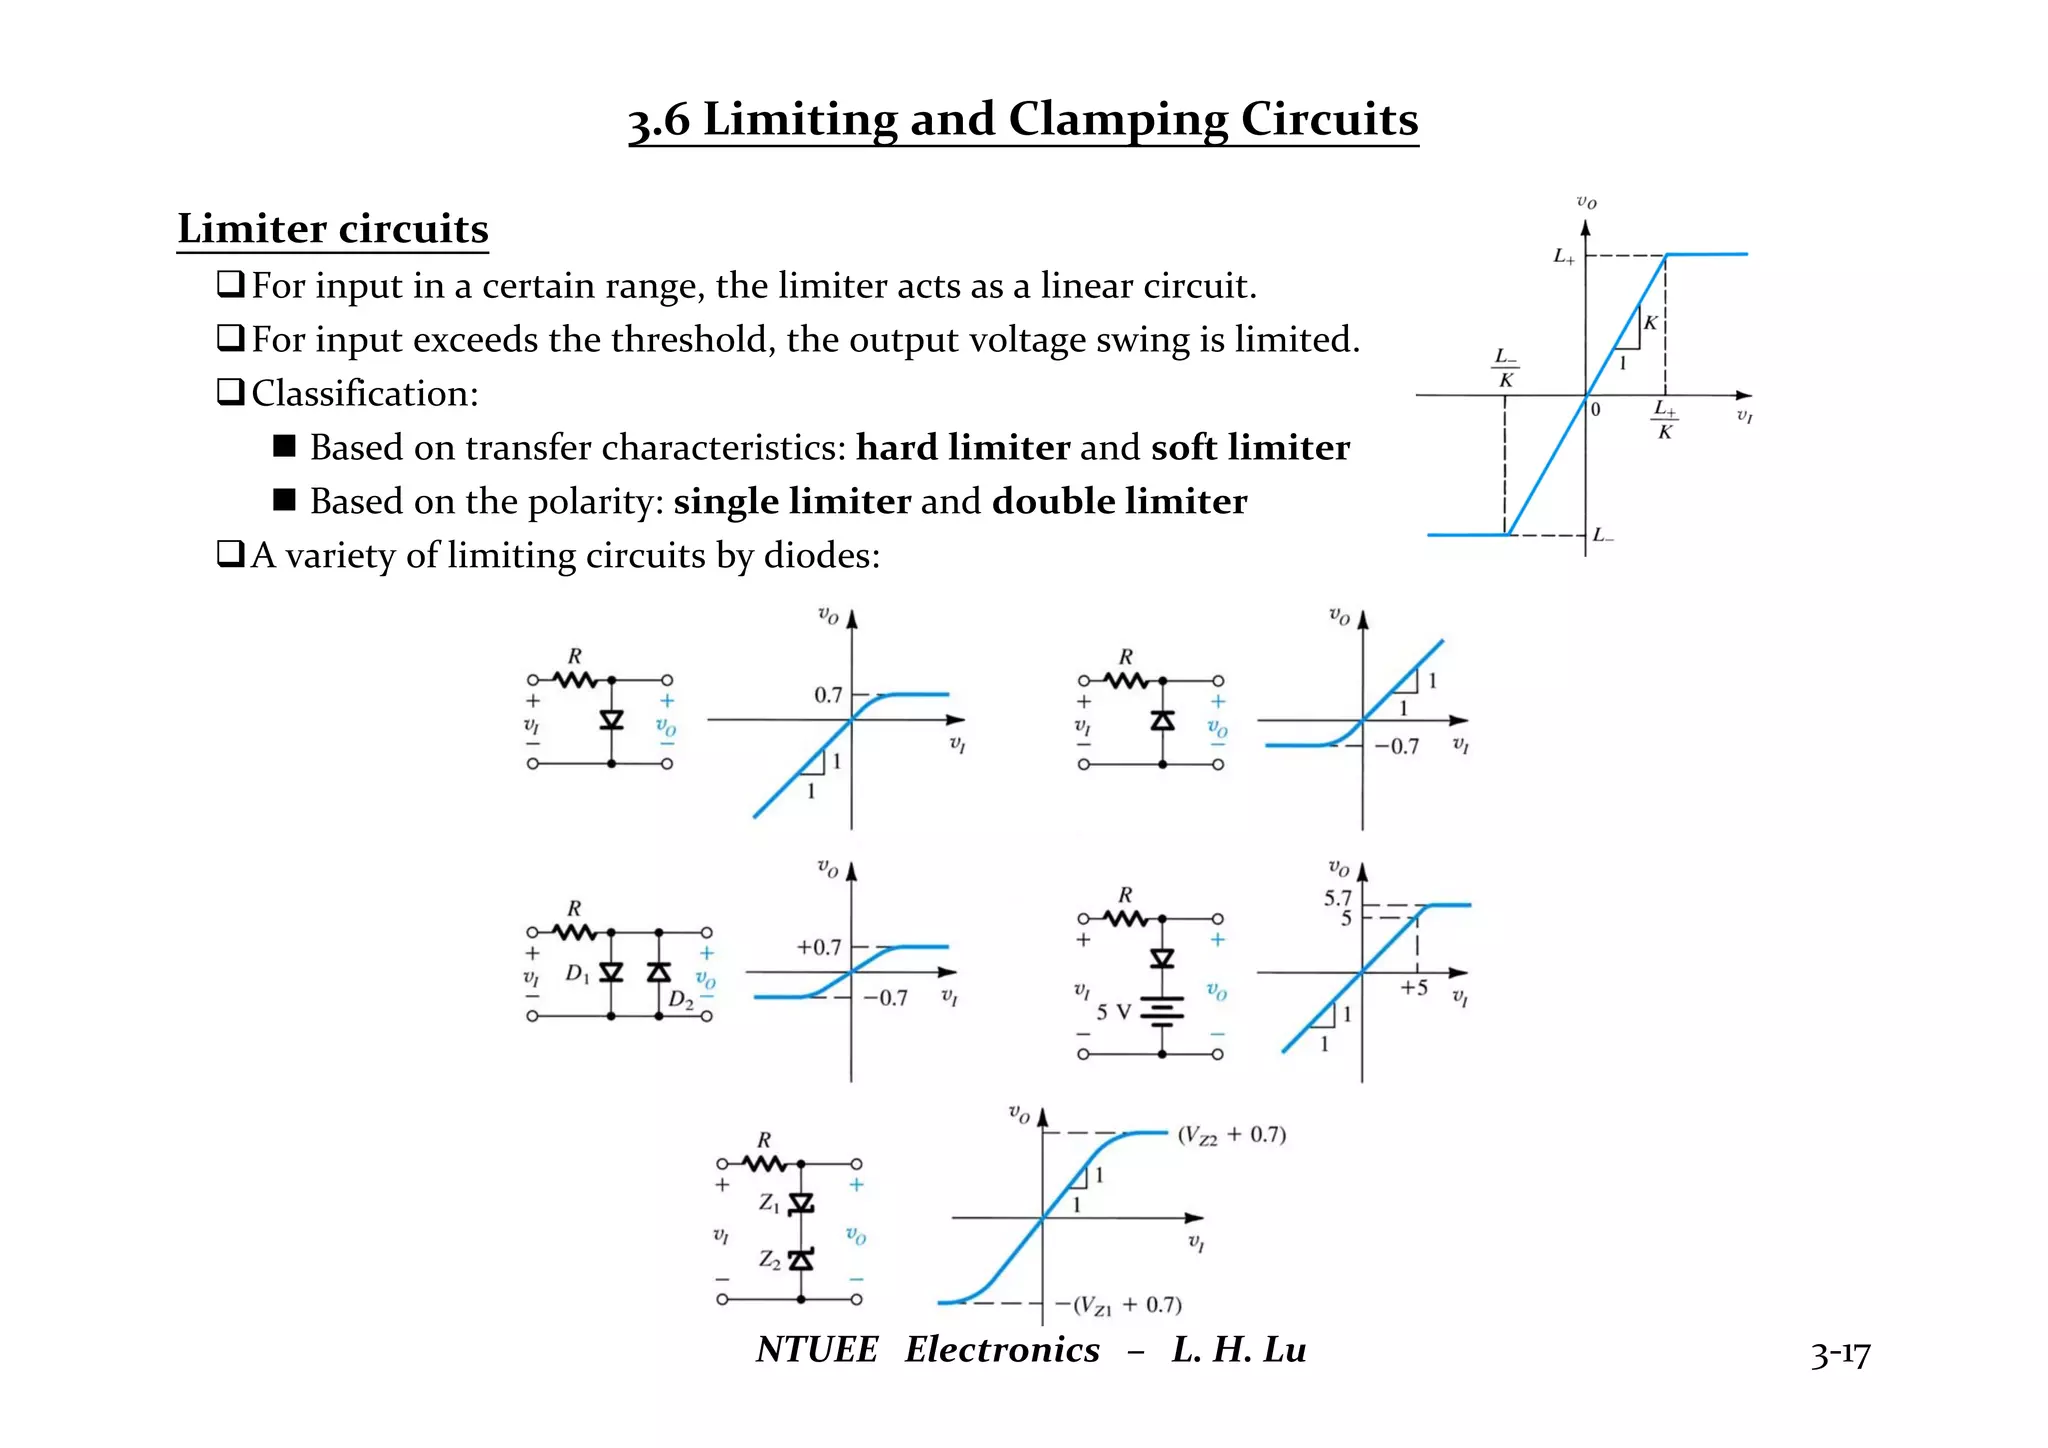
NTUEE Electronics – L. H. Lu 3‐1
CHAPTER 3 DIODES
Chapter Outline
3.1 The Ideal Diode
3.2 Terminal Characteristics of Junction Diodes
3.3 Modeling the Diode Forward Characteristics
3.4 Operation in the Reverse Breakdown Region – Zener Diodes
3.5 Rectifier Circuits
3.6 Limiting and Clamping Circuits
NTUEE Electronics – L. H. Lu 3‐2
3.1 Ideal Diode
Ideal diode characteristics
An diode is a two‐terminal device:
 Anode: the positive terminal
 Cathode: the negative terminal
Forward biased  turned on  short
Reverse biased  turned off  open
Circuit applications
Y = A  B  C Y = A  B  C
3.2 Terminal Characteristics of Junction Diodes
I‐V characteristics of junction diodes
Diode current:
 IS (saturation current): proportional to diode area
 n (ideality factor): between 1 and 2
 VT (thermal voltage)  25 mV at room temperature
The forward‐bias region, determined by v  0
The reverse‐bias region, determined by v  0
The breakdown region, determined by v  ‐VZK
Forward‐bias region
The simplified forward‐bias I‐V relationship:
 For a given forward voltage:
 For a given forward current:
Due to the exponential I‐V relationship
 i ≈ 0 for v < 0.5V (cut‐in voltage)
 Fully conduction for 0.6V < v < 0.8V  Von = 0.7V
Temperature dependence
IS doubles for every 5C rise in temperature
Voltage decreases 2mV/C for a given current
Current increases with temperature for a given voltage
NTUEE Electronics – L. H. Lu 3‐3
)
1
( /

 T
nV
v
S e
I
i
T
nV
v
Se
I
i /

)
/
ln( S
T I
I
nV
v 
Reverse‐bias region
Reverse current:
Ideally, the reverse current is independent of reverse bias
In reality, reverse current is larger than IS and also increases somewhat with the reverse bias
Temperature dependence: reverse current doubles for every 10C rise in temperature
Breakdown region
The knee of the I‐V curve is specified as breakdown voltage VZK for Zener breakdown mechanism
In breakdown region, the reverse current increases rapidly with a small increase in the reverse bias
Normally, the reverse current is specified by external circuitry to assure the power dissipation
within a safe range (non‐destructive operation)
NTUEE Electronics – L. H. Lu 3‐4
S
I
i 

3.3 Modeling the Diode Forward Characteristics
Circuit analysis
Determine the diode current ID and voltage VD for circuit analysis
The equation required for the analysis:
ID = IS exp(VD/nVT)  doide I‐V characteristics
ID = (VDDVD)/R  Kirchhoff loop equation
Need to solve non‐linear equations
Graphical analysis
Plot the two equations in the same I‐V coordination
The straight line is known as load line
The intersect is the solution for ID and VD
Iterative analysis
Set initial value VD = V0
Use ID = (VDDVD)/R to obtain I1
Use VD = nVTln (ID/IS) to obtain V2
Repeat until it converges (I3, V4, I5, V6…)
Iterations are needed to solve the nonlinear circuit
NTUEE Electronics – L. H. Lu 3‐5
The need for rapid analysis
Rapid analysis using simplified models for initial design
Accurate analysis (iterative analysis or computer program) for final design
Rapid analysis (I): ideal‐diode model
 The most simplified model used when supply voltage is much higher than the diode voltage
 Diode on: vD = 0 V and i > 0
 Diode off: i = 0 and vD < 0 V
 Equivalent circuit model as an ideal diode
Rapid analysis (II): constant‐voltage‐drop model
 The most widely used model in initial design and analysis phases
 Diode on: vD = 0.7 V and i > 0
 Diode off: i = 0 and vD < 0.7 V
 Equivalent circuit model as an ideal diode with a 0.7‐V voltage source
NTUEE Electronics – L. H. Lu 3‐6
Small‐signal approximation
The diode is operated at a dc bias point and a small ac signal is superimposed on the dc quantities:
Under small‐signal condition: vd / nVT <<1
 ID associates with VD  dc operating point Q
 id associates with vd  small signal response
The diode exhibits linear I‐V characteristics
under small‐signal conditions (vd  10mV)
Diode small‐signal resistance and conductance at operating point Q:
The diode small‐signal model
Choose proper dc analysis technique or model to obtain the operation point Q
The small‐signal model is determined once Q is provided
The small‐signal model is used for circuit analysis when the diode is operating around Q
NTUEE Electronics – L. H. Lu 3‐7
d
d
d
d
d
T
D
d r
v
v
g
v
nV
I
i /


 D
D I
i
D
D
T
D
d
v
i
nV
I
g 




 ]
[
D
D I
i
D
D
D
T
d
v
i
I
nV
r 




 ]
/[
1
T
d
T
d
T
D
T
d
D
T
D nV
v
D
nV
v
nV
V
S
nV
v
V
S
nV
v
S
D
d
D
D
e
I
e
e
I
e
I
e
I
t
i
t
v
V
t
v
/
/
/
/
)
(
/
)
(
)
(
)
(







d
D
d
T
D
D
T
d
D
D i
I
v
nV
I
I
nV
v
I
t
i 




 )
1
(
)
(
Circuit analysis techniques for total quantities (AC+DC)
Eliminate all the time varying signals (ac voltage and current sources) for operation point analysis
Use rapid analysis or accurate analysis to obtain dc voltage and current at operating point Q
Determine the parameters of small‐signal models from Q
Replace the devices with small‐signal models and eliminate all the dc sources
Circuit analysis under small‐signal approximation
The complete response of the circuit is obtained by superposition of the dc and ac components
Voltage regulator by diode forward drop
A regulator is to provide a constant dc voltage regardless changes in load and power‐supply voltage
The forward‐voltage drop remains almost constant at 0.7 V within a wide current range
Multiple diodes in series to achieve the required voltage drop
Better regulation can be provided for higher bias current and smaller rd
NTUEE Electronics – L. H. Lu 3‐8
3.4 Operation in the Reverse Breakdown Region – Zener Diodes
Symbol and circuit model for the Zener diode
In breakdown region, a reverse bias (VZ) beyond the knee voltage (VZK) leads to a large reverse
current (IZ).
The diode in breakdown region is given by VZ = VZ0+rzIz
 The breakdown diode is modeled by a voltage source VZ0 in series with an incremental
resistance rz
 Incremental voltage versus current: V = rz I
 The simplified model is only valid for IZ > IZK (knee current)
 Equivalent rz increases as IZ decreases
Diode types:
 Diode: only forward and reverse regions are considered
 Zener diode: forward, reverse and breakdown regions
NTUEE Electronics – L. H. Lu 3‐9
Design of the Zener shunt regulator
Output voltage of the regulator:
 Line regulation:
 Load regulation:
Line and load regulation should be minimized
For rz << R, line regulation can be minimized by choosing small rz
Load regulation can be minimized by choosing small rz and large R
There is an upper limit on the value of R to ensure sufficiently high current IZ (rz increases if IZ is
too low)
R should be selected from
NTUEE Electronics – L. H. Lu 3‐10
L
Z
Z
Z
Z
Z
z
O I
r
R
Rr
V
r
R
r
V
r
R
R
V





 
0
Z
Z
O
r
R
r
V
V





Z
Z
L
O
r
R
Rr
I
V





max
min
min
0
min
L
Z
Z
z
Z
S
I
I
I
r
V
V
R




3.5 Rectifier Circuits
Block diagram of a dc power supply
DC power supply
 Generate a dc voltage from ac power sources
 The ac input is a low‐frequency large‐signal voltage
Power transformer
 Step the line voltage down to required value and provides electric isolation
Diode rectifier
 Converts the input sinusoidal to a unipolar output
 Can be divided to half‐wave and full‐wave rectifiers
Filter
 Reduces the magnitude variation for the rectifier output
 Equivalent to time‐average operation of the input waveform
Voltage Regulator
 Further stabilizes the output to obtain a constant dc voltage
 Can be implemented by Zener diode circuits
NTUEE Electronics – L. H. Lu 3‐11
The half‐wave rectifier
Voltage transfer curve:
Rectifier diode specifications:
 Current‐handling capability: the largest current the diode is expected to conduct
 Peak inverse voltage (PIV): the largest reverse voltage the diode can stand without breakdown
PIV = Vs (input voltage swing) and the diode breakdown voltage is selected at least 50% higher
NTUEE Electronics – L. H. Lu 3‐12
0
0
0 0
D
S
O
D
S
O
D
S
V
v
v
V
v
v
V
v







The full‐wave rectifier (center‐tapped transformer)
Voltage transfer curve:
Transformer secondary winding is center‐tapped
Peak inverse voltage (PIV) = 2VsVD0
Rectified output waveform for both positive and negative cycles
NTUEE Electronics – L. H. Lu 3‐13
0
0 D
S
O
D
S V
v
v
V
v 



0
0 D
S
O
D
S V
v
v
V
v 





0
|
| 0 

 O
D
S v
V
v
Full‐wave rectifier (Bridge rectifier)
Voltage transfer curve:
Does not require a center‐tapped transformer
Higher turn‐on voltage (2VD0 )
Peak inverse voltage (PIV) = VsVD0
Most popular rectifier circuit configuration
NTUEE Electronics – L. H. Lu 3‐14
0
0 2
2 D
S
O
D
S V
v
v
V
v 



0
0 2
2 D
S
O
D
S V
v
v
V
v 





0
2
|
| 0 

 O
D
S v
V
v
Rectifier with a filter capacitor – the peak rectifier
Output unloaded case:
Output loaded case:
NTUEE Electronics – L. H. Lu 3‐15
Precision half‐wave rectifier – the superdiode
Superdiode is composed of a op amp and a diode
Superdiode works as an ideal diode with zero turn‐on voltage
 Positive input voltage:
Diode turns on
Closed‐loop op amp with virtual short at input
Output voltage follows input voltage
 Negative input voltage:
Diode turns off
Op amp in open loop
Output voltage is 0 V
Rectifier with superdiode can demonstrates better efficiency
NTUEE Electronics – L. H. Lu 3‐16
3.6 Limiting and Clamping Circuits
Limiter circuits
For input in a certain range, the limiter acts as a linear circuit.
For input exceeds the threshold, the output voltage swing is limited.
Classification:
 Based on transfer characteristics: hard limiter and soft limiter
 Based on the polarity: single limiter and double limiter
A variety of limiting circuits by diodes:
NTUEE Electronics – L. H. Lu 3‐17
Clamped capacitor or DC restorer
Output unloaded case:
Output loaded case:
NTUEE Electronics – L. H. Lu 3‐18

Zener_diode.pdf

  • 1.
    NTUEE Electronics –L. H. Lu 3‐1 CHAPTER 3 DIODES Chapter Outline 3.1 The Ideal Diode 3.2 Terminal Characteristics of Junction Diodes 3.3 Modeling the Diode Forward Characteristics 3.4 Operation in the Reverse Breakdown Region – Zener Diodes 3.5 Rectifier Circuits 3.6 Limiting and Clamping Circuits
  • 2.
    NTUEE Electronics –L. H. Lu 3‐2 3.1 Ideal Diode Ideal diode characteristics An diode is a two‐terminal device:  Anode: the positive terminal  Cathode: the negative terminal Forward biased  turned on  short Reverse biased  turned off  open Circuit applications Y = A  B  C Y = A  B  C
  • 3.
    3.2 Terminal Characteristicsof Junction Diodes I‐V characteristics of junction diodes Diode current:  IS (saturation current): proportional to diode area  n (ideality factor): between 1 and 2  VT (thermal voltage)  25 mV at room temperature The forward‐bias region, determined by v  0 The reverse‐bias region, determined by v  0 The breakdown region, determined by v  ‐VZK Forward‐bias region The simplified forward‐bias I‐V relationship:  For a given forward voltage:  For a given forward current: Due to the exponential I‐V relationship  i ≈ 0 for v < 0.5V (cut‐in voltage)  Fully conduction for 0.6V < v < 0.8V  Von = 0.7V Temperature dependence IS doubles for every 5C rise in temperature Voltage decreases 2mV/C for a given current Current increases with temperature for a given voltage NTUEE Electronics – L. H. Lu 3‐3 ) 1 ( /   T nV v S e I i T nV v Se I i /  ) / ln( S T I I nV v 
  • 4.
    Reverse‐bias region Reverse current: Ideally,the reverse current is independent of reverse bias In reality, reverse current is larger than IS and also increases somewhat with the reverse bias Temperature dependence: reverse current doubles for every 10C rise in temperature Breakdown region The knee of the I‐V curve is specified as breakdown voltage VZK for Zener breakdown mechanism In breakdown region, the reverse current increases rapidly with a small increase in the reverse bias Normally, the reverse current is specified by external circuitry to assure the power dissipation within a safe range (non‐destructive operation) NTUEE Electronics – L. H. Lu 3‐4 S I i  
  • 5.
    3.3 Modeling theDiode Forward Characteristics Circuit analysis Determine the diode current ID and voltage VD for circuit analysis The equation required for the analysis: ID = IS exp(VD/nVT)  doide I‐V characteristics ID = (VDDVD)/R  Kirchhoff loop equation Need to solve non‐linear equations Graphical analysis Plot the two equations in the same I‐V coordination The straight line is known as load line The intersect is the solution for ID and VD Iterative analysis Set initial value VD = V0 Use ID = (VDDVD)/R to obtain I1 Use VD = nVTln (ID/IS) to obtain V2 Repeat until it converges (I3, V4, I5, V6…) Iterations are needed to solve the nonlinear circuit NTUEE Electronics – L. H. Lu 3‐5
  • 6.
    The need forrapid analysis Rapid analysis using simplified models for initial design Accurate analysis (iterative analysis or computer program) for final design Rapid analysis (I): ideal‐diode model  The most simplified model used when supply voltage is much higher than the diode voltage  Diode on: vD = 0 V and i > 0  Diode off: i = 0 and vD < 0 V  Equivalent circuit model as an ideal diode Rapid analysis (II): constant‐voltage‐drop model  The most widely used model in initial design and analysis phases  Diode on: vD = 0.7 V and i > 0  Diode off: i = 0 and vD < 0.7 V  Equivalent circuit model as an ideal diode with a 0.7‐V voltage source NTUEE Electronics – L. H. Lu 3‐6
  • 7.
    Small‐signal approximation The diodeis operated at a dc bias point and a small ac signal is superimposed on the dc quantities: Under small‐signal condition: vd / nVT <<1  ID associates with VD  dc operating point Q  id associates with vd  small signal response The diode exhibits linear I‐V characteristics under small‐signal conditions (vd  10mV) Diode small‐signal resistance and conductance at operating point Q: The diode small‐signal model Choose proper dc analysis technique or model to obtain the operation point Q The small‐signal model is determined once Q is provided The small‐signal model is used for circuit analysis when the diode is operating around Q NTUEE Electronics – L. H. Lu 3‐7 d d d d d T D d r v v g v nV I i /    D D I i D D T D d v i nV I g       ] [ D D I i D D D T d v i I nV r       ] /[ 1 T d T d T D T d D T D nV v D nV v nV V S nV v V S nV v S D d D D e I e e I e I e I t i t v V t v / / / / ) ( / ) ( ) ( ) (        d D d T D D T d D D i I v nV I I nV v I t i       ) 1 ( ) (
  • 8.
    Circuit analysis techniquesfor total quantities (AC+DC) Eliminate all the time varying signals (ac voltage and current sources) for operation point analysis Use rapid analysis or accurate analysis to obtain dc voltage and current at operating point Q Determine the parameters of small‐signal models from Q Replace the devices with small‐signal models and eliminate all the dc sources Circuit analysis under small‐signal approximation The complete response of the circuit is obtained by superposition of the dc and ac components Voltage regulator by diode forward drop A regulator is to provide a constant dc voltage regardless changes in load and power‐supply voltage The forward‐voltage drop remains almost constant at 0.7 V within a wide current range Multiple diodes in series to achieve the required voltage drop Better regulation can be provided for higher bias current and smaller rd NTUEE Electronics – L. H. Lu 3‐8
  • 9.
    3.4 Operation inthe Reverse Breakdown Region – Zener Diodes Symbol and circuit model for the Zener diode In breakdown region, a reverse bias (VZ) beyond the knee voltage (VZK) leads to a large reverse current (IZ). The diode in breakdown region is given by VZ = VZ0+rzIz  The breakdown diode is modeled by a voltage source VZ0 in series with an incremental resistance rz  Incremental voltage versus current: V = rz I  The simplified model is only valid for IZ > IZK (knee current)  Equivalent rz increases as IZ decreases Diode types:  Diode: only forward and reverse regions are considered  Zener diode: forward, reverse and breakdown regions NTUEE Electronics – L. H. Lu 3‐9
  • 10.
    Design of theZener shunt regulator Output voltage of the regulator:  Line regulation:  Load regulation: Line and load regulation should be minimized For rz << R, line regulation can be minimized by choosing small rz Load regulation can be minimized by choosing small rz and large R There is an upper limit on the value of R to ensure sufficiently high current IZ (rz increases if IZ is too low) R should be selected from NTUEE Electronics – L. H. Lu 3‐10 L Z Z Z Z Z z O I r R Rr V r R r V r R R V        0 Z Z O r R r V V      Z Z L O r R Rr I V      max min min 0 min L Z Z z Z S I I I r V V R    
  • 11.
    3.5 Rectifier Circuits Blockdiagram of a dc power supply DC power supply  Generate a dc voltage from ac power sources  The ac input is a low‐frequency large‐signal voltage Power transformer  Step the line voltage down to required value and provides electric isolation Diode rectifier  Converts the input sinusoidal to a unipolar output  Can be divided to half‐wave and full‐wave rectifiers Filter  Reduces the magnitude variation for the rectifier output  Equivalent to time‐average operation of the input waveform Voltage Regulator  Further stabilizes the output to obtain a constant dc voltage  Can be implemented by Zener diode circuits NTUEE Electronics – L. H. Lu 3‐11
  • 12.
    The half‐wave rectifier Voltagetransfer curve: Rectifier diode specifications:  Current‐handling capability: the largest current the diode is expected to conduct  Peak inverse voltage (PIV): the largest reverse voltage the diode can stand without breakdown PIV = Vs (input voltage swing) and the diode breakdown voltage is selected at least 50% higher NTUEE Electronics – L. H. Lu 3‐12 0 0 0 0 D S O D S O D S V v v V v v V v       
  • 13.
    The full‐wave rectifier(center‐tapped transformer) Voltage transfer curve: Transformer secondary winding is center‐tapped Peak inverse voltage (PIV) = 2VsVD0 Rectified output waveform for both positive and negative cycles NTUEE Electronics – L. H. Lu 3‐13 0 0 D S O D S V v v V v     0 0 D S O D S V v v V v       0 | | 0    O D S v V v
  • 14.
    Full‐wave rectifier (Bridgerectifier) Voltage transfer curve: Does not require a center‐tapped transformer Higher turn‐on voltage (2VD0 ) Peak inverse voltage (PIV) = VsVD0 Most popular rectifier circuit configuration NTUEE Electronics – L. H. Lu 3‐14 0 0 2 2 D S O D S V v v V v     0 0 2 2 D S O D S V v v V v       0 2 | | 0    O D S v V v
  • 15.
    Rectifier with afilter capacitor – the peak rectifier Output unloaded case: Output loaded case: NTUEE Electronics – L. H. Lu 3‐15
  • 16.
    Precision half‐wave rectifier– the superdiode Superdiode is composed of a op amp and a diode Superdiode works as an ideal diode with zero turn‐on voltage  Positive input voltage: Diode turns on Closed‐loop op amp with virtual short at input Output voltage follows input voltage  Negative input voltage: Diode turns off Op amp in open loop Output voltage is 0 V Rectifier with superdiode can demonstrates better efficiency NTUEE Electronics – L. H. Lu 3‐16
  • 17.
    3.6 Limiting andClamping Circuits Limiter circuits For input in a certain range, the limiter acts as a linear circuit. For input exceeds the threshold, the output voltage swing is limited. Classification:  Based on transfer characteristics: hard limiter and soft limiter  Based on the polarity: single limiter and double limiter A variety of limiting circuits by diodes: NTUEE Electronics – L. H. Lu 3‐17
  • 18.
    Clamped capacitor orDC restorer Output unloaded case: Output loaded case: NTUEE Electronics – L. H. Lu 3‐18