This document analyzes the 2012-2016 single-family residential real estate market in Kittitas County, Washington. It finds that home sales and building permits fluctuate seasonally, with higher numbers in summer quarters. A regression analysis identified total property area, home area, number of bathrooms, basement area, and garage area as significant factors influencing home prices. Homes in Kittitas are estimated to be 50% cheaper than other Kittitas County cities and towns. The market has seen an overall upward trend in home sales, permits, and median prices over the past four years.
Home sales in the GTA reached a new record high in November 2021, increasing 3.3% over November 2020. However, new listings dropped 13.2% over the same period, highlighting supply issues. The average home price also set a new record, rising 21.7% to $1,163,323. While condo sales increased, prices rose more substantially in suburban areas, showing first-time buyers returning to the market. Ongoing housing affordability challenges will escalate unless all levels of government work to increase housing supply.
Home sales in the Greater Toronto Area reached the second highest level for October, but new listings were down about a third from October 2020. Market conditions tightened across all major home types compared to last year, with the average price rising 19.3% to $1,155,345. Demand is not expected to decrease, so governments need to focus on increasing housing supply to address affordability issues.
Sales in the GTA decreased 18% year-over-year in September 2021, while average home prices increased 18.3% to $1,136,280. New listings were down 34% compared to September 2020, contributing to tighter market conditions and higher prices. Demand remained strong but supply issues persisted, with many buyers unable to find suitable properties. Price growth was driven by detached and semi-detached houses as well as townhouses, while condo apartment prices also increased with more first-time buyers entering the ownership market.
Real Estate Board of Greater Vancouver Statistics Package January 2021 Vicky Aulakh
- Home sales in Metro Vancouver increased 52.1% in January 2021 compared to January 2020, while new listings rose 15.7%.
- The supply of homes remains constrained, causing increased competition among buyers and upward pressure on home prices.
- The benchmark home price in Metro Vancouver rose 5.5% year-over-year to $1,056,600 in January 2021. Detached home prices increased 10.8% to $1,576,800, while apartment prices grew 2.2% to $680,800.
- Home sales in Metro Vancouver decreased 43.5% in September 2018 compared to September 2017, as supply increased and demand decreased. There were 5,279 new listings, up 1.8% from last year, and total active listings increased 38.2% to 13,084.
- The sales-to-active listings ratio was 12.2%, indicating downward pressure on home prices. Detached home sales saw the largest decrease (40.4%) and their benchmark price fell 4.5% from last year. Apartment sales fell 44% while their benchmark price rose 7.4%.
Home sales and new listings in Metro Vancouver increased in August compared to the previous year. Total home sales were 3,047, up 36.6% from August 2019. New listings were 5,813, up 55.1% from the previous year. The benchmark home price index for all residential properties was $1,038,700, up 5.3% from August 2019. Sales remained strong for detached homes and apartments.
- Home sales in Metro Vancouver increased modestly in May 2019 compared to April, reaching over 2,000 for the first time this year, though demand remains below historical averages.
- The number of homes currently listed for sale reached a 5-year high of over 14,000 in May 2019, up 30% from May 2018.
- Prices continued to decline across property types, with the composite benchmark price down 0.4% from April and 8.9% from May 2018.
December 2020 Victoria Real Estate Board StatisticsVicky Aulakh
The Victoria real estate market saw record sales in 2020, with a total of 8,497 properties sold, up 17.1% from 2019. While sales increased, inventory decreased significantly, with only 1,279 active listings at the end of December 2020, down 29.5% from the previous month and 34.5% from the previous year. This represents the lowest inventory levels in at least 25 years, putting upward pressure on home prices. The benchmark price of a single-family home in Victoria increased 6.8% year-over-year to $915,100 in December 2020.
Victoria Real Estate Board Statistics Package January 2022VickyAulakh1
The Victoria Real Estate Board reported on the January 2022 real estate market. Sales were down 26.6% from January 2021 with 474 properties sold. Limited inventory continues to be a key factor, with January 2022 having nearly half the inventory of January 2021. The average price of a single-family home in Victoria increased 24.6% year-over-year to $1,161,500. Condo prices rose 20.5% to $587,300. Low inventory is expected to keep the market slow until supply levels increase to meet demand.
This document provides property information for a parcel located at 3462 Pakui St in Honolulu, Hawaii. It belongs to Brickwood M Galuteria and Abigail L Galuteria. The parcel has an area of 0.2296 acres and contains two single family homes built in 1969 and 2006. It also lists the property's assessed values, tax payments, permits, and sales history from 2001 to the present.
The document provides statistics on home sales and prices for primary residences, vacation homes, and investment properties from 2003-2008. It finds that in 2008, 70% of home purchases were for primary residences, while 9% were for vacation homes and 21% for investment properties. Median home prices declined substantially from 2007 to 2008 for all property types. The typical vacation home buyer was older (median age 46) than primary residence buyers (median age 37).
Home sale and new listing activity in Metro Vancouver remained high in October 2020. Sales increased 29% from October 2019 and were 34.7% above the 10-year average. New listings increased 36.7% from October 2019. The sales-to-active listings ratio was 29.7%, indicating upward pressure on home prices. The benchmark home price index rose 6% from October 2019 to $1,045,100, with detached homes up 8.5% to $1,523,800 and apartments up 4.4% to $683,500. REALTORS continue working within safety protocols to help buyers and sellers meet housing needs.
The document provides an annual report on the real estate market. It summarizes sales volumes and median home prices for several cities in Southwest California for 2010. Several key points are made:
- Home sales increased over 30% year-over-year in 4 cities and over 25% in the other two cities compared to 2009 levels. Total sales revenue also increased.
- Median home prices remained largely stable compared to 2009 and 2008 levels, suggesting the market may have stabilized after declines in prior years.
- Strong first half sales volumes helped annual numbers despite slowing in the second half of the year. The outlook for 2011 is uncertain depending on broader economic and jobs trends.
Home sales in Metro Vancouver decreased significantly in November 2018 across all property types compared to November 2017 and October 2018. The Real Estate Board reported a 42.5% decrease in home sales year-over-year and an 18.2% monthly decrease. Additionally, home prices have declined 4-7% over the last six months depending on property type. The sales-to-active listings ratio is below the 12% threshold that often leads to downward pressure on home prices.
Inflation for 2020 was the lowest in 16 years and the second lowest in 51 yearsSABC News
The December 2020 Consumer Price Index (CPI) release concludes the data points for the entire calendar year. The average annual inflation rate for 2020 was 3,3%. This is the lowest annual average rate since 2004 (1,4%) and the second lowest since 1969 (3,0%).
The 2021 housing market saw record high home sales, prices, and demand coupled with low inventory. Existing home sales are projected to hit 6 million for 2021, the highest level in 15 years. Median home prices rose significantly in 2021, with single family home prices up 8.4% and condo prices up 17.2% compared to December 2020. Low inventory, strong demand, and fast selling times defined the 2021 market but trends are expected to continue at a more moderate pace in 2022 as inventory remains limited and interest rates rise gradually.
Trend and Seasonal component/Abshor Marantika/James beckhamJamesTjiam
The document discusses modeling trends, seasonality, and cyclicality in time series data. It provides an example of modeling revenue data from Toys R Us over several years: (1) moving averages are used to estimate the base trend; (2) seasonal ratios are calculated by dividing actual revenue by the trend for each period; (3) raw seasonal indices are averaged for each period; (4) seasonal indices are normalized so their average is 1; (5) data is deseasonalized by dividing actual values by the seasonal indices. This allows separating the trend, seasonal, and error components.
This document provides monthly real estate statistics for the Central Okanagan region. It includes information on listings, sales, prices and inventory for July 2021 compared to the previous month and July 2020. Some key figures are:
- Total listings in July 2021 were down 32.44% from July 2020.
- Total sales were down 17.64% from the previous year with 621 units sold.
- The average price was $476,777,381 and the median days to sell was 79 days.
IT-272 Claim for College Tuition Credit or Itemized Deduction and instructionstaxman taxman
This document is a claim form for the New York State real property tax credit for homeowners and renters. It provides instructions for homeowners and renters to determine if they are eligible for the tax credit based on their household income and real property taxes or rent paid. The form guides filers through 6 steps: 1) entering identifying information; 2) determining eligibility; 3) calculating household gross income; 4) computing real property taxes or rent paid; 5) computing the credit amount; and 6) finishing the claim by signing, entering direct deposit information if not filing with a tax return, and mailing instructions.
- Residential real estate activity in San Francisco decreased in August 2021 compared to the previous year. New listings were down 38.1% for single family homes and 53.5% for condos. Pending sales also decreased slightly.
- The median sales price of single family homes rose 13.8% to $1,850,000, while the median price for condos fell 5% to $1,150,000. Months of inventory dropped sharply.
- Nationwide, high home prices and low housing supply have increased demand for rentals, driving up rental prices 11.4% so far in 2021. Builders continue to face challenges meeting housing needs due to material and labor shortages.
The document provides a monthly real estate snapshot for San Francisco County. Some key highlights include:
- New listings were down 46.8% for single family homes and 58% for condos/co-ops in July 2021 compared to a year ago. Pending sales decreased 8% for single family but increased 46.3% for condos/co-ops.
- The median sales price was up 15.3% to $1,850,000 for single family homes but down 4% to $1,210,000 for condos/co-ops in July 2021 versus a year ago. Months of inventory decreased over 60% for both property types.
- Residential real estate activity,
Sales of single-family homes and condominiums in the Victoria area decreased in February 2023 compared to the previous year. While prices are down from January 2023, the real estate market saw increased buyer confidence and more stable pricing. Inventory levels rose significantly compared to February 2022, providing more opportunities for buyers but keeping demand high with low inventory overall. The real estate board chair observed the market is in a less pressured environment than recent years.
Victoria Real Estate Board September 2022 Statistics VickyAulakh1
Sales of residential properties in the Victoria real estate market decreased in August 2022 compared to the previous year. A total of 478 properties sold in August 2022, which was 42.5% fewer than the 831 properties sold in August 2021. There were 2,137 active listings for sale at the end of August 2022, a 90.8% increase from the 1,120 listings in August 2021. The president of the Victoria Real Estate Board commented that after two years of a strong sellers' market, sales have diminished in recent months as inventory levels have slowly increased, moving the market towards a more balanced state.
Victoria Real Estate Board November 2020 Statistics PackageVicky Aulakh
The Victoria real estate market continues to experience strong demand and low supply. In November 2020, 795 properties sold, up 37.8% from November 2019. Condo sales increased 62.7% and single family home sales rose 21.8% compared to the previous year. Active listings declined 24.4% year-over-year to 1,813 properties. Benchmark home prices increased between 5.3-10% across different property types compared to November 2019, indicating continued upward pressure on home prices due to high demand and low inventory.
April 2023 Victoria Real Estate Board Statistics Package with Charts & Graphs. Not enough growth in inventory means spring market sales slow. A total of 637 properties sold in the Victoria Real Estate Board region this April, 22.7 per cent fewer than the 824 properties sold in April 2022 but an 8 per cent increase from March 2023. Sales of condominiums were down 21.8 per cent from April 2022 with 205 units sold. Sales of single family homes decreased 19.4 per cent from April 2022 with 325 sold.
The Victoria real estate market saw a slight increase in home sales and inventory in October 2019 compared to the previous year. Total home sales increased 3.5% from October 2018 despite a 1.1% drop in condo sales. Active listings rose 5.3% year-over-year but inventory remains constrained, putting upward pressure on home prices in desirable areas and neighborhoods. The benchmark price of a single-family home in Victoria's core decreased 2.4% from October 2018 while the condo benchmark price rose 1.7% over the same period.
VREB September 2021 Statistics Package VickyAulakh1
- Housing sales in the Victoria region declined in September 2021 compared to the previous year, with 761 properties sold, down 23.1%. Condo sales rose 9.3% while single-family home sales dropped 38.6%.
- Inventory levels remain low, with 1,124 active listings at the end of September, a 53% decline from the previous year.
- Home prices continue to rise significantly due to the imbalance of high demand and low supply. The benchmark price of a single-family home rose 25.1% since September 2020 and condo prices increased 13.3%.
- The real estate board president said greater commitment to development is needed to address the long-term low inventory levels driving up
Victoria Real Estate Board Statistics with charts and graphs - March 2023. Early spring market reflects consumer confidence and growing demand. A total of 590 properties sold in the Victoria Real Estate Board region this March, 29.2 per cent fewer than the 833 properties sold in March 2022 but a 28.3 per cent increase from February 2023. Sales of condominiums were down 29.4 per cent from March 2022 with 197 units sold. Sales of single family homes decreased 31.8 per cent from March 2022 with 281 sold.
December 2021 Victoria Real Estate Board Statistics Package VickyAulakh1
The Victoria real estate market saw a decrease in property sales in December 2021 compared to the previous year. A total of 438 properties sold in December 2021, down 30.6% from December 2020. For the full year 2021, 10,052 properties sold, an increase of 18.3% from 2020 but close to the 2016 record year. Housing supply remained extremely low with only 652 active listings at the end of December 2021, a 49% decrease from the previous year. Benchmark home prices in Victoria increased substantially over the past year, with single family homes up 25.1% and condominiums up 17.1% compared to December 2020. The president of the Victoria Real Estate Board noted that high demand paired with
YUKON RENT SURVEY - APRIL 2015 - DOME REALTY INC.Sherryl Jacobs
The document provides rental market statistics for Yukon, Canada in April 2015. It finds that the median rent in Whitehorse was $900 for units in buildings with 3 or more units, with a vacancy rate of 2.0%. Compared to April 2014, median rent remained the same while the vacancy rate decreased from 4.7% to 2.0%. The median rent for all unit types in Whitehorse was $950, with a vacancy rate of 3.4%.
This document provides real estate statistics for the Greater Toronto Area (GTA) in October 2023. It reports that home sales were down 5.8% compared to October 2022, while average home prices increased 3.5% year-over-year. New listings increased compared to the previous year but demand has shifted to the rental market as high interest rates have discouraged some would-be buyers. The document also provides additional statistics on housing sales, prices, and inventory by region within the GTA.
In November 2020, home sales in the Greater Toronto Area increased 24.3% compared to November 2019. The average selling price rose 13.3% year-over-year to $955,615. Sales and prices increased strongly across single-family home segments, while condominium apartment sales saw more balanced conditions with some price declines compared to last year. Looking ahead, demand for condo apartments is expected to increase once population growth resumes following the COVID-19 pandemic.
Victoria Real Estate Board August 2021 StatisticsVicky Aulakh
Sales of single-family homes in the Victoria region were down 29.9% in August 2021 compared to August 2020, while condominium sales increased 31.7%. Total active property listings were down 56.7% from the previous year due to a long-term lack of housing supply. The benchmark price of a single-family home increased 22.4% year-over-year to $1,089,400, and the benchmark price of a condominium rose 11.8% to $540,600, indicating continued upward pressure on home prices from low inventory levels.
The housing market in Southwest California had a strong year in 2020 despite the pandemic shutdown. Sales volume was the highest since 2010 with over 11,000 homes sold. Median and average home prices reached new peaks, with 259 homes selling for over $1 million, up from 174 in 2019. However, inventory remains very low with only 598 homes currently for sale, the lowest level since 2012. The low inventory coupled with continued high demand is expected to sustain price appreciation in 2021, though new policies and economic impacts from the pandemic could influence the market.
Dane County home sales continued at a very strong pace in November, up 13.6% over last year and 13.8% for the year-to-date. New listings in Dane County increased over last year (2014) in November – this time by more than 13%. 2015 Could come very close to setting an all-time record for home sales, exceeding the 7981 reported at the end of 2005.
2015 Could come very close to setting an all time record for home sales. Inventory is low, but great homes are there to be found. Buy now to avoid competition with other buyers and lock in today's lower interest rates versus risking higher rates in the Spring.
Victoria Real Estate Board March 2021 Statistics PackageVicky Aulakh
The Victoria Real Estate Board released statistics showing that the real estate market continues to surge in March 2021. A total of 1,173 properties sold in March, up 92.9% from March 2020. Sales of condominiums increased 111.8% and single family home sales rose 88.2% compared to the previous year. Limited housing supply coupled with high demand has defined the first quarter of 2021. The number of active listings declined 41.8% from March 2020 to 1,310 listings in March 2021. The president of the Victoria Real Estate Board stated that supply needs to be addressed by all levels of government to help balance the market. Benchmark home prices for single family homes increased 10.1% year-over-
Frontier Financial Corporation announced its financial results for the first quarter of 2009, reporting a net loss of $33.8 million compared to a net loss of $89.5 million in the previous quarter and net income of $15.5 million in the first quarter of 2008. Nonperforming assets increased significantly due to continued pressure from the uncertain economy and housing market. In response, the company is taking steps to strengthen its capital position and reduce expenses while continuing to recognize loan quality deterioration and charge offs.
Victoria Real Estate Board Statistics - November 2021VickyAulakh1
The Victoria real estate market saw fewer home sales in November 2021 compared to the previous year and month. While demand remains strong, the low inventory of available homes is putting upward pressure on home prices. The average price of a single-family home increased 24.2% year-over-year in the Victoria Core area. Real estate officials say increasing housing supply is needed to relieve market pressures, but government policies have focused on demand-side measures without industry input.
Sales of residential properties in the Victoria Real Estate Board region increased significantly in October 2020 compared to the previous year. A total of 990 properties sold in October 2020, up 59.9% from October 2019. Both condominium and single family home sales saw large increases. However, active listings continued to decline, down 19.7% from the previous year. This high demand and low supply environment has led to many multiple offer situations and upward pressure on home prices.
Similar to YUKON REAL ESTATE - 1ST QUARTER 2015 STATISTICS - DOME REALTY INC. (20)
4807 patrick place sherryl jacobs - luxmore realtySherryl Jacobs
Contractor and Developers Investment Opportunity in Burnaby, British Columbia, Canada - Real Estate For Sale listed by Sherryl Jacobs at Luxmore Realty Group, Ltd.
220 davis street sherryl jacobs - luxmore realtySherryl Jacobs
This document provides details on a 9.8 acre property in Stewart, British Columbia that is being sold. The property operates as a 72 site RV park with amenities like shower facilities, laundry, and a manager's suite. It is described as a lucrative family business located near the iconic Bear River with mountain and glacier views. Interested buyers are asked to make an appointment to view the property and business. It is listed for $1,499,000 through Luxmore Realty.
This document contains details about a luxury custom home located in Richmond, British Columbia. It includes specifications like the lot size of 8,745 square feet, 3,872 square feet of living space, 4 bedrooms and 5 bathrooms. The home features high quality materials and craftsmanship throughout including hardwood floors and cabinets, gourmet kitchen with stone countertops, and radiant floor heating. It is walking distance to schools in a quiet neighborhood.
73 46000 thomas road sherryl jacobs - luxmore realtySherryl Jacobs
This document contains property details for a 1,528 square foot detached home located at 73 46000 Thomas Road in Sardis, BC. The home has 3 bedrooms and 2 bathrooms and was built in 2006. It is located in the Halcyon Meadows adult oriented and gated housing complex. Features include an open floor plan, recent interior painting, and amenities like a clubhouse and nearby shopping.
Home sales and prices decreased in June 2019 across the Metro Vancouver housing market. Total home sales fell 14.4% from the previous June and 21.3% from May 2019, reaching the lowest level for June since 2000. Meanwhile, the supply of homes for sale increased 25.3% over the previous June and 1.9% over May, giving buyers the most selection in 5 years. As a result of the sales decline and rising supply, the MLS Home Price Index fell 9.6% from June 2018 and the composite benchmark price dropped below $1 million for the first time since May 2017.
Arbutus project by luxmore realty sherryl jacobsSherryl Jacobs
NATURALLY AT HOME IN KITSILANO
There is a subtlety of light that warms and enchants, it filters through trees and takes us back to carefree days at the park and to long afternoons at the beach. Nostalgic and serene; it suspends time and allows us to leave our everyday.
This is the inspiration for The Arbutus, an intimate collection of homes on the Arbutus Greenway where the best of Kitsilano living comes naturally.
“Government policy continues to hinder home sale activity. The federal government’s mortgage stress test has reduced buyers’ purchasing power by about 20 per cent, which is causing people at the entry-level side of the market to struggle to secure financing,” Ashley Smith, REBGV president said. “Suppressing housing activity through government policy not only reduces home sales, it harms the job market, economic growth and creates pent-up demand.”
702 277 thurlow street luxmore realty - sherryl jacobsSherryl Jacobs
LISTED BY: Royal Pacific Realty Corp.
3,280 sq. ft. of unobstructed world-class views in a world-class waterfront building in a world class location! With 11 foot high ceilings this dream home is designed for a sophisticated lifestyle with entertainment size living/dining areas, features walk-out terrace w/fireplace, a truly sensational Italian kitchen, library, a master bedroom suite with stunning 5 piece master bath and separate dressing room plus two ensuite bedrooms. 3 car enclosed private garage plus a separate storage room. The building has 24-hour concierge, indoor pool, spa, gym, squash courts, golf, table tennis, movie theatre, guest suite, meeting room.
8209 19 a street near dawson creek - luxmore realty - sherryl jacobsSherryl Jacobs
LISTED BY: Century 21 Energy Realty (PG)
The One You Have Been Waiting For! Stunning 3 Bed 2 Bath with open concept modern design and full basement. The home features a huge island kitchen with Samsung appliances that open to the bright and spacious living and dining areas. The master suite has a large walk-in closet and ensuite bath with double sinks. The property is fully fenced and landscaped with a covered patio out back to enjoy the sunsets. This home was constructed using Quik-Therm insulation technology + triple pane windows which makes this property super energy efficient - nice and cool in the summer and minimum heat bills in the winter. Buying brand new also means you could save paying property transfer tax! Too many features to list.
402 138 e hastings street luxmore realty - sherryl jacobsSherryl Jacobs
LISTED BY: Oakwyn Realty Ltd.
For those with a rugged soul, here’s your answer to affordable inner-city living. Sequel138 is ahead of its time, with features like its glass elevator, shared rooftop garden and social courtyard set a new standard for development of Vancouver’s East Side. This 02 unit is the most desirable one bedroom location in the building. It has a combo washer/dryer and newly installed dishwasher making it a complete home. With views from your living room south over the community garden to Science World and North Van mountain views from the bedroom, this compact space opens up to the city. Endless options to Vancouver's best restaurants and bars are only a short walk from your door and ready to be enjoyed with the extra funds you save due to the ultra low monthly strata fees.
FANTASTIC SPACIOUS 1 BEDROOM HOME IN Beverley House OF Shannon Wall Centre. Located in the prestigious KERRISDALE neighbourhood. Quality built and functional layout. THIS UNIT is a quiet unit, facing Courtyard. 1 parking & storage locker. Luxurious finishing, plank hardwood flooring, and air conditioning. Bathrooms with radiant in-floor heating, all-in-one wall flush toilet. Kitchen with Armony Cu-cine cabinetry, and top of the line appliances. Facilities include an outdoor pool, hot tub, exercise centre, professionally landscaped garden.
Prospective home buyers remain on the sidelines in March VANCOUVER, BC – April 2, 2019 – Metro Vancouver* home sales dipped to the lowest
levels seen in March in more than three decades.
The Real Estate Board of Greater Vancouver (REBGV) reports that residential home sales in the region totalled 1,727 in March 2019, a 31.4 per cent decrease from the 2,517 sales recorded in March 2018, and a 16.4 per cent increase from the 1,484 homes sold in February 2019.
Last month’s sales were 46.3 per cent below the 10-year March sales average and was the lowest total for the month since 1986.
"Housing demand today isn’t aligning with our growing economy and low unemployment rates. The market trends we’re seeing are largely policy-induced," Ashley Smith, REBGV president said. "For three years, governments at all levels have imposed new taxes and borrowing requirements on to the housing market.”
976 irvine street luxmore realty - sherryl jacobsSherryl Jacobs
An open, spacious new custom residence offering over 4,800 sq.ft. of luxurious living. This 7 bedroom, 5 bathroom home truly has it all. Enjoy the chef inspired kitchen, spa-like master bedroom with ensuite and generous walk-in closet. This property boasts a stunning grand foyer, high-ceilings (with built-in speakers), first-class finishings, fully accessible elevator, home theatre room, 2 bedroom legal suite, steam room, security system, radiant heating, 2 gas fireplaces, large private yard and more. Walking distance to Coquitlam Centre, Coquitlam Central Station and minutes away from Lougheed Hwy, Meadowbrook Elementary, Dr. Charles Best Secondary, Douglas College, Lafarge Lake and local parks. Fully covered with 2/5/10 warranty. Don’t miss this fantastic opportunity!
Experience a Unique Approach to Real Estate
Work with a licensed real estate broker who will exceed your expectation using a polished and professional approach with transparency and a project management style to reporting to you as a client.
Buying or Selling, discover a unique approach to real estate services in Vancouver, British Columbia.
Website: http://sherryljacobs.com/
Email: infio@sherryljacobs.com
2784 E 48TH AVENUE
KILLARNEY'S most prestigious area. Well maintained solid beautiful 2 level home on a tree-lined quiet cul-de-sac street. Lot 6482 sqft (46.05x140.75), 2700 sqft 3 ensuite Bdrm up, 2 rental suites with 2 separate entrance down, one 3 bdrm suite, one 2 bdrm suite, good mortgage helper.
7908 manitoba street luxmore realty - sherryl jacobsSherryl Jacobs
Westside townhome - CHURCHILL at W 63rd Ave and Manitoba St., situated on a quiet and tree lined street. 1572 sqft living space, 3 bedrooms & 3.5 baths + den (storage) + in-law suite or mortgage helper suite with separate entrance. Features the quality found in single family homes. Functionality and great modern design. Spacious chef's kitchen. Large master bedroom with. 9' ceiling on main, Bosch appliances package, quartz Caesar stone countertops, modern glossed cabinet, heating & cooling system control by NEXT thermostat, 1 underground parking plus lots of street parking at your footstep. 2-5-10 New Home Warranty. Steps to skytrain, Marine Gateway, T&T super market, Golf course and Park. Churchill Sec catchment. Don't miss it!
Housing market conditions continue to favour home buyers VANCOUVER, BC – March 4, 2019 – The Metro Vancouver* housing market saw increased
supply from home sellers and below average demand from home buyers in February.
This document provides details on a 3 bedroom, 2.5 bathroom townhome located in Richmond, British Columbia. Key details include the lot area, bedrooms and bathrooms, year built, taxes, amenities and nearby attractions. The townhome has 9 foot ceilings, granite countertops, laminate flooring, a fireplace, double garage and receives plenty of sunlight. It is located close to schools, Canada Line, shopping and parks.
AVRUPA KONUTLARI ESENTEPE - ENGLISH - Listing TurkeyListing Turkey
Looking for a new home in Istanbul? Look no further than Avrupa Konutlari Esentepe! Our beautifully designed homes provide the perfect blend of luxury and comfort, making them the perfect choice for anyone looking for a high-quality home in the city.
With a wide range of apartment types available, from 1+1 to 4+1, we have something to suit every need and budget. Each apartment is designed with attention to detail and features spacious and bright living areas, making them the perfect place to relax and unwind after a long day.
One of the things that sets Avrupa Konutlari Esentepe apart from other developments is our focus on creating a community that is both comfortable and convenient. Our homes are surrounded by lush green spaces, perfect for enjoying a peaceful stroll or having a picnic with friends and family. Additionally, our complex includes a variety of social and recreational amenities, such as swimming pools, sports fields, and playgrounds, making it easy for residents to stay active and socialize with their neighbors.
https://listingturkey.com/property/avrupa-konutlari-esentepe/
Recent Trends Fueling The Surge in Farmhouse Demand in IndiaFarmland Bazaar
Embarking on the journey to acquire a farmhouse for sale is just the beginning; the real investment lies in crafting an environment that contributes to our mental and physical well-being while satisfying the soul. At Farmlandbazaar.com, India’s leading online marketplace dedicated to farm land, farmhouses, and agricultural lands, we understand the importance of transforming a humble farmland into a warm and inviting sanctuary. Let's explore the fundamental aspects that can elevate your farmhouse into a tranquil haven.
If you're Planning to Build a House in Haldwani, Understanding the House Construction Cost in Haldwani is crucial. It's important to grasp the direct and indirect cost factors entailed in the Construction process before Initiating any work. This Understanding is pivotal for Efficient Budget allocation, allowing you to plan your finances more Effectively. Construction expenses can vary Significantly, Influenced by Diverse Elements such as site Location, raw material prices, Labour charges, and various other variables. Here at Geomatrix, we pride Ourselves on offering competitive rates for house construction in Haldwani, ensuring affordability without Compromising on quality and providing the best options within your budget. For a precise evaluation of the cost involved in constructing your dream home, consult our team of architects and construction experts.
For more information visit:
https://geomatrix.co.in/services/real-estate-project-management-in-haldwani/
BEST FARMLAND FOR SALE | FARM PLOTS NEAR BANGALORE | KANAKAPURA | CHICKKABALP...knox groups real estate
welcome to knox groups real estate company in Bangalore. best farm land for sale near Bangalore and madhugiri . Managed farmland near Kanakapura and Chickkabalapur get know more details about the projects .Knox groups is a leading real estate company dedicated to helping individuals and businesses navigate the dynamic real estate market. With our extensive knowledge, experience, and commitment to excellence, we deliver exceptional results for our clients. Discover the perfect foundation for your agricultural aspirations with KNOX Groups' prime farm lands. These aren't just plots; they're the fertile grounds where vibrant crops flourish, livestock thrives, and unique agricultural ventures come to life. At KNOX, we go beyond selling land we curate sustainable ecosystems, ensuring that your journey toward agricultural success is seamless and prosperous.
The KA Housing - Catalogue - Listing TurkeyListing Turkey
Welcome to KA Housing, a distinguished real estate development nestled in the heart of Eyüpsultan, one of Istanbul’s most promising districts.
Just 10 minutes from the bustling city center, Eyüpsultan offers a serene escape with the convenience of urban living. The direct metro line ensures seamless connectivity to all parts of Istanbul, making it an ideal location for residents who seek both tranquility and vibrancy.
KA Housing boasts unparalleled accessibility, with proximity to Istanbul Airport only 30 minutes away, facilitating easy international travel. Effortless city access is guaranteed by direct metro and transportation links to Istanbul’s cultural and commercial hubs. Quick access to key metro lines connects you to every corner of the city within minutes, making commuting and exploring the city hassle-free.
The development offers luxurious living spaces with a range of unit layouts from 1+1 to 4+1, designed with meticulous attention to detail. Each unit features balconies or terraces, providing stunning vistas of Istanbul and enhancing the living experience. High-quality materials and superior craftsmanship ensure durability and elegance, while sound-proof insulation and high ceilings (2.95 m) offer comfort and sophistication.
Residents of KA Housing enjoy exclusive on-site amenities, including a state-of-the-art gym, outdoor swimming pool, yoga area, and walking paths. Entertainment options abound with a private cinema, children’s playground, and a variety of dining options including a café and restaurant. Security and convenience are paramount with 24/7 security, a dedicated carpark garage, and an IP intercom system.
KA Housing represents a prime investment opportunity with limited availability in a high-demand area, ensuring enduring value and potential for lucrative returns. Homes in this development provide exceptional value without compromising on quality, offering affordable luxury for discerning buyers. The construction is of the highest quality, built to the latest seismic and disaster resistance standards, ensuring safety and resilience.
The community and surroundings of KA Housing are enriched by close proximity to prestigious universities such as Haliç University, Bilgi University, and Istanbul Ticaret University, making it an ideal location for students and academics. The development is adjacent to the Alibeyköy stream leading into the Halic waters, offering serene natural escapes amidst lush greenery. Residents can enjoy the cultural richness of the area, surrounded by historical and cultural landmarks that blend leisure, nature, and culture seamlessly.
https://listingturkey.com/property/the-ka-housing/
Serviced Apartment Ho Chi Minh For RentalGVRenting
GVRenting is the leading rental real estate company in Vietnam. We help you to find a serviced apartment for rent in Ho Chi Minh & Saigon. Discover our broad range of rental properties in Vietnam.
For more details https://gvrenting.com/
Discover Yeni Eyup Evleri 2, nestled among the rising values of Eyupsultan, offering the epitome of modern living in Istanbul.
With its spacious living areas, contemporary architecture, and meticulous details, Yeni Eyup Evleri 2 is poised to be the star of your happiest moments. Situated in the new favorite district of Eyupsultan, claim your spot and unlock the doors to a peaceful life alongside your loved ones. Nestled next to the historical and natural beauties of Eyupsultan, embrace the comfort of modern living and rediscover life.
Social Amenities:
Yeni Eyup 2 offers a life filled with joy with its green landscaping areas, gym, sauna, children’s play areas, café, outdoor pool, and basketball court. Reserve your place for unforgettable moments!
Reliable Structure:
With 1+1, 2+1, and 3+1 apartment options, Yeni Eyup Evleri 2 is designed with first-class materials and craftsmanship. The doors to a safe and comfortable life are here! Choose the option that suits you best and step into your dream home.
Project:
Yeni Eyup 2 is conveniently located, with Istanbul Airport just 26 minutes away, the Mecidiyeköy Metro Line 4 minutes away, and the Tram Stop 5 minutes away, making your life easier with its central location.
Location:
Your home is positioned in a privileged location, providing easy access to the city center, shopping malls, restaurants, schools, and other important places.
Yeni Eyup 2 offers 1+1, 2+1, and 3+1 apartment options designed to meet different needs. Find an option suitable for every lifestyle and open the doors to a comfortable life in your dream home.
https://listingturkey.com/property/yeni-eyup-evleri-2/
Sense Levent Kagithane Catalog - Listing TurkeyListing Turkey
Sense Levent offers a luxurious living experience in the heart of Istanbul’s vibrant Levent district.
This cutting-edge development seamlessly integrates modern design with natural elements, featuring live evergreen plants maintained by an advanced irrigation system, ensuring lush greenery year-round.
The building’s elegant ceramic balconies are both stylish and durable, enhancing the overall aesthetic and functionality. Residents can enjoy the 700m Sky Lounge, which provides breathtaking views of Istanbul and a perfect space to relax and unwind.
Sense Levent promotes a healthy and active lifestyle with a full gym, swimming pool, sauna, and steam room, all available in the building. The interiors are crafted with high-quality materials, ensuring a luxurious and inviting living space.
Designed with young professionals in mind, Sense Levent features 1+1 and 2+1 units with smart floor plans and balconies. The project promises high investment returns, with an expected annual return of 6.5-7%, significantly above Istanbul’s average ROI.
Located in the rapidly growing and highly desirable Levent area, the development benefits from ongoing urban regeneration projects. Its prime location offers proximity to shopping malls, municipal buildings, universities, and public transportation, adding immense value to your investment.
Early investors can take advantage of discounted units during the construction phase, with an expected capital appreciation of +45% USD upon completion. Property Turkey provides comprehensive rental management services, ensuring a seamless and profitable investment experience.
Additionally, robust legal support and significant tax advantages are available through Property Turkey’s licensed Real Estate Investment Fund. Levent is a dynamic urban hub, ideal for young professionals with its numerous corporate headquarters and shopping malls.
Sense Levent is more than just a residence; it’s a place where dreams and opportunities come to life. Contact us today to secure your place in this exclusive development and experience the best of Istanbul living. Sense Levent: Sense the Opportunity. Live the Dream.
https://listingturkey.com/property/sense-levent/
At Geomatrix, we Pride Ourselves on our Commitment to Superior Craftsmanship and client satisfaction. Our team Consists of Highly Qualified specialists including Architects, Engineers, project Managers, and skilled labourers who work seamlessly together to achieve ourclients' Objectives. Geomatrix is recognized as the Best Construction Company in Haldwani, Dedicated to bringing visions to life with unparalleled Expertise and Professionalism.
For more information visit:
https://geomatrix.co.in/
YUKON REAL ESTATE - 1ST QUARTER 2015 STATISTICS - DOME REALTY INC.
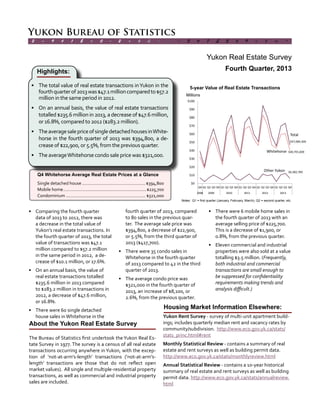
1. First Quarter, 2015
2 ÷ 9 # 1 $ > 0 - 2 + 6 & ± 8 < 3 π 7 £ 5 ‡ 9 ≈ 1 ∞ ^
Yukon Real Estate Survey
Yukon Bureau of Statistics
Q1 Whitehorse Average Real Estate Prices at a Glance
Single detached house ................................................... $384,500
Mobile Home ................................................................. $207,600
Condominium .................................................................$277,300
Duplex............................................................................ $276,800
Housing Market Information Elsewhere:
Yukon Rent Survey - survey of multi-unit apartment buildings; includes quarterly median rent and vacancy rates by com-
munity/subdivision. http://www.eco.gov.yk.ca/stats/stats_princ.html#rent
Monthly Statistical Review - contains a summary of real estate and rent surveys as well as building permit data. http://
www.eco.gov.yk.ca/stats/monthlyreview.html
Annual Statistical Review - contains a 10-year historical summary of real estate and rent surveys as well as building permit
data. http://www.eco.gov.yk.ca/stats/annualreview.html
5-year Value of Real Estate Transactions
• Comparing the first quarter data of
2015 to 2014, there was a decrease
in the total value ofYukon’s real es-
tate transactions. In the first quar-
ter of 2015, the total value of trans-
actions was $34.6 million compared
to $45.1 million in the same period
in 2014, a decrease of $10.6 million,
or 23.4%.
• In the first quarter of 2015, 36 sin-
gle detached houses were sold in
Whitehorse, compared to 43 sold in
the previous quarter. The average
sale price was $384,500 a decrease
of $200, or 0.1%, from the previous
quarter ($384,700).
• Four mobile homes sold in White-
horse in the first quarter of 2015 at
an average price of $207,600.
• There were 36 condo sales inWhite-
horse in the first quarter of 2015,
a decrease of 14 compared to the
fourth quarter of 2014.
• The average condo price was
$277,300 in the first quarter of 2015,
a decrease of $33,000, or 10.6%,
compared to the previous quarter.
• Four duplexes were sold in the first
quarter of 2015 at an average price
of $276,8000.
• Three industrial and three com-
ercial properties sold in the first
quarter of 2015, at values totalling
$763,300 and $2.0 million respec-
tively. (Numbers of both industrial
and commercial transactions are
typically small and are often sup-
pressed for confidentiality reasons
making analysis of trends difficult.)
Highlights:Highlights:
About the Yukon Real Estate Survey
The Bureau of Statistics first undertook the Yukon Real Estate Survey in 1977. The survey is a census of all real estate transac-
tions occurring anywhere inYukon, with the exception of ‘not-at-arm’s-length’ transactions (‘not-at-arm’s-length’ transac-
tions are those that do not reflect open market values). All single and multiple-residential property transactions, as well as
commercial and industrial property sales are included.
Millions
$5,242,200
Notes: Q1 = first quarter (January, February, March), Q2 = second quarter, etc.
• There were $34.6 million in real estate transactions inYu-
kon in the first quarter of 2015 consisting of $29.3 million in
Whitehorse and $5.2 million for the rest ofYukon.
• The averageWhitehorse house sale price was $384,500, a
decrease of $200 from the previous quarter.
• Country Residential homes had the highest average sale
price at $458,900.
• The averageWhitehorse condo sale price was $277,300.
$0
$10
$20
$30
$40
$50
$60
$70
$80
$90
$100
Q1 Q2 Q3 Q4 Q1 Q2 Q3 Q4 Q1 Q2 Q3 Q4 Q1 Q2 Q3 Q4 Q1 Q2 Q3 Q4 Q1
2010 2011 2012 2013 2014 2015
$34,553,300
Total
$29,311,000
Whitehorse
Other Yukon
2. 0
50
100
150
200
250
Value and Type of Real Estate Transactions in Whitehorse
Number of Real Estate Transactions in Whitehorse (Q1 ‘10 to Q1 ‘15)
Single Houses
• A total of 91 real estate transactions occurred in
Whitehorse in the first quarter of 2015, a decrease
of 15 transactions compared to the first quarter of
2014. Over the previous five years, the first quar-
ter average number of sales was 107.
• There were 36 single houses sold in the first quar-
ter of 2015. This number of sales is below the av-
erage number of first quarter sales in the previous
five years, which was 41.
• A total of 36 condos were sold in the first quarter
of 2015.The number of sales is below the average
number of first quarter sales in the previous five
years, which was 42.
• In the first quarter of 2015, four duplexes were
sold in Whitehorse. This figure was below the av-
erage number of first quarter sales (11) in the pre-
vious five years.
• There were four mobile homes sold in the first
quarter of 2015. This figure was the same as the
rounded average of first quarter sales in the past
five years.
1
Total also includes multiple-residential sales which are generally too low to release due to confidentiality requirements.
2
Family Lots include country residential lots. Family lots do not include the majority of lots purchased by contractors.
3
Duplex refers to one side only.
Rows may not total due to rounding.
# of Transactions
Condos
Total1
Duplexes
1
Total also includes multi-residential, commercial and industrial transactions.
x x
Mobiles
Total
1
Single
Detached
Houses Family Lots2
Mobile
Homes Condos Duplexes3
Commercial
Property
Industrial
Property
Value of Real Estate Transactions ($000)
2015 Q1 29,311.0 13,841.9 835.0 830.6 9,983.0 1,107.2 1,950.0 763.3
2014 Q4 39,541.3 16,542.9 x 1,305.4 15,515.3 1,174.0 3,407.0 1,096.6
Q3 66,111.7 32,229.5 x 917.4 8,747.1 3,146.9 19,622.8 x
Q2 51,051.7 32,301.3 x 1,598.5 9,751.3 2,433.5 3,658.0 x
Q1 40,257.5 22,595.6 x 660.0 11,127.9 2,602.0 x 3,082.0
Number of Real Estate Transactions (no.)
2015 Q1 91 36 5 4 36 4 3 3
2014 Q4 116 43 x 5 50 4 7 6
Q3 137 79 x 5 30 10 9 x
Q2 133 76 x 7 32 8 4 x
Q1 106 53 x 3 35 9 x 5
Average Value of Real Estate Transactions ($000)
2015 Q1 322.1 384.5 167.0 207.6 277.3 276.8 650.0 254.4
2014 Q4 340.9 384.7 x 261.1 310.3 293.5 486.7 182.8
Q3 482.6 408.0 x 183.5 291.6 314.7 2180.3 x
Q2 383.8 425.0 x 228.4 304.7 304.2 914.5 x
Q1 379.8 426.3 x 220.0 317.9 289.1 x 616.4
Non-ResidentialResidential
3. $150
$200
$250
$300
$350
$400
$450
$500
Average Median
$382,500
$384,500
$150
$200
$250
$300
$350
$400
$450
$500
Average Median
$205,000
$207,600
$0.0
$0.5
$1.0
$1.5
$2.0
$2.5
$3.0
$3.5
$4.0
$0
$5
$10
$15
$20
$25
$30
$35
$40
Single Detached Houses in Whitehorse by Subdivision
• Four mobile homes were sold in White-
horse in the first quarter of 2015 with a total
transaction value of $830,600, averaging at
$207,600. The median price of mobile homes
was $205,000.
• The record-high average sale value for mobile
homes occurred in the second quarter of 2011
when it reached $272,800. However, it should
be noted that there is a fair bit of volatility in
the average sale price of mobile homes due
to the relatively small number of sales in any
given quarter.
Value of Single House Sales
Value of Mobile Home
Sales
Average and Median
Price of Single Houses
Average and Median
Price of Mobile Homes
Mobile Homes in Whitehorse
Millions Thousands
• A total of 36 single houses were sold in Whitehorse
in the first quarter of 2015 compared to 43 in the
previous quarter. The average price was $384,500, a
decrease of $200, or 0.1%, compared to the previous
quarter ($384,700).
• Comparing the first quarter of 2012 to the first quar-
ter of 2015, the average house price decreased 7.9%
while the Consumer Price Index increased 2.5%. This
shows a real decrease of 10.4% over the last 3 years
(2.5%+7.9%=10.4%).
• The median house price in the first quarter was
$382,500, meaning the prices of half the houses sold
were above this figure and the remaining half, below.
• The chartered bank’s five year conventional mort-
gage rate averaged 4.76% in the first quarter of 2015,
0.03 percentage points lower than the previous quar-
ter.
1
Country Residential includes Wolf Creek, Pineridge, Mary Lake, MacPherson, Hidden Valley etc.
2
Includes Logan and Ingram.
3
Other includes house sales in Hillcrest, Crestview and Valleyview.
Rows may not total due to rounding.
Millions Thousands
Total
Down-
town Riverdale
Porter
Creek Granger
Country
Residential1
Copper
Ridge2
Whistle-
bend Takhini Other3
Value of Single House Sales ($000)
2015 Q1 13,841.9 x 1,236.5 2,196.9 1,535.5 1,835.5 3,635.3 2,354.3 x x
2014 Q4 16,542.9 x 2,066.6 4,217.0 0.0 1,810.0 4,705.0 2,307.4 x 0.0
Q3 32,229.5 1,388.0 5,393.7 5,752.0 x 5,036.9 9,206.8 2,905.5 x x
Q2 32,301.3 x 4,081.9 3,368.9 x 5,903.5 11,334.9 1,788.6 1,200.5 2,691.0
Q1 22,595.6 890.0 3,568.5 2,892.5 x 6,820.0 6,004.0 … x x
Number of Single House Sales (no.)
2015 Q1 36 x 4 6 4 4 9 6 x x
2014 Q4 43 x 6 11 0 4 12 6 x 0
Q3 79 4 15 14 x 10 22 8 x x
Q2 76 x 11 9 x 11 26 5 3 6
Q1 53 3 10 8 x 12 14 … x x
Average Price of Single Houses Sold ($000)
2015 Q1 384.5 x 309.1 366.2 383.9 458.9 403.9 392.4 x x
2014 Q4 384.7 x 344.4 383.4 … 452.5 392.1 384.6 x …
Q3 408.0 347.0 359.6 410.9 x 503.7 418.5 363.2 x x
Q2 425.0 x 371.1 374.3 x 536.7 436.0 357.7 400.2 448.5
Q1 426.3 296.7 356.9 361.6 x 568.3 428.9 … x x
4. $150
$200
$250
$300
$350
$400
$450
$500
Average Median
$259,000
$277,300
$150
$200
$250
$300
$350
$400
$450
$500
Average Median
$292,500
$276,800
$0
$5
$10
$15
$20
$25
$30
Additional information
Government of Yukon
Executive Council Office
Bureau of Statistics (A-8C)
Box 2703, Whitehorse, Yukon Y1A 2C6
Telephone: (867) 667-5640; Fax: (867) 393-6203
email: ybsinfo@gov.yk.ca
website: www.eco.gov.yk.ca/stats/Bureau of Statistics
Executive Council Office
Condominiums in Whitehorse
Duplexes1
in Whitehorse
Value of Condominium
Sales
Value of Duplex Sales
Average and Median
Price of Condominiums
Average and Median
Price of Duplexes
• Duplex sales in the first quarter of 2015 to-
talled $1.1 million. The record-high for duplex
sales was $7.7 million, set in the second quar-
ter of 2012.
• There were 4 duplex sales in the first quarter of
2015. The record-high number of duplex sales
occurred in the second quarter of 2012 when
24 duplexes were sold.
• The average duplex price was $276,800 in the
first quarter of 2015 while the median price was
$292,500.
• Condo sales in the first quarter of 2015 totalled
$10.0 million. The record-high condo sales was in
the second quarter of 2012 at $24.0 million.
• There were 36 condo sales in the first quarter of
2015 compared to 50 sales in the previous quar-
ter. The record-high condo sales occurred in the
second quarter of 2012 when 80 condos were sold.
• The average condo price was $277,300 in the first
quarter of 2015, an decrease of $33,000, or 10.6%,
compared to the previous quarter ($310,300). The
median condo price was $259,000 in the first quar-
ter of 2015. It should be noted that there is a fair bit
of volatility in the average and median condo price
on a quarterly basis. This is due in part to new condo
projects being completed and multiple units being
sold at the same or near the same value in one quar-
ter. Depending on the selling prices of these units,
this could have a significant effect on the average
condo prices.
Information sheet no. 57 - May 2015
Next release-September 2015
Millions Thousands
Millions Thousands
1
Duplex refers to one side only.
x = suppressed for confidentiality ... = not appropriate/applicable
$0
$1
$2
$3
$4
$5
$6
$7
$8
$9
x
x