SlideShare a Scribd company logo
Early spring market reflects consumer confidence and growing demand
A total of 590 properties sold in the Victoria Real Estate Board region this March, 29.2 per cent fewer than the 833
properties sold in March 2022 but a 28.3 per cent increase from February 2023. Sales of condominiums were down 29.4
per cent from March 2022 with 197 units sold. Sales of single family homes decreased 31.8 per cent from March 2022
with 281 sold.
“We’ve seen our sales numbers this month almost double from January,” said Victoria Real Estate Board Chair Graden
Sol. “As we move further into spring, we expect that the return to confidence we’ve seen in the market will continue.
What we can’t predict is what the overall impact on pricing will be if we continue to see quite low inventory across our
community. Some pockets of our market are busier than others - by working with your REALTOR® you can better
understand the market you are in.”
There were 1,970 active listings for sale on the Victoria Real Estate Board Multiple Listing Service® at the end of
March 2023, an increase of 8.9 per cent compared to the previous month of February and an 85.3 per cent
increase from the 1,063 active listings for sale at the end of March 2022.
“Demand is recovering,” adds Sol. “Compared to the end of 2022, prices have firmed up and interest rates have become
normalized. Consumers are more active, and we are seeing quite a few multiple offers on well-priced properties.
Inventory continues to trend lower than long term averages. As our spring market continues to strengthen, we may start
to experience some upward pressure on pricing again. We have been talking about the need for supply to help moderate
pricing for a long time. Premier Eby’s announcement this week about the provincial government’s Homes for People
action plan reflects an increasing awareness of the importance of supply. We need all levels of government to continue to
focus on solving our market housing crunch, so we do not return to the high-pressure markets of the recent past.”
The Multiple Listing Service® Home Price Index benchmark value for a single family home in the Victoria Core in
March 2022 was $1,387,200. The benchmark value for the same home in March 2023 decreased by 10.9 per cent to
$1,236,200, down from February’s value of $1,247,200. The MLS® HPI benchmark value for a condominium in the
Victoria Core area in March 2022 was $616,400, while the benchmark value for the same condominium in March 2023
decreased by 9.1 per cent to $560,300, down from the February value of $568,200.
About the Victoria Real Estate Board – Founded in 1921, the Victoria Real Estate Board is a key player in the
development of standards and innovative programs to enhance the professionalism of REALTORS®. The Victoria Real
Estate Board represents 1,608 local Realtors. If you are thinking about buying or selling a home, connect with your local
Realtor for detailed information on the Victoria and area housing market.
Single family homes Condominiums Townhomes
March 2023 total sales
Compared to March 2022 sales
MLS® HPI
281
$1,236,200
197
-31.8% -29.4%
67
-21.2%
$560,300 $813,500
*Victoria Core
Sales by Property Type
Single Family Greater Victoria
Single Family Other Areas
Single Family Total All Areas
Condo Apartment
Row/Townhouse
Manufactured Home
Total Residential
Total Sales
Active Listings
Units Median$
Average$
LY%
LM% LY%
LM% LY%
LM% Units Median$
Average$ Units Median$
Average$
March 2023
266
197
67
15
560
281
590
15
1,970
213
161
45
10
436
220
460
7
1,809
395
279
85
18
794
412
833
17
1,063
$1,241,248
$628,230
$774,710
$338,667
$1,225,446
$945,226
$1,100,000
$569,500
$750,000
$317,500
$1,080,000
$950,000
$1,285,306
$579,025
$788,113
$355,450
$1,272,933
$896,442
$1,100,000
$547,000
$744,000
$389,500
$1,100,000
$750,000
$1,433,135
$672,283
$864,158
$331,872
$1,426,628
$1,275,450
$1,312,395
$611,000
$840,500
$287,500
$1,310,000
$1,183,000
24.9%
22.4%
48.9%
50.0%
28.4%
27.7%
28.3%
114.3%
8.9%
-32.7%
-29.4%
-21.2%
-16.7%
-29.5%
-31.8%
-29.2%
-11.8%
85.3%
-3.4%
8.5%
-1.7%
-4.7%
-3.7%
5.4%
-13.4%
-6.6%
-10.4%
2.0%
-14.1%
-25.9%
0.0%
4.1%
0.8%
-18.5%
-1.8%
26.7%
-16.2%
-6.8%
-10.8%
10.4%
-17.6%
-19.7%
February 2023 March 2022
Legend
Units: net number of listings sold
LM%: percentage change since Last Month
LY%: percentage change since This Month Last Year
Average$: average selling price
Median$: median selling price
Total Residential: includes sales of residential property types
Total Sales: includes sales of all property types
Active Listings: total listings of all types on the market at midnight on the last day of the month
This Month Last Month
Produced: 03-Apr-2023
March 2023
Previous Periods Comparison
This Month Last Year
Page 1 of 1
Victoria Real Estate Board Multiple Listing Service ®
March 2023
Statistics Package for Media
Victoria Real Estate Board March 2023 Statistics - page 2
Previous Periods Comparison of Unit Sales, Average Prices and Median Prices
Previous Periods Comparison of MLS® HPI Benchmark Prices and MLS® HPI Index Values
6DOHVWR$FWLYH/LVWLQJV5DWLR
The ratio of counts of total residential sales over total active residential listings for the last 25 months
0DUFK
Produced: 03-Apr-2023


0DU
$SU
0D
-XQ
-XO
$XJ
6HS
2FW
1RY
'HF
-DQ
)HE
0DU
$SU
0D
-XQ
-XO
$XJ
6HS
2FW
1RY
'HF
-DQ
)HE
0DU
7KH6DOHVWR$FWLYH/LVWLQJV5DWLR
7KLV FKDUWWUDFNVWKHUDWLRRIWRWDOUHVLGHQWLDOVDOHVRYHUWRWDODFWLYHUHVLGHQWLDOOLVWLQJVDWPRQWKHQGIRU
HDFKRIWKHODVWPRQWKV
7KHDFWLYHOLVWLQJFRXQWDQGWKHVDOHVFRXQWFDQEHYLHZHGDVLQGLFDWRUVRIKRXVLQJVXSSODQG
GHPDQGUHVSHFWLYHO2EVHUYLQJWKHUDWLREHWZHHQWKHPFDQWKXVKHOSLQGLFDWHDEXHUV PDUNHW
ZKHUHWKHUHLVVXVWDLQHGGRZQZDUGSUHVVXUHRQSULFHVDQGDVHOOHUV PDUNHWZKHUHWKHUHLV
VXVWDLQHGXSZDUGSUHVVXUHRQSULFHV
%DVHGRQDUHJUHVVLRQDQDOVLVSHUIRUPHGEWKH(FRQRPLFV'HSDUWPHQWRIWKH%5HDO(VWDWH
$VVRFLDWLRQLQHDFKPDUNHWDUHDRIWKHSURYLQFHWKH6DOHVWR$FWLYH/LVWLQJV5DWLRIRU9LFWRULDFDQEH
LQWHUSUHWHGDVIROORZV
 EHORZWKHUHLVGRZQZDUGSUHVVXUHRQSULFHV EXHUV PDUNHW
 DERYHWKHUHLVXSZDUGSUHVVXUHRQSULFHV VHOOHUV PDUNHW
Sales to Active Listings Ratio
This chart tracks the ratio of total residential sales over total active residential listings at month-end for each of
the last 25 months.
Based on a regression analysis performed by the economics department at the BC Real Estate Association in
each market area of the province, the Sales to Active Listings Ratio for Victoria can be interpreted as follows:
- below 14%, there is downward pressure on prices (buyers' market)
- above 20%, there is upward pressure on prices (sellers' market)
- in the 14-20% range, there is little pressure on prices either way (balanced market)
Victoria Real Estate Board March 2023 Statistics - page 3
Total new MLS® listings and total MLS® sales for entire district
The Victoria Real Estate Board uses the MLS® Home Price Index (MLS® HPI) to report on market
trends. The MLS® HPI uses the concept of a benchmark home, a notional home with common
attributes of typical homes in a defined area.
Through the analysis of over fifteen years of Victoria Real Estate Board MLS® sales data, the MLS®
HPI defined benchmark homes for Victoria in each category (single family homes, townhouses,
condos) and for each neighbourhood. The benchmark starting point was 2005, where each type of
property and neighbourhood was assigned an index value of 100.
*The HPI reporting herein is based on the SOLD date.
Victoria Real Estate Board March 2023 Statistics - page 4
MLS® HPI benchmark and value - Single Family Homes
MLS® HPI benchmark and value - Condominium / Apartments
Victoria Real Estate Board March 2023 Statistics - page 5
Note: Areas with insufficient sales are not included in the HPI.
Source: Victoria Real Estate Board
March 2023 1 Month Ago 3 Months Ago 6 Months Ago 12 Months Ago 3 Years Ago 5 Years Ago January 2005
Victoria REB – SF-All $808,300 $790,000 $370,800
$1,234,800
$1,218,500
$1,135,600
$1,113,200
$1,108,100
Benchmark Price by Timeframe and Property Type
Value or percent change
Value
Percent change
HPI or Benchmark Price
HPI
Benchmark Price
1. Area Group
VREB District Summary
3. Area/Property Type Selection
– Victoria REB – SF-All
2. Property Type
– Single Family-All (SF-All)
Note: Areas with insufficient sales are not included in the HPI.
Source: Victoria Real Estate Board
March 2023 1 Month Ago 3 Months Ago 6 Months Ago 12 Months Ago 3 Years Ago 5 Years Ago January 2005
Victoria REB – SF-All 333.0
328.6
306.3
300.2
298.8 218.0 213.1 100.0
HPI by Timeframe and Property Type
Value or percent change
Value
Percent change
HPI or Benchmark Price
HPI
Benchmark Price
1. Area Group
VREB District Summary
3. Area/Property Type Selection
– Victoria REB – SF-All
2. Property Type
– Single Family-All (SF-All)
Note: Areas with insufficient sales are not included in the HPI.
Source: Victoria Real Estate Board
March 2023 1 Month Ago 3 Months Ago 6 Months Ago 12 Months Ago 3 Years Ago 5 Years Ago January 2005
Victoria REB – Con $609,900 $607,400
$563,600
$563,300
$558,100 $445,800 $410,700 $169,900
Benchmark Price by Timeframe and Property Type
Value or percent change
Value
Percent change
HPI or Benchmark Price
HPI
Benchmark Price
1. Area Group
VREB District Summary
3. Area/Property Type Selection
– Victoria REB – Con
2. Property Type
– Condo Apartment (Con)
Note: Areas with insufficient sales are not included in the HPI.
Source: Victoria Real Estate Board
March 2023 1 Month Ago 3 Months Ago 6 Months Ago 12 Months Ago 3 Years Ago 5 Years Ago January 2005
Victoria REB – Con 359.0 357.5
331.7
331.5
328.5 262.4 241.7 100.0
HPI by Timeframe and Property Type
Value or percent change
Value
Percent change
HPI or Benchmark Price
HPI
Benchmark Price
1. Area Group
VREB District Summary
3. Area/Property Type Selection
– Victoria REB – Con
2. Property Type
– Condo Apartment (Con)
Note: Areas with insufficient sales are not included in the HPI.
Source: Victoria Real Estate Board
March 2023 1 Month Ago 3 Months Ago 6 Months Ago 12 Months Ago 3 Years Ago 5 Years Ago January 2005
Victoria REB – Twn $818,800
$790,700 $784,400
$763,500
$748,300 $561,900 $530,800 $258,200
Benchmark Price by Timeframe and Property Type
Value or percent change
Value
Percent change
HPI or Benchmark Price
HPI
Benchmark Price
1. Area Group
VREB District Summary
3. Area/Property Type Selection
– Victoria REB – Twn
2. Property Type
– Townhouse (Twn)
Note: Areas with insufficient sales are not included in the HPI.
Source: Victoria Real Estate Board
March 2023 1 Month Ago 3 Months Ago 6 Months Ago 12 Months Ago 3 Years Ago 5 Years Ago January 2005
Victoria REB – Twn 317.1
306.2 303.8
295.7
289.8 217.6 205.6 100.0
HPI by Timeframe and Property Type
Value or percent change
Value
Percent change
HPI or Benchmark Price
HPI
Benchmark Price
1. Area Group
VREB District Summary
3. Area/Property Type Selection
– Victoria REB – Twn
2. Property Type
– Townhouse (Twn)
Note: Areas with insufficient sales are not included in the HPI.
Source: Victoria Real Estate Board
Victoria REB – SF-All Core – SF-All Westshore – SF-All Peninsula – SF-All
Select Date Range:
All values
Jan
2003
Jan
2005
Jan
2007
Jan
2009
Jan
2011
Jan
2013
Jan
2015
Jan
2017
Jan
2019
Jan
2021
Jan
2023
Benchmark
Price
($)
200,000
400,000
600,000
800,000
1,000,000
1,200,000
1,400,000
Benchmark Price Performance over Time
1. Area Group
VREB Area Summary
3. Area/Property Type Selection
Multiple values
2. Property Type
– Single Family-All (SF-All)
HPI or Benchmark Price
HPI
Benchmark Price
Adding labels
Hold Ctrl (Cmd) and select points on the chart to show multiple date/value labels
Note: Areas with insufficient sales are not included in the HPI.
Source: Victoria Real Estate Board
Victoria REB – Con Core – Con Westshore – Con Peninsula – Con
Select Date Range:
All values
Jan
2003
Jan
2005
Jan
2007
Jan
2009
Jan
2011
Jan
2013
Jan
2015
Jan
2017
Jan
2019
Jan
2021
Jan
2023
Benchmark
Price
($)
100,000
200,000
300,000
400,000
500,000
600,000
Benchmark Price Performance over Time
1. Area Group
VREB Area Summary
3. Area/Property Type Selection
All
2. Property Type
– Condo Apartment (Con)
HPI or Benchmark Price
HPI
Benchmark Price
Adding labels
Hold Ctrl (Cmd) and select points on the chart to show multiple date/value labels
Note: Areas with insufficient sales are not included in the HPI.
Source: Victoria Real Estate Board
Victoria REB – Twn Core – Twn Westshore – Twn Peninsula – Twn
Select Date Range:
All values
Jan
2003
Jan
2005
Jan
2007
Jan
2009
Jan
2011
Jan
2013
Jan
2015
Jan
2017
Jan
2019
Jan
2021
Jan
2023
Benchmark
Price
($)
200,000
300,000
400,000
500,000
600,000
700,000
800,000
900,000
Benchmark Price Performance over Time
1. Area Group
VREB Area Summary
3. Area/Property Type Selection
Multiple values
2. Property Type
– Townhouse (Twn)
HPI or Benchmark Price
HPI
Benchmark Price
Adding labels
Hold Ctrl (Cmd) and select points on the chart to show multiple date/value labels
Note: Areas with insufficient sales are not included in the HPI.
Source: Victoria Real Estate Board
Victoria REB – SF-All Victoria REB – Twn Victoria REB – Con
Select Date Range:
All values
Jan
2003
Jan
2005
Jan
2007
Jan
2009
Jan
2011
Jan
2013
Jan
2015
Jan
2017
Jan
2019
Jan
2021
Jan
2023
Benchmark
Price
($)
200,000
400,000
600,000
800,000
1,000,000
1,200,000
Benchmark Price Performance over Time
1. Area Group
VREB Area Summary
3. Area/Property Type Selection
Multiple values
2. Property Type
Multiple values
HPI or Benchmark Price
HPI
Benchmark Price
Adding labels
Hold Ctrl (Cmd) and select points on the chart to show multiple date/value labels
Monthly Sales Summary (Mark I)
Residential Waterfront Properties Integrated Into Their Own Districts
Units Total Volume
March 2023
District
Produced: 03-Apr-2023
Residential
Single Family Detached
l
Greater Victoria
Victoria / Victoria West 34 $39,881,500
Oak Bay 20 $33,196,900
Esquimalt 11 $11,360,000
View Royal 9 $9,984,300
Saanich East 46 $66,324,400
Saanich West 19 $25,085,898
Central Saanich 14 $20,182,000
North Saanich 11 $18,120,000
Sidney 8 $7,594,000
Highlands 1 $1,200,000
Colwood 23 $24,174,980
Langford 33 $39,553,312
Metchosin 2 $3,000,000
Sooke 25 $22,189,760
Gulf Islands 10 $8,325,000
Total Greater Victoria 266 $330,172,050
Other Areas
Malahat  Area 15 $14,178,387
Total Other Areas 15 $14,178,387
Total Single Family Detached 281 $344,350,437
Condo Apartment
l
Greater Victoria
Victoria / Victoria West 99 $61,528,987
Oak Bay 7 $6,249,000
Esquimalt 15 $8,971,700
View Royal 1 $650,000
Saanich East 24 $16,016,800
Saanich West 10 $5,159,799
Central Saanich 3 $1,534,900
North Saanich 1 $747,800
Sidney 14 $9,541,900
Colwood 7 $4,559,900
Langford 14 $7,895,465
Sooke 1 $300,000
Total Greater Victoria 196 $123,156,251
Other Areas
Malahat  Area 1 $605,000
Total Other Areas 1 $605,000
Total Condo Apartment 197 $123,761,251
Page 1 of 3
Victoria Real Estate Board Multiple Listing Service ®
Monthly Sales Summary (Mark I)
Residential Waterfront Properties Integrated Into Their Own Districts
Units Total Volume
March 2023
District
Produced: 03-Apr-2023
Row/Townhouse
l
Greater Victoria
Victoria / Victoria West 3 $2,674,900
Esquimalt 3 $2,025,000
View Royal 3 $1,734,999
Saanich East 11 $10,012,957
Saanich West 7 $5,282,500
Central Saanich 3 $2,640,000
North Saanich 2 $2,135,000
Sidney 3 $2,459,900
Colwood 9 $6,795,365
Langford 19 $13,737,919
Sooke 4 $2,407,000
Total Greater Victoria 67 $51,905,540
Total Row/Townhouse 67 $51,905,540
Manufactured Home
l
Greater Victoria
View Royal 2 $565,000
Central Saanich 5 $1,721,500
Sidney 2 $1,076,500
Langford 2 $605,000
Sooke 2 $532,000
Gulf Islands 1 $255,000
Total Greater Victoria 14 $4,755,000
Other Areas
Malahat  Area 1 $325,000
Total Other Areas 1 $325,000
Total Manufactured Home 15 $5,080,000
Total Residential 560 $525,097,228
Page 2 of 3
Victoria Real Estate Board Multiple Listing Service ®
Monthly Sales Summary (Mark I)
Residential Waterfront Properties Integrated Into Their Own Districts
Units Total Volume
March 2023
District
Produced: 03-Apr-2023
$538,946,000
590
Grand Totals
Other Property
Lots  Acreage
l
Greater Victoria
Victoria / Victoria West 1 $1,388,000
Saanich East 1 $730,000
Colwood 1 $550,000
Langford 1 $649,000
Sooke 1 $330,000
Gulf Islands 4 $1,510,000
Total Greater Victoria 9 $5,157,000
Total Lots  Acreage 9 $5,157,000
21 $8,691,772
Other Commercial Properties
l
Page 3 of 3
Victoria Real Estate Board Multiple Listing Service ®
Monthly Sales Summary (Mark II)
Waterfront Properties Segregated Into a 'Waterfront' District
Units Total Volume
March 2023
District
Produced: 03-Apr-2023
Residential
Single Family Detached
l
Greater Victoria
Victoria 32 $37,241,500
Victoria West 2 $2,640,000
Oak Bay 20 $33,196,900
Esquimalt 11 $11,360,000
View Royal 8 $8,704,300
Saanich East 44 $57,679,400
Saanich West 18 $21,515,898
Central Saanich 14 $20,182,000
North Saanich 9 $14,555,000
Sidney 8 $7,594,000
Highlands 1 $1,200,000
Colwood 23 $24,174,980
Langford 33 $39,553,312
Metchosin 2 $3,000,000
Sooke 24 $20,814,760
Gulf Islands 9 $6,425,000
Waterfront (all districts) 8 $20,335,000
Total Greater Victoria 266 $330,172,050
Other Areas
Malahat  Area 15 $14,178,387
Total Other Areas 15 $14,178,387
Total Single Family Detached 281 $344,350,437
Condo Apartment
l
Greater Victoria
Victoria 80 $46,486,987
Victoria West 11 $7,568,000
Oak Bay 6 $5,689,000
Esquimalt 12 $6,466,800
View Royal 1 $650,000
Saanich East 24 $16,016,800
Saanich West 9 $4,809,800
Central Saanich 3 $1,534,900
North Saanich 1 $747,800
Sidney 13 $8,911,900
Colwood 6 $4,039,900
Langford 14 $7,895,465
Waterfront (all districts) 16 $12,338,899
Total Greater Victoria 196 $123,156,251
Other Areas
Waterfront (all districts) 1 $605,000
Total Other Areas 1 $605,000
Total Condo Apartment 197 $123,761,251
Page 1 of 3
Victoria Real Estate Board Multiple Listing Service ®
Monthly Sales Summary (Mark II)
Waterfront Properties Segregated Into a 'Waterfront' District
Units Total Volume
March 2023
District
Produced: 03-Apr-2023
Row/Townhouse
l
Greater Victoria
Victoria 3 $2,674,900
Esquimalt 3 $2,025,000
View Royal 3 $1,734,999
Saanich East 11 $10,012,957
Saanich West 7 $5,282,500
Central Saanich 2 $1,590,000
North Saanich 2 $2,135,000
Sidney 3 $2,459,900
Colwood 9 $6,795,365
Langford 19 $13,737,919
Sooke 3 $1,842,000
Waterfront (all districts) 2 $1,615,000
Total Greater Victoria 67 $51,905,540
Total Row/Townhouse 67 $51,905,540
Manufactured Home
l
Greater Victoria
View Royal 2 $565,000
Central Saanich 5 $1,721,500
Sidney 2 $1,076,500
Langford 2 $605,000
Sooke 2 $532,000
Gulf Islands 1 $255,000
Total Greater Victoria 14 $4,755,000
Other Areas
Malahat  Area 1 $325,000
Total Other Areas 1 $325,000
Total Manufactured Home 15 $5,080,000
Total Residential 560 $525,097,228
Page 2 of 3
Victoria Real Estate Board Multiple Listing Service ®
Monthly Sales Summary (Mark II)
Waterfront Properties Segregated Into a 'Waterfront' District
Units Total Volume
March 2023
District
Produced: 03-Apr-2023
$538,946,000
590
Grand Totals
Other Property
Lots  Acreage
l
Greater Victoria
Victoria / Victoria West 1 $1,388,000
Saanich East 1 $730,000
Colwood 1 $550,000
Langford 1 $649,000
Sooke 1 $330,000
Gulf Islands 4 $1,510,000
Total Greater Victoria 9 $5,157,000
Total Lots  Acreage 9 $5,157,000
21 $8,691,772
Other Commercial Properties
l
Page 3 of 3
Victoria Real Estate Board Multiple Listing Service ®
Sales to Active Listings Ratio
The ratio of counts of total residential sales over total active residential listings for the last 25 months
March 2023
Produced: 03-Apr-2023
10%
20%
30%
40%
50%
60%
70%
80%
90%
100%
110%
120%
Mar
2021
Apr
2021
May
2021
Jun
2021
Jul
2021
Aug
2021
Sep
2021
Oct
2021
Nov
2021
Dec
2021
Jan
2022
Feb
2022
Mar
2022
Apr
2022
May
2022
Jun
2022
Jul
2022
Aug
2022
Sep
2022
Oct
2022
Nov
2022
Dec
2022
Jan
2023
Feb
2023
Mar
2023
The Sales to Active Listings Ratio
This chart tracks the ratio of total residential sales over total active residential listings at month-end for
each of the last 25 months.
The active listing count and the sales count can be viewed as indicators of housing supply and
demand respectively. Observing the ratio between them can thus help indicate a buyers' market,
where there is sustained downward pressure on prices, and a sellers' market, where there is
sustained upward pressure on prices.
Based on a regression analysis performed by the Economics Department of the BC Real Estate
Association in each market area of the province, the Sales to Active Listings Ratio for Victoria can be
interpreted as follows:
- below 14%, there is downward pressure on prices (buyers' market)
- above 20%, there is upward pressure on prices (sellers' market)
- in the 14-20% range, there is little pressure on prices either way (balanced market)
Victoria Real Estate Board Multiple Listing Service ® Page 1 of 1
Monthly Comparative Activity By Property Type
Includes All MLS® Property Types
March 2023
Current Month
This Year % Change
Last Year
Year To Date
This Year % Change
Last Year
Produced: 03-Apr-2023
Single Family - Residential
Units Listed 410
Units Sold 237
Sell/List Ratio 58
Sales Dollars $279,392,662
Average Price / Unit $1,178,872
Price Ratio 99
Days To Sell 39
Active Listings at Month End 552
%
%
470
329
70
$458,170,136
$1,392,614
106
12
276
%
%
-13
-28
-39
-15
235
100
%
%
%
%
%
%
940
490
52
$587,457,891
$1,198,894
98
41
%
%
1019
727
71
$1,008,132,308
$1,386,702
107
13
%
%
-8
-33
-42
-14
229
%
%
%
%
%
Single Family - Residential Waterfront
Units Listed 27
Units Sold 8
Sell/List Ratio 30
Sales Dollars $20,335,000
Average Price / Unit $2,541,875
Price Ratio 96
Days To Sell 81
Active Listings at Month End 100
%
%
34
16
47
$48,148,702
$3,009,294
98
51
63
%
%
-21
-50
-58
-16
59
59
%
%
%
%
%
%
84
27
32
$65,862,000
$2,439,333
93
66
%
%
78
39
50
$102,283,452
$2,622,653
100
50
%
%
8
-31
-36
-7
33
%
%
%
%
%
Single Family - Residential Acreage
Units Listed 59
Units Sold 23
Sell/List Ratio 39
Sales Dollars $32,774,900
Average Price / Unit $1,424,996
Price Ratio 96
Days To Sell 49
Active Listings at Month End 113
%
%
46
30
65
$48,913,000
$1,630,433
99
26
48
%
%
28
-23
-33
-13
91
135
%
%
%
%
%
%
133
52
39
$71,850,900
$1,381,748
94
66
%
%
96
57
59
$91,604,600
$1,607,098
100
30
%
%
39
-9
-22
-14
120
%
%
%
%
%
Condo Apartment
Units Listed 342
Units Sold 197
Sell/List Ratio 58
Sales Dollars $123,761,251
Average Price / Unit $628,230
Price Ratio 98
Days To Sell 33
Active Listings at Month End 468
%
%
344
279
81
$187,567,053
$672,283
104
14
212
%
%
-1
-29
-34
-7
136
121
%
%
%
%
%
%
853
459
54
$278,259,003
$606,229
98
36
%
%
900
734
82
$497,369,917
$677,616
104
17
%
%
-5
-37
-44
-11
116
%
%
%
%
%
Page 1 of 8
Victoria Real Estate Board Multiple Listing Service ®
Monthly Comparative Activity By Property Type
Includes All MLS® Property Types
March 2023
Current Month
This Year % Change
Last Year
Year To Date
This Year % Change
Last Year
Produced: 03-Apr-2023
Row/Townhouse
Units Listed 112
Units Sold 67
Sell/List Ratio 60
Sales Dollars $51,905,540
Average Price / Unit $774,710
Price Ratio 99
Days To Sell 33
Active Listings at Month End 173
%
%
140
85
61
$73,453,453
$864,158
107
14
75
%
%
-20
-21
-29
-10
144
131
%
%
%
%
%
%
287
149
52
$111,877,141
$750,853
99
38
%
%
289
227
79
$201,651,028
$888,331
106
18
%
%
-1
-34
-45
-15
106
%
%
%
%
%
Half Duplex (Up and Down)
Units Listed 1
Units Sold 1
Sell/List Ratio 100
Sales Dollars $615,000
Average Price / Unit $615,000
Price Ratio 103
Days To Sell 18
Active Listings at Month End 2
%
%
1
1
100
$840,000
$840,000
94
27
2
%
%
0
0
-27
-27
-33
0
%
%
%
%
%
%
4
1
25
$615,000
$615,000
103
18
%
%
3
2
67
$2,624,000
$1,312,000
95
218
%
%
33
-50
-77
-53
-92
%
%
%
%
%
Half Duplex (Side by Side)
Units Listed 25
Units Sold 9
Sell/List Ratio 36
Sales Dollars $7,851,875
Average Price / Unit $872,431
Price Ratio 100
Days To Sell 33
Active Listings at Month End 33
%
%
33
24
73
$21,950,004
$914,584
108
8
21
%
%
-24
-63
-64
-5
305
57
%
%
%
%
%
%
59
40
68
$35,630,538
$890,763
100
31
%
%
72
51
71
$46,640,899
$914,527
108
13
%
%
-18
-22
-24
-3
136
%
%
%
%
%
Half Duplex (Front and Back)
Units Listed 3
Units Sold 2
Sell/List Ratio 67
Sales Dollars $1,856,000
Average Price / Unit $928,000
Price Ratio 103
Days To Sell 9
Active Listings at Month End 3
%
%
6
2
33
$1,925,000
$962,500
114
6
3
%
%
-50
0
-4
-4
55
0
%
%
%
%
%
%
7
5
71
$4,704,100
$940,820
100
21
%
%
11
3
27
$2,536,000
$845,333
113
8
%
%
-36
67
85
11
165
%
%
%
%
%
Page 2 of 8
Victoria Real Estate Board Multiple Listing Service ®
Monthly Comparative Activity By Property Type
Includes All MLS® Property Types
March 2023
Current Month
This Year % Change
Last Year
Year To Date
This Year % Change
Last Year
Produced: 03-Apr-2023
Recreational
Units Listed 4
Units Sold 0
Sell/List Ratio
Sales Dollars $0
Average Price / Unit
Price Ratio
Days To Sell
Active Listings at Month End 11
%
%
6
5
83
$1,079,000
$215,800
96
57
9
%
%
-33
-100
-100
22
%
%
%
%
%
%
8
2
25
$357,500
$178,750
96
47
%
%
10
7
70
$2,043,250
$291,893
94
65
%
%
-20
-71
-83
-39
-28
%
%
%
%
%
Manufactured Home
Units Listed 20
Units Sold 15
Sell/List Ratio 75
Sales Dollars $5,080,000
Average Price / Unit $338,667
Price Ratio 97
Days To Sell 54
Active Listings at Month End 38
%
%
30
18
60
$5,973,701
$331,872
101
27
33
%
%
-33
-17
-15
2
104
15
%
%
%
%
%
%
47
30
64
$10,269,500
$342,317
96
64
%
%
64
44
69
$14,880,101
$338,184
100
32
%
%
-27
-32
-31
1
97
%
%
%
%
%
Residential Lots
Units Listed 27
Units Sold 6
Sell/List Ratio 22
Sales Dollars $3,802,000
Average Price / Unit $633,667
Price Ratio 96
Days To Sell 108
Active Listings at Month End 93
%
%
26
13
50
$7,149,850
$549,988
101
27
39
%
%
4
-54
-47
15
296
138
%
%
%
%
%
%
79
11
14
$7,127,000
$647,909
95
103
%
%
71
44
62
$24,896,046
$565,819
100
29
%
%
11
-75
-71
15
258
%
%
%
%
%
Residential Lots - Waterfront
Units Listed 2
Units Sold 0
Sell/List Ratio
Sales Dollars $0
Average Price / Unit
Price Ratio
Days To Sell
Active Listings at Month End 13
%
%
3
1
33
-$667,000
-$667,000
66
7
8
%
%
-33
-100
-100
63
%
%
%
%
%
%
6
1
17
$1,250,000
$1,250,000
93
21
%
%
10
2
20
$1,633,000
$816,500
110
7
%
%
-40
-50
-23
53
215
%
%
%
%
%
Page 3 of 8
Victoria Real Estate Board Multiple Listing Service ®
Monthly Comparative Activity By Property Type
Includes All MLS® Property Types
March 2023
Current Month
This Year % Change
Last Year
Year To Date
This Year % Change
Last Year
Produced: 03-Apr-2023
Residential Acreage
Units Listed 12
Units Sold 3
Sell/List Ratio 25
Sales Dollars $1,355,000
Average Price / Unit $451,667
Price Ratio 97
Days To Sell 144
Active Listings at Month End 50
%
%
10
4
40
$4,324,000
$1,081,000
104
111
33
%
%
20
-25
-69
-58
30
52
%
%
%
%
%
%
26
6
23
$4,786,000
$797,667
99
119
%
%
32
16
50
$12,239,400
$764,963
100
98
%
%
-19
-63
-61
4
21
%
%
%
%
%
Residential Acreage - Waterfront
Units Listed 5
Units Sold 0
Sell/List Ratio
Sales Dollars $0
Average Price / Unit
Price Ratio
Days To Sell
Active Listings at Month End 22
%
%
1
0
$0
3
%
%
400
633
%
%
%
%
%
%
9
1
11
$2,750,000
$2,750,000
92
57
%
%
4
3
75
$2,014,000
$671,333
96
134
%
%
125
-67
37
310
-57
%
%
%
%
%
Revenue - Duplex/Triplex
Units Listed 5
Units Sold 1
Sell/List Ratio 20
Sales Dollars $1,525,000
Average Price / Unit $1,525,000
Price Ratio 95
Days To Sell 50
Active Listings at Month End 8
%
%
11
5
45
$6,745,000
$1,349,000
101
14
10
%
%
-55
-80
-77
13
262
-20
%
%
%
%
%
%
13
4
31
$5,896,000
$1,474,000
92
55
%
%
26
14
54
$20,151,000
$1,439,357
107
12
%
%
-50
-71
-71
2
356
%
%
%
%
%
Revenue - Multi Units
Units Listed 5
Units Sold 4
Sell/List Ratio 80
Sales Dollars $5,030,000
Average Price / Unit $1,257,500
Price Ratio 94
Days To Sell 120
Active Listings at Month End 17
%
%
10
4
40
$5,992,000
$1,498,000
104
11
17
%
%
-50
0
-16
-16
1038
0
%
%
%
%
%
%
13
5
38
$6,230,000
$1,246,000
94
100
%
%
27
7
26
$10,022,000
$1,431,714
103
61
%
%
-52
-29
-38
-13
64
%
%
%
%
%
Page 4 of 8
Victoria Real Estate Board Multiple Listing Service ®
Monthly Comparative Activity By Property Type
Includes All MLS® Property Types
March 2023
Current Month
This Year % Change
Last Year
Year To Date
This Year % Change
Last Year
Produced: 03-Apr-2023
Revenue - Apartment Block
Units Listed 0
Units Sold 0
Sell/List Ratio
Sales Dollars $0
Average Price / Unit
Price Ratio
Days To Sell
Active Listings at Month End 0
%
%
0
0
$0
0
%
%
%
%
%
%
%
%
0
0
$0
%
%
0
0
$0
%
%
%
%
%
%
%
Revenue - Commercial
Units Listed 17
Units Sold 2
Sell/List Ratio 12
Sales Dollars $1,247,680
Average Price / Unit $623,840
Price Ratio 97
Days To Sell 70
Active Listings at Month End 41
%
%
7
3
43
$7,715,000
$2,571,667
99
85
24
%
%
143
-33
-84
-76
-18
71
%
%
%
%
%
%
34
9
26
$5,229,180
$581,020
94
61
%
%
22
13
59
$20,687,212
$1,591,324
99
52
%
%
55
-31
-75
-63
18
%
%
%
%
%
Revenue - Industrial
Units Listed 6
Units Sold 1
Sell/List Ratio 17
Sales Dollars $1,850,000
Average Price / Unit $1,850,000
Price Ratio 97
Days To Sell 57
Active Listings at Month End 18
%
%
2
7
350
$4,418,600
$631,229
101
51
9
%
%
200
-86
-58
193
11
100
%
%
%
%
%
%
12
3
25
$3,175,000
$1,058,333
96
151
%
%
14
14
100
$11,133,600
$795,257
100
35
%
%
-14
-79
-71
33
329
%
%
%
%
%
Business with Land  Building
Units Listed 0
Units Sold 0
Sell/List Ratio
Sales Dollars $0
Average Price / Unit
Price Ratio
Days To Sell
Active Listings at Month End 4
%
%
0
0
$0
6
%
%
-33
%
%
%
%
%
%
2
0
0
$0
%
%
3
0
0
$0
%
%
-33 %
%
%
%
%
Page 5 of 8
Victoria Real Estate Board Multiple Listing Service ®
Monthly Comparative Activity By Property Type
Includes All MLS® Property Types
March 2023
Current Month
This Year % Change
Last Year
Year To Date
This Year % Change
Last Year
Produced: 03-Apr-2023
Business Only
Units Listed 9
Units Sold 4
Sell/List Ratio 44
Sales Dollars $560,000
Average Price / Unit $140,000
Price Ratio 73
Days To Sell 125
Active Listings at Month End 60
%
%
12
0
$0
54
%
%
-25
11
%
%
%
%
%
%
37
12
32
$1,758,000
$146,500
85
129
%
%
30
4
13
$805,000
$201,250
90
81
%
%
23
200
118
-27
58
%
%
%
%
%
Motel/Hotel
Units Listed 0
Units Sold 0
Sell/List Ratio
Sales Dollars $0
Average Price / Unit
Price Ratio
Days To Sell
Active Listings at Month End 0
%
%
0
0
$0
0
%
%
%
%
%
%
%
%
0
0
$0
%
%
0
0
$0
%
%
%
%
%
%
%
Lease - Office
Units Listed 11
Units Sold 5
Sell/List Ratio 45
Sales Dollars $3,988
Average Price / Unit $798
Price Ratio 98
Days To Sell 76
Active Listings at Month End 70
%
%
9
4
44
$56
$14
97
96
50
%
%
22
25
7002
5582
-21
40
%
%
%
%
%
%
38
13
34
$4,142
$319
99
102
%
%
26
8
31
$70,036
$8,755
50553
89
%
%
46
63
-94
-96
15
%
%
%
%
%
Lease - Retail
Units Listed 10
Units Sold 3
Sell/List Ratio 30
Sales Dollars $71
Average Price / Unit $24
Price Ratio 99
Days To Sell 164
Active Listings at Month End 47
%
%
11
2
18
$49
$25
96
150
41
%
%
-9
50
45
-3
9
15
%
%
%
%
%
%
20
4
20
$96
$24
99
140
%
%
21
6
29
$155
$26
97
90
%
%
-5
-33
-38
-7
56
%
%
%
%
%
Page 6 of 8
Victoria Real Estate Board Multiple Listing Service ®
Monthly Comparative Activity By Property Type
Includes All MLS® Property Types
March 2023
Current Month
This Year % Change
Last Year
Year To Date
This Year % Change
Last Year
Produced: 03-Apr-2023
Lease - Warehouse
Units Listed 0
Units Sold 0
Sell/List Ratio
Sales Dollars $0
Average Price / Unit
Price Ratio
Days To Sell
Active Listings at Month End 0
%
%
0
0
$0
0
%
%
%
%
%
%
%
%
0
0
$0
%
%
0
0
$0
%
%
%
%
%
%
%
Lease - Industrial
Units Listed 4
Units Sold 2
Sell/List Ratio 50
Sales Dollars $33
Average Price / Unit $16
Price Ratio 100
Days To Sell 87
Active Listings at Month End 19
%
%
0
0
$0
3
%
%
533
%
%
%
%
%
%
18
4
22
$81
$20
3
55
%
%
2
0
0
$0
%
%
800 %
%
%
%
%
Lease - Other
Units Listed 1
Units Sold 0
Sell/List Ratio
Sales Dollars $0
Average Price / Unit
Price Ratio
Days To Sell
Active Listings at Month End 5
%
%
0
1
$23
$23
100
157
3
%
%
-100
-100
67
%
%
%
%
%
%
3
0
0
$0
%
%
0
1
$23
$23
100
157
%
%
-100
-100
%
%
%
%
%
Commercial Land
Units Listed 1
Units Sold 0
Sell/List Ratio
Sales Dollars $0
Average Price / Unit
Price Ratio
Days To Sell
Active Listings at Month End 10
%
%
5
0
$0
21
%
%
-80
-52
%
%
%
%
%
%
2
0
0
$0
%
%
11
2
18
$18,025,000
$9,012,500
99
131
%
%
-82
-100
-100
%
%
%
%
%
Page 7 of 8
Victoria Real Estate Board Multiple Listing Service ®
Monthly Comparative Activity By Property Type
Includes All MLS® Property Types
March 2023
Current Month
This Year % Change
Last Year
Year To Date
This Year % Change
Last Year
Produced: 03-Apr-2023
Units Listed 1118
Units Sold 590
Sell/List Ratio 53
Sales Dollars $538,946,000
Average Price / Unit $913,468
Price Ratio 98
Days To Sell 41
Active Listings at Month End 1970
%
%
Grand Totals
1217
833
68
$883,697,627
$1,060,861
105
17
1063
%
%
-8
-29
-39
-14
147
85
%
%
%
%
%
%
2734
1328
49
$1,205,089,072
$907,447
97
44
%
%
2841
2025
71
$2,091,442,027
$1,032,811
105
19
%
%
-4
-34
-42
-12
127
%
%
%
%
%
Page 8 of 8
Victoria Real Estate Board Multiple Listing Service ®

More Related Content

Similar to VREB March 2023.pdf

VREB May 2022 Statistics Package.pdf
VREB May 2022 Statistics Package.pdfVREB May 2022 Statistics Package.pdf
VREB May 2022 Statistics Package.pdf
Vicky Aulakh
 
Vreb may 2020 stats
Vreb may 2020 statsVreb may 2020 stats
Vreb may 2020 stats
Vicky Aulakh
 
VREB August 2022 Statistics Package
VREB August 2022 Statistics Package VREB August 2022 Statistics Package
VREB August 2022 Statistics Package
VickyAulakh1
 
VREB April 2022 Stats Package .pdf
VREB April 2022 Stats Package .pdfVREB April 2022 Stats Package .pdf
VREB April 2022 Stats Package .pdf
Vicky Aulakh
 
VREB Sept 2020 Stats
VREB Sept 2020 StatsVREB Sept 2020 Stats
VREB Sept 2020 Stats
Vicky Aulakh
 
VREB September 2021 Statistics Package
VREB September 2021 Statistics Package VREB September 2021 Statistics Package
VREB September 2021 Statistics Package
VickyAulakh1
 
VREB July 2022
VREB July 2022VREB July 2022
VREB July 2022
Vicky Aulakh
 
Victoria Real Estate Board Statistics January 2020
Victoria Real Estate Board Statistics January 2020Victoria Real Estate Board Statistics January 2020
Victoria Real Estate Board Statistics January 2020
Vicky Aulakh
 
Victoria Real Estate Board Statistics January 2021
Victoria Real Estate Board Statistics January 2021Victoria Real Estate Board Statistics January 2021
Victoria Real Estate Board Statistics January 2021
Vicky Aulakh
 
VREB July 2020 Statistics
VREB July 2020 StatisticsVREB July 2020 Statistics
VREB July 2020 Statistics
Vicky Aulakh
 
VREB August 2020 Stats
VREB August 2020 Stats VREB August 2020 Stats
VREB August 2020 Stats
Vicky Aulakh
 
Vreb news releasefull
Vreb news releasefullVreb news releasefull
Vreb news releasefull
Vicky Aulakh
 
Vreb august 2019 stats package
Vreb august 2019 stats package Vreb august 2019 stats package
Vreb august 2019 stats package
Vicky Aulakh
 
Victoria Real Estate Board July 2021 Statistics
Victoria Real Estate Board July 2021 StatisticsVictoria Real Estate Board July 2021 Statistics
Victoria Real Estate Board July 2021 Statistics
Vicky Aulakh
 
Victoria Real Estate Board June 2021 Statistics
Victoria Real Estate Board June 2021 StatisticsVictoria Real Estate Board June 2021 Statistics
Victoria Real Estate Board June 2021 Statistics
Vicky Aulakh
 
Vreb oct 19 stats package
Vreb oct 19 stats packageVreb oct 19 stats package
Vreb oct 19 stats package
Vicky Aulakh
 
VREB October 2020 Statistics Package
VREB October 2020 Statistics PackageVREB October 2020 Statistics Package
VREB October 2020 Statistics Package
Vicky Aulakh
 
Vreb dec19 stats
Vreb dec19 statsVreb dec19 stats
Vreb dec19 stats
Vicky Aulakh
 
Victoria Real Estate Board Statistics Package January 2022
Victoria Real Estate Board Statistics Package January 2022Victoria Real Estate Board Statistics Package January 2022
Victoria Real Estate Board Statistics Package January 2022
VickyAulakh1
 
Victoria Real Estate Board Monthly Statistics Package September 2023.pdf
Victoria Real Estate Board Monthly Statistics Package September 2023.pdfVictoria Real Estate Board Monthly Statistics Package September 2023.pdf
Victoria Real Estate Board Monthly Statistics Package September 2023.pdf
VickyAulakh1
 

Similar to VREB March 2023.pdf (20)

VREB May 2022 Statistics Package.pdf
VREB May 2022 Statistics Package.pdfVREB May 2022 Statistics Package.pdf
VREB May 2022 Statistics Package.pdf
 
Vreb may 2020 stats
Vreb may 2020 statsVreb may 2020 stats
Vreb may 2020 stats
 
VREB August 2022 Statistics Package
VREB August 2022 Statistics Package VREB August 2022 Statistics Package
VREB August 2022 Statistics Package
 
VREB April 2022 Stats Package .pdf
VREB April 2022 Stats Package .pdfVREB April 2022 Stats Package .pdf
VREB April 2022 Stats Package .pdf
 
VREB Sept 2020 Stats
VREB Sept 2020 StatsVREB Sept 2020 Stats
VREB Sept 2020 Stats
 
VREB September 2021 Statistics Package
VREB September 2021 Statistics Package VREB September 2021 Statistics Package
VREB September 2021 Statistics Package
 
VREB July 2022
VREB July 2022VREB July 2022
VREB July 2022
 
Victoria Real Estate Board Statistics January 2020
Victoria Real Estate Board Statistics January 2020Victoria Real Estate Board Statistics January 2020
Victoria Real Estate Board Statistics January 2020
 
Victoria Real Estate Board Statistics January 2021
Victoria Real Estate Board Statistics January 2021Victoria Real Estate Board Statistics January 2021
Victoria Real Estate Board Statistics January 2021
 
VREB July 2020 Statistics
VREB July 2020 StatisticsVREB July 2020 Statistics
VREB July 2020 Statistics
 
VREB August 2020 Stats
VREB August 2020 Stats VREB August 2020 Stats
VREB August 2020 Stats
 
Vreb news releasefull
Vreb news releasefullVreb news releasefull
Vreb news releasefull
 
Vreb august 2019 stats package
Vreb august 2019 stats package Vreb august 2019 stats package
Vreb august 2019 stats package
 
Victoria Real Estate Board July 2021 Statistics
Victoria Real Estate Board July 2021 StatisticsVictoria Real Estate Board July 2021 Statistics
Victoria Real Estate Board July 2021 Statistics
 
Victoria Real Estate Board June 2021 Statistics
Victoria Real Estate Board June 2021 StatisticsVictoria Real Estate Board June 2021 Statistics
Victoria Real Estate Board June 2021 Statistics
 
Vreb oct 19 stats package
Vreb oct 19 stats packageVreb oct 19 stats package
Vreb oct 19 stats package
 
VREB October 2020 Statistics Package
VREB October 2020 Statistics PackageVREB October 2020 Statistics Package
VREB October 2020 Statistics Package
 
Vreb dec19 stats
Vreb dec19 statsVreb dec19 stats
Vreb dec19 stats
 
Victoria Real Estate Board Statistics Package January 2022
Victoria Real Estate Board Statistics Package January 2022Victoria Real Estate Board Statistics Package January 2022
Victoria Real Estate Board Statistics Package January 2022
 
Victoria Real Estate Board Monthly Statistics Package September 2023.pdf
Victoria Real Estate Board Monthly Statistics Package September 2023.pdfVictoria Real Estate Board Monthly Statistics Package September 2023.pdf
Victoria Real Estate Board Monthly Statistics Package September 2023.pdf
 

More from VickyAulakh1

HollandRow_17x11_Insert_Floorplan_Feature sheet.pdf
HollandRow_17x11_Insert_Floorplan_Feature sheet.pdfHollandRow_17x11_Insert_Floorplan_Feature sheet.pdf
HollandRow_17x11_Insert_Floorplan_Feature sheet.pdf
VickyAulakh1
 
Victory by Maskeen Group Surrey Floor plans June 2024 PDF
Victory by Maskeen Group Surrey Floor plans June 2024 PDFVictory by Maskeen Group Surrey Floor plans June 2024 PDF
Victory by Maskeen Group Surrey Floor plans June 2024 PDF
VickyAulakh1
 
One20 North Vancouver Floor Plans by Three Shores Development.
One20 North Vancouver Floor Plans by Three Shores Development.One20 North Vancouver Floor Plans by Three Shores Development.
One20 North Vancouver Floor Plans by Three Shores Development.
VickyAulakh1
 
Bridge & Elliot Ladner Floor Plans May 2024.pdf
Bridge & Elliot Ladner Floor Plans May 2024.pdfBridge & Elliot Ladner Floor Plans May 2024.pdf
Bridge & Elliot Ladner Floor Plans May 2024.pdf
VickyAulakh1
 
Parksville 96 Surrey Floor Plans May 2024
Parksville 96 Surrey Floor Plans May 2024Parksville 96 Surrey Floor Plans May 2024
Parksville 96 Surrey Floor Plans May 2024
VickyAulakh1
 
Greater Vancouver Realtors Statistics Package April 2024
Greater Vancouver Realtors Statistics Package April 2024Greater Vancouver Realtors Statistics Package April 2024
Greater Vancouver Realtors Statistics Package April 2024
VickyAulakh1
 
NIDO by Wanson Group Floor Plan Set 2024
NIDO by Wanson Group Floor Plan Set 2024NIDO by Wanson Group Floor Plan Set 2024
NIDO by Wanson Group Floor Plan Set 2024
VickyAulakh1
 
Portico by Wanson Group Floor Plans 2024
Portico by Wanson Group Floor Plans 2024Portico by Wanson Group Floor Plans 2024
Portico by Wanson Group Floor Plans 2024
VickyAulakh1
 
Portico By Wanson Group Floor Plans 2024
Portico By Wanson Group Floor Plans 2024Portico By Wanson Group Floor Plans 2024
Portico By Wanson Group Floor Plans 2024
VickyAulakh1
 
The Trails North Vancouver Floor Plans Feb 25, 2024
The Trails North Vancouver Floor Plans Feb 25, 2024The Trails North Vancouver Floor Plans Feb 25, 2024
The Trails North Vancouver Floor Plans Feb 25, 2024
VickyAulakh1
 
AMAYA LIVING Surrey FLOOR PLANS by Panorama West Group
AMAYA LIVING Surrey FLOOR PLANS by Panorama West GroupAMAYA LIVING Surrey FLOOR PLANS by Panorama West Group
AMAYA LIVING Surrey FLOOR PLANS by Panorama West Group
VickyAulakh1
 
Willow Walk Oakridge Townhome & Garden Flat Floor Plans
Willow Walk Oakridge Townhome & Garden Flat Floor PlansWillow Walk Oakridge Townhome & Garden Flat Floor Plans
Willow Walk Oakridge Townhome & Garden Flat Floor Plans
VickyAulakh1
 
JUNO Surrey By Streetside Developments Floor Plans
JUNO Surrey By Streetside Developments Floor PlansJUNO Surrey By Streetside Developments Floor Plans
JUNO Surrey By Streetside Developments Floor Plans
VickyAulakh1
 
SKA+Building+2+Floorplan+-+Web+-+Current.pdf
SKA+Building+2+Floorplan+-+Web+-+Current.pdfSKA+Building+2+Floorplan+-+Web+-+Current.pdf
SKA+Building+2+Floorplan+-+Web+-+Current.pdf
VickyAulakh1
 
Nolita-Floorplans.pdf
Nolita-Floorplans.pdfNolita-Floorplans.pdf
Nolita-Floorplans.pdf
VickyAulakh1
 
Adore 49 Floor Plans.pdf
Adore 49 Floor Plans.pdfAdore 49 Floor Plans.pdf
Adore 49 Floor Plans.pdf
VickyAulakh1
 
Citizen Burnaby Floor Plans
Citizen Burnaby Floor PlansCitizen Burnaby Floor Plans
Citizen Burnaby Floor Plans
VickyAulakh1
 
April 2023 Okanagan Statistics Graphs.pdf
April 2023 Okanagan Statistics Graphs.pdfApril 2023 Okanagan Statistics Graphs.pdf
April 2023 Okanagan Statistics Graphs.pdf
VickyAulakh1
 
FVREB April 2023 Statistics Package.pdf
FVREB April 2023 Statistics Package.pdfFVREB April 2023 Statistics Package.pdf
FVREB April 2023 Statistics Package.pdf
VickyAulakh1
 
Okanagan Statistics Reports March 2023
Okanagan Statistics Reports March 2023Okanagan Statistics Reports March 2023
Okanagan Statistics Reports March 2023
VickyAulakh1
 

More from VickyAulakh1 (20)

HollandRow_17x11_Insert_Floorplan_Feature sheet.pdf
HollandRow_17x11_Insert_Floorplan_Feature sheet.pdfHollandRow_17x11_Insert_Floorplan_Feature sheet.pdf
HollandRow_17x11_Insert_Floorplan_Feature sheet.pdf
 
Victory by Maskeen Group Surrey Floor plans June 2024 PDF
Victory by Maskeen Group Surrey Floor plans June 2024 PDFVictory by Maskeen Group Surrey Floor plans June 2024 PDF
Victory by Maskeen Group Surrey Floor plans June 2024 PDF
 
One20 North Vancouver Floor Plans by Three Shores Development.
One20 North Vancouver Floor Plans by Three Shores Development.One20 North Vancouver Floor Plans by Three Shores Development.
One20 North Vancouver Floor Plans by Three Shores Development.
 
Bridge & Elliot Ladner Floor Plans May 2024.pdf
Bridge & Elliot Ladner Floor Plans May 2024.pdfBridge & Elliot Ladner Floor Plans May 2024.pdf
Bridge & Elliot Ladner Floor Plans May 2024.pdf
 
Parksville 96 Surrey Floor Plans May 2024
Parksville 96 Surrey Floor Plans May 2024Parksville 96 Surrey Floor Plans May 2024
Parksville 96 Surrey Floor Plans May 2024
 
Greater Vancouver Realtors Statistics Package April 2024
Greater Vancouver Realtors Statistics Package April 2024Greater Vancouver Realtors Statistics Package April 2024
Greater Vancouver Realtors Statistics Package April 2024
 
NIDO by Wanson Group Floor Plan Set 2024
NIDO by Wanson Group Floor Plan Set 2024NIDO by Wanson Group Floor Plan Set 2024
NIDO by Wanson Group Floor Plan Set 2024
 
Portico by Wanson Group Floor Plans 2024
Portico by Wanson Group Floor Plans 2024Portico by Wanson Group Floor Plans 2024
Portico by Wanson Group Floor Plans 2024
 
Portico By Wanson Group Floor Plans 2024
Portico By Wanson Group Floor Plans 2024Portico By Wanson Group Floor Plans 2024
Portico By Wanson Group Floor Plans 2024
 
The Trails North Vancouver Floor Plans Feb 25, 2024
The Trails North Vancouver Floor Plans Feb 25, 2024The Trails North Vancouver Floor Plans Feb 25, 2024
The Trails North Vancouver Floor Plans Feb 25, 2024
 
AMAYA LIVING Surrey FLOOR PLANS by Panorama West Group
AMAYA LIVING Surrey FLOOR PLANS by Panorama West GroupAMAYA LIVING Surrey FLOOR PLANS by Panorama West Group
AMAYA LIVING Surrey FLOOR PLANS by Panorama West Group
 
Willow Walk Oakridge Townhome & Garden Flat Floor Plans
Willow Walk Oakridge Townhome & Garden Flat Floor PlansWillow Walk Oakridge Townhome & Garden Flat Floor Plans
Willow Walk Oakridge Townhome & Garden Flat Floor Plans
 
JUNO Surrey By Streetside Developments Floor Plans
JUNO Surrey By Streetside Developments Floor PlansJUNO Surrey By Streetside Developments Floor Plans
JUNO Surrey By Streetside Developments Floor Plans
 
SKA+Building+2+Floorplan+-+Web+-+Current.pdf
SKA+Building+2+Floorplan+-+Web+-+Current.pdfSKA+Building+2+Floorplan+-+Web+-+Current.pdf
SKA+Building+2+Floorplan+-+Web+-+Current.pdf
 
Nolita-Floorplans.pdf
Nolita-Floorplans.pdfNolita-Floorplans.pdf
Nolita-Floorplans.pdf
 
Adore 49 Floor Plans.pdf
Adore 49 Floor Plans.pdfAdore 49 Floor Plans.pdf
Adore 49 Floor Plans.pdf
 
Citizen Burnaby Floor Plans
Citizen Burnaby Floor PlansCitizen Burnaby Floor Plans
Citizen Burnaby Floor Plans
 
April 2023 Okanagan Statistics Graphs.pdf
April 2023 Okanagan Statistics Graphs.pdfApril 2023 Okanagan Statistics Graphs.pdf
April 2023 Okanagan Statistics Graphs.pdf
 
FVREB April 2023 Statistics Package.pdf
FVREB April 2023 Statistics Package.pdfFVREB April 2023 Statistics Package.pdf
FVREB April 2023 Statistics Package.pdf
 
Okanagan Statistics Reports March 2023
Okanagan Statistics Reports March 2023Okanagan Statistics Reports March 2023
Okanagan Statistics Reports March 2023
 

Recently uploaded

GT234 CADASTRAL SURVEYING gggggggggg.ppt
GT234 CADASTRAL SURVEYING gggggggggg.pptGT234 CADASTRAL SURVEYING gggggggggg.ppt
GT234 CADASTRAL SURVEYING gggggggggg.ppt
leonardmichael1
 
Investing In The US As A Canadian… And How To Do It RIGHT!! (feat. Erwin Szet...
Investing In The US As A Canadian… And How To Do It RIGHT!! (feat. Erwin Szet...Investing In The US As A Canadian… And How To Do It RIGHT!! (feat. Erwin Szet...
Investing In The US As A Canadian… And How To Do It RIGHT!! (feat. Erwin Szet...
Volition Properties
 
Biography and career about Lixin Azarmehr
Biography and career about Lixin AzarmehrBiography and career about Lixin Azarmehr
Biography and career about Lixin Azarmehr
Lixin Azarmehr
 
Brigade Insignia at Yelahanka Brochure.pdf
Brigade Insignia at Yelahanka Brochure.pdfBrigade Insignia at Yelahanka Brochure.pdf
Brigade Insignia at Yelahanka Brochure.pdf
SachinChauhan191
 
Riverview City Loni Kalbhor Pune Brochure
Riverview City Loni Kalbhor Pune BrochureRiverview City Loni Kalbhor Pune Brochure
Riverview City Loni Kalbhor Pune Brochure
kishor21012022
 
Presentation to Windust Meadows HOA Board of Directors June 4, 2024: Focus o...
Presentation to Windust Meadows HOA Board of Directors June 4, 2024:  Focus o...Presentation to Windust Meadows HOA Board of Directors June 4, 2024:  Focus o...
Presentation to Windust Meadows HOA Board of Directors June 4, 2024: Focus o...
Joseph Lewis Aguirre
 
Killer Referans Bahcesehir Catalog Listing Turkey
Killer Referans Bahcesehir Catalog Listing TurkeyKiller Referans Bahcesehir Catalog Listing Turkey
Killer Referans Bahcesehir Catalog Listing Turkey
Listing Turkey
 
Digital marketing strategy for Real Estate
Digital marketing strategy for Real EstateDigital marketing strategy for Real Estate
Digital marketing strategy for Real Estate
dheerajkumar8179
 
Rams Garden Bahcelievler - Istanbul - ListingTurkey
Rams Garden Bahcelievler - Istanbul - ListingTurkeyRams Garden Bahcelievler - Istanbul - ListingTurkey
Rams Garden Bahcelievler - Istanbul - ListingTurkey
Listing Turkey
 
The KA Housing - Catalogue - Listing Turkey
The KA Housing - Catalogue - Listing TurkeyThe KA Housing - Catalogue - Listing Turkey
The KA Housing - Catalogue - Listing Turkey
Listing Turkey
 
Elegant Evergreen Homes - Luxury Apartments Redefining Comfort in Yelahanka, ...
Elegant Evergreen Homes - Luxury Apartments Redefining Comfort in Yelahanka, ...Elegant Evergreen Homes - Luxury Apartments Redefining Comfort in Yelahanka, ...
Elegant Evergreen Homes - Luxury Apartments Redefining Comfort in Yelahanka, ...
JagadishKR1
 
Rixos Tersane Istanbul Residences Brochure_May2024_ENG.pdf
Rixos Tersane Istanbul Residences Brochure_May2024_ENG.pdfRixos Tersane Istanbul Residences Brochure_May2024_ENG.pdf
Rixos Tersane Istanbul Residences Brochure_May2024_ENG.pdf
Listing Turkey
 
Deutsche EuroShop | Company Presentation | 06/24
Deutsche EuroShop | Company Presentation | 06/24Deutsche EuroShop | Company Presentation | 06/24
Deutsche EuroShop | Company Presentation | 06/24
Deutsche EuroShop AG
 
Simpolo Company Profile & Corporate Logo
Simpolo Company Profile & Corporate LogoSimpolo Company Profile & Corporate Logo
Simpolo Company Profile & Corporate Logo
simpolosparkteam
 
How to keep your Home naturally Cool and Warm
How to keep your Home naturally Cool and WarmHow to keep your Home naturally Cool and Warm
How to keep your Home naturally Cool and Warm
Vinra Construction
 
Dynamics 365 Bid Management for Construction Projects
Dynamics 365 Bid Management for Construction ProjectsDynamics 365 Bid Management for Construction Projects
Dynamics 365 Bid Management for Construction Projects
Dynamic Netsoft
 
Architectural & Interior design portfolio.pdf
Architectural & Interior design portfolio.pdfArchitectural & Interior design portfolio.pdf
Architectural & Interior design portfolio.pdf
susantebinum
 
Listing Turkey - Yeni Eyupevleri Istanbul
Listing Turkey - Yeni Eyupevleri IstanbulListing Turkey - Yeni Eyupevleri Istanbul
Listing Turkey - Yeni Eyupevleri Istanbul
Listing Turkey
 
Sense Levent Kagithane Catalog - Listing Turkey
Sense Levent Kagithane Catalog - Listing TurkeySense Levent Kagithane Catalog - Listing Turkey
Sense Levent Kagithane Catalog - Listing Turkey
Listing Turkey
 
Torun Center Residences Istanbul - Listing Turkey
Torun Center Residences Istanbul - Listing TurkeyTorun Center Residences Istanbul - Listing Turkey
Torun Center Residences Istanbul - Listing Turkey
Listing Turkey
 

Recently uploaded (20)

GT234 CADASTRAL SURVEYING gggggggggg.ppt
GT234 CADASTRAL SURVEYING gggggggggg.pptGT234 CADASTRAL SURVEYING gggggggggg.ppt
GT234 CADASTRAL SURVEYING gggggggggg.ppt
 
Investing In The US As A Canadian… And How To Do It RIGHT!! (feat. Erwin Szet...
Investing In The US As A Canadian… And How To Do It RIGHT!! (feat. Erwin Szet...Investing In The US As A Canadian… And How To Do It RIGHT!! (feat. Erwin Szet...
Investing In The US As A Canadian… And How To Do It RIGHT!! (feat. Erwin Szet...
 
Biography and career about Lixin Azarmehr
Biography and career about Lixin AzarmehrBiography and career about Lixin Azarmehr
Biography and career about Lixin Azarmehr
 
Brigade Insignia at Yelahanka Brochure.pdf
Brigade Insignia at Yelahanka Brochure.pdfBrigade Insignia at Yelahanka Brochure.pdf
Brigade Insignia at Yelahanka Brochure.pdf
 
Riverview City Loni Kalbhor Pune Brochure
Riverview City Loni Kalbhor Pune BrochureRiverview City Loni Kalbhor Pune Brochure
Riverview City Loni Kalbhor Pune Brochure
 
Presentation to Windust Meadows HOA Board of Directors June 4, 2024: Focus o...
Presentation to Windust Meadows HOA Board of Directors June 4, 2024:  Focus o...Presentation to Windust Meadows HOA Board of Directors June 4, 2024:  Focus o...
Presentation to Windust Meadows HOA Board of Directors June 4, 2024: Focus o...
 
Killer Referans Bahcesehir Catalog Listing Turkey
Killer Referans Bahcesehir Catalog Listing TurkeyKiller Referans Bahcesehir Catalog Listing Turkey
Killer Referans Bahcesehir Catalog Listing Turkey
 
Digital marketing strategy for Real Estate
Digital marketing strategy for Real EstateDigital marketing strategy for Real Estate
Digital marketing strategy for Real Estate
 
Rams Garden Bahcelievler - Istanbul - ListingTurkey
Rams Garden Bahcelievler - Istanbul - ListingTurkeyRams Garden Bahcelievler - Istanbul - ListingTurkey
Rams Garden Bahcelievler - Istanbul - ListingTurkey
 
The KA Housing - Catalogue - Listing Turkey
The KA Housing - Catalogue - Listing TurkeyThe KA Housing - Catalogue - Listing Turkey
The KA Housing - Catalogue - Listing Turkey
 
Elegant Evergreen Homes - Luxury Apartments Redefining Comfort in Yelahanka, ...
Elegant Evergreen Homes - Luxury Apartments Redefining Comfort in Yelahanka, ...Elegant Evergreen Homes - Luxury Apartments Redefining Comfort in Yelahanka, ...
Elegant Evergreen Homes - Luxury Apartments Redefining Comfort in Yelahanka, ...
 
Rixos Tersane Istanbul Residences Brochure_May2024_ENG.pdf
Rixos Tersane Istanbul Residences Brochure_May2024_ENG.pdfRixos Tersane Istanbul Residences Brochure_May2024_ENG.pdf
Rixos Tersane Istanbul Residences Brochure_May2024_ENG.pdf
 
Deutsche EuroShop | Company Presentation | 06/24
Deutsche EuroShop | Company Presentation | 06/24Deutsche EuroShop | Company Presentation | 06/24
Deutsche EuroShop | Company Presentation | 06/24
 
Simpolo Company Profile & Corporate Logo
Simpolo Company Profile & Corporate LogoSimpolo Company Profile & Corporate Logo
Simpolo Company Profile & Corporate Logo
 
How to keep your Home naturally Cool and Warm
How to keep your Home naturally Cool and WarmHow to keep your Home naturally Cool and Warm
How to keep your Home naturally Cool and Warm
 
Dynamics 365 Bid Management for Construction Projects
Dynamics 365 Bid Management for Construction ProjectsDynamics 365 Bid Management for Construction Projects
Dynamics 365 Bid Management for Construction Projects
 
Architectural & Interior design portfolio.pdf
Architectural & Interior design portfolio.pdfArchitectural & Interior design portfolio.pdf
Architectural & Interior design portfolio.pdf
 
Listing Turkey - Yeni Eyupevleri Istanbul
Listing Turkey - Yeni Eyupevleri IstanbulListing Turkey - Yeni Eyupevleri Istanbul
Listing Turkey - Yeni Eyupevleri Istanbul
 
Sense Levent Kagithane Catalog - Listing Turkey
Sense Levent Kagithane Catalog - Listing TurkeySense Levent Kagithane Catalog - Listing Turkey
Sense Levent Kagithane Catalog - Listing Turkey
 
Torun Center Residences Istanbul - Listing Turkey
Torun Center Residences Istanbul - Listing TurkeyTorun Center Residences Istanbul - Listing Turkey
Torun Center Residences Istanbul - Listing Turkey
 

VREB March 2023.pdf

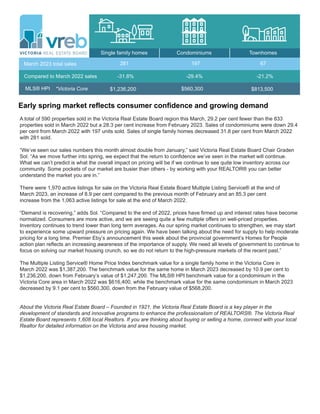
  • 1. Early spring market reflects consumer confidence and growing demand A total of 590 properties sold in the Victoria Real Estate Board region this March, 29.2 per cent fewer than the 833 properties sold in March 2022 but a 28.3 per cent increase from February 2023. Sales of condominiums were down 29.4 per cent from March 2022 with 197 units sold. Sales of single family homes decreased 31.8 per cent from March 2022 with 281 sold. “We’ve seen our sales numbers this month almost double from January,” said Victoria Real Estate Board Chair Graden Sol. “As we move further into spring, we expect that the return to confidence we’ve seen in the market will continue. What we can’t predict is what the overall impact on pricing will be if we continue to see quite low inventory across our community. Some pockets of our market are busier than others - by working with your REALTOR® you can better understand the market you are in.” There were 1,970 active listings for sale on the Victoria Real Estate Board Multiple Listing Service® at the end of March 2023, an increase of 8.9 per cent compared to the previous month of February and an 85.3 per cent increase from the 1,063 active listings for sale at the end of March 2022. “Demand is recovering,” adds Sol. “Compared to the end of 2022, prices have firmed up and interest rates have become normalized. Consumers are more active, and we are seeing quite a few multiple offers on well-priced properties. Inventory continues to trend lower than long term averages. As our spring market continues to strengthen, we may start to experience some upward pressure on pricing again. We have been talking about the need for supply to help moderate pricing for a long time. Premier Eby’s announcement this week about the provincial government’s Homes for People action plan reflects an increasing awareness of the importance of supply. We need all levels of government to continue to focus on solving our market housing crunch, so we do not return to the high-pressure markets of the recent past.” The Multiple Listing Service® Home Price Index benchmark value for a single family home in the Victoria Core in March 2022 was $1,387,200. The benchmark value for the same home in March 2023 decreased by 10.9 per cent to $1,236,200, down from February’s value of $1,247,200. The MLS® HPI benchmark value for a condominium in the Victoria Core area in March 2022 was $616,400, while the benchmark value for the same condominium in March 2023 decreased by 9.1 per cent to $560,300, down from the February value of $568,200. About the Victoria Real Estate Board – Founded in 1921, the Victoria Real Estate Board is a key player in the development of standards and innovative programs to enhance the professionalism of REALTORS®. The Victoria Real Estate Board represents 1,608 local Realtors. If you are thinking about buying or selling a home, connect with your local Realtor for detailed information on the Victoria and area housing market. Single family homes Condominiums Townhomes March 2023 total sales Compared to March 2022 sales MLS® HPI 281 $1,236,200 197 -31.8% -29.4% 67 -21.2% $560,300 $813,500 *Victoria Core
  • 2. Sales by Property Type Single Family Greater Victoria Single Family Other Areas Single Family Total All Areas Condo Apartment Row/Townhouse Manufactured Home Total Residential Total Sales Active Listings Units Median$ Average$ LY% LM% LY% LM% LY% LM% Units Median$ Average$ Units Median$ Average$ March 2023 266 197 67 15 560 281 590 15 1,970 213 161 45 10 436 220 460 7 1,809 395 279 85 18 794 412 833 17 1,063 $1,241,248 $628,230 $774,710 $338,667 $1,225,446 $945,226 $1,100,000 $569,500 $750,000 $317,500 $1,080,000 $950,000 $1,285,306 $579,025 $788,113 $355,450 $1,272,933 $896,442 $1,100,000 $547,000 $744,000 $389,500 $1,100,000 $750,000 $1,433,135 $672,283 $864,158 $331,872 $1,426,628 $1,275,450 $1,312,395 $611,000 $840,500 $287,500 $1,310,000 $1,183,000 24.9% 22.4% 48.9% 50.0% 28.4% 27.7% 28.3% 114.3% 8.9% -32.7% -29.4% -21.2% -16.7% -29.5% -31.8% -29.2% -11.8% 85.3% -3.4% 8.5% -1.7% -4.7% -3.7% 5.4% -13.4% -6.6% -10.4% 2.0% -14.1% -25.9% 0.0% 4.1% 0.8% -18.5% -1.8% 26.7% -16.2% -6.8% -10.8% 10.4% -17.6% -19.7% February 2023 March 2022 Legend Units: net number of listings sold LM%: percentage change since Last Month LY%: percentage change since This Month Last Year Average$: average selling price Median$: median selling price Total Residential: includes sales of residential property types Total Sales: includes sales of all property types Active Listings: total listings of all types on the market at midnight on the last day of the month This Month Last Month Produced: 03-Apr-2023 March 2023 Previous Periods Comparison This Month Last Year Page 1 of 1 Victoria Real Estate Board Multiple Listing Service ® March 2023 Statistics Package for Media Victoria Real Estate Board March 2023 Statistics - page 2 Previous Periods Comparison of Unit Sales, Average Prices and Median Prices Previous Periods Comparison of MLS® HPI Benchmark Prices and MLS® HPI Index Values
  • 3. 6DOHVWR$FWLYH/LVWLQJV5DWLR The ratio of counts of total residential sales over total active residential listings for the last 25 months 0DUFK Produced: 03-Apr-2023 0DU $SU 0D -XQ -XO $XJ 6HS 2FW 1RY 'HF -DQ )HE 0DU $SU 0D -XQ -XO $XJ 6HS 2FW 1RY 'HF -DQ )HE 0DU 7KH6DOHVWR$FWLYH/LVWLQJV5DWLR 7KLV FKDUWWUDFNVWKHUDWLRRIWRWDOUHVLGHQWLDOVDOHVRYHUWRWDODFWLYHUHVLGHQWLDOOLVWLQJVDWPRQWKHQGIRU HDFKRIWKHODVWPRQWKV 7KHDFWLYHOLVWLQJFRXQWDQGWKHVDOHVFRXQWFDQEHYLHZHGDVLQGLFDWRUVRIKRXVLQJVXSSODQG GHPDQGUHVSHFWLYHO2EVHUYLQJWKHUDWLREHWZHHQWKHPFDQWKXVKHOSLQGLFDWHDEXHUV PDUNHW ZKHUHWKHUHLVVXVWDLQHGGRZQZDUGSUHVVXUHRQSULFHVDQGDVHOOHUV PDUNHWZKHUHWKHUHLV VXVWDLQHGXSZDUGSUHVVXUHRQSULFHV %DVHGRQDUHJUHVVLRQDQDOVLVSHUIRUPHGEWKH(FRQRPLFV'HSDUWPHQWRIWKH%5HDO(VWDWH $VVRFLDWLRQLQHDFKPDUNHWDUHDRIWKHSURYLQFHWKH6DOHVWR$FWLYH/LVWLQJV5DWLRIRU9LFWRULDFDQEH LQWHUSUHWHGDVIROORZV EHORZWKHUHLVGRZQZDUGSUHVVXUHRQSULFHV EXHUV PDUNHW DERYHWKHUHLVXSZDUGSUHVVXUHRQSULFHV VHOOHUV PDUNHW Sales to Active Listings Ratio This chart tracks the ratio of total residential sales over total active residential listings at month-end for each of the last 25 months. Based on a regression analysis performed by the economics department at the BC Real Estate Association in each market area of the province, the Sales to Active Listings Ratio for Victoria can be interpreted as follows: - below 14%, there is downward pressure on prices (buyers' market) - above 20%, there is upward pressure on prices (sellers' market) - in the 14-20% range, there is little pressure on prices either way (balanced market) Victoria Real Estate Board March 2023 Statistics - page 3 Total new MLS® listings and total MLS® sales for entire district
  • 4. The Victoria Real Estate Board uses the MLS® Home Price Index (MLS® HPI) to report on market trends. The MLS® HPI uses the concept of a benchmark home, a notional home with common attributes of typical homes in a defined area. Through the analysis of over fifteen years of Victoria Real Estate Board MLS® sales data, the MLS® HPI defined benchmark homes for Victoria in each category (single family homes, townhouses, condos) and for each neighbourhood. The benchmark starting point was 2005, where each type of property and neighbourhood was assigned an index value of 100. *The HPI reporting herein is based on the SOLD date. Victoria Real Estate Board March 2023 Statistics - page 4 MLS® HPI benchmark and value - Single Family Homes
  • 5. MLS® HPI benchmark and value - Condominium / Apartments Victoria Real Estate Board March 2023 Statistics - page 5
  • 6. Note: Areas with insufficient sales are not included in the HPI. Source: Victoria Real Estate Board March 2023 1 Month Ago 3 Months Ago 6 Months Ago 12 Months Ago 3 Years Ago 5 Years Ago January 2005 Victoria REB – SF-All $808,300 $790,000 $370,800 $1,234,800 $1,218,500 $1,135,600 $1,113,200 $1,108,100 Benchmark Price by Timeframe and Property Type Value or percent change Value Percent change HPI or Benchmark Price HPI Benchmark Price 1. Area Group VREB District Summary 3. Area/Property Type Selection – Victoria REB – SF-All 2. Property Type – Single Family-All (SF-All)
  • 7. Note: Areas with insufficient sales are not included in the HPI. Source: Victoria Real Estate Board March 2023 1 Month Ago 3 Months Ago 6 Months Ago 12 Months Ago 3 Years Ago 5 Years Ago January 2005 Victoria REB – SF-All 333.0 328.6 306.3 300.2 298.8 218.0 213.1 100.0 HPI by Timeframe and Property Type Value or percent change Value Percent change HPI or Benchmark Price HPI Benchmark Price 1. Area Group VREB District Summary 3. Area/Property Type Selection – Victoria REB – SF-All 2. Property Type – Single Family-All (SF-All)
  • 8. Note: Areas with insufficient sales are not included in the HPI. Source: Victoria Real Estate Board March 2023 1 Month Ago 3 Months Ago 6 Months Ago 12 Months Ago 3 Years Ago 5 Years Ago January 2005 Victoria REB – Con $609,900 $607,400 $563,600 $563,300 $558,100 $445,800 $410,700 $169,900 Benchmark Price by Timeframe and Property Type Value or percent change Value Percent change HPI or Benchmark Price HPI Benchmark Price 1. Area Group VREB District Summary 3. Area/Property Type Selection – Victoria REB – Con 2. Property Type – Condo Apartment (Con)
  • 9. Note: Areas with insufficient sales are not included in the HPI. Source: Victoria Real Estate Board March 2023 1 Month Ago 3 Months Ago 6 Months Ago 12 Months Ago 3 Years Ago 5 Years Ago January 2005 Victoria REB – Con 359.0 357.5 331.7 331.5 328.5 262.4 241.7 100.0 HPI by Timeframe and Property Type Value or percent change Value Percent change HPI or Benchmark Price HPI Benchmark Price 1. Area Group VREB District Summary 3. Area/Property Type Selection – Victoria REB – Con 2. Property Type – Condo Apartment (Con)
  • 10. Note: Areas with insufficient sales are not included in the HPI. Source: Victoria Real Estate Board March 2023 1 Month Ago 3 Months Ago 6 Months Ago 12 Months Ago 3 Years Ago 5 Years Ago January 2005 Victoria REB – Twn $818,800 $790,700 $784,400 $763,500 $748,300 $561,900 $530,800 $258,200 Benchmark Price by Timeframe and Property Type Value or percent change Value Percent change HPI or Benchmark Price HPI Benchmark Price 1. Area Group VREB District Summary 3. Area/Property Type Selection – Victoria REB – Twn 2. Property Type – Townhouse (Twn)
  • 11. Note: Areas with insufficient sales are not included in the HPI. Source: Victoria Real Estate Board March 2023 1 Month Ago 3 Months Ago 6 Months Ago 12 Months Ago 3 Years Ago 5 Years Ago January 2005 Victoria REB – Twn 317.1 306.2 303.8 295.7 289.8 217.6 205.6 100.0 HPI by Timeframe and Property Type Value or percent change Value Percent change HPI or Benchmark Price HPI Benchmark Price 1. Area Group VREB District Summary 3. Area/Property Type Selection – Victoria REB – Twn 2. Property Type – Townhouse (Twn)
  • 12. Note: Areas with insufficient sales are not included in the HPI. Source: Victoria Real Estate Board Victoria REB – SF-All Core – SF-All Westshore – SF-All Peninsula – SF-All Select Date Range: All values Jan 2003 Jan 2005 Jan 2007 Jan 2009 Jan 2011 Jan 2013 Jan 2015 Jan 2017 Jan 2019 Jan 2021 Jan 2023 Benchmark Price ($) 200,000 400,000 600,000 800,000 1,000,000 1,200,000 1,400,000 Benchmark Price Performance over Time 1. Area Group VREB Area Summary 3. Area/Property Type Selection Multiple values 2. Property Type – Single Family-All (SF-All) HPI or Benchmark Price HPI Benchmark Price Adding labels Hold Ctrl (Cmd) and select points on the chart to show multiple date/value labels
  • 13. Note: Areas with insufficient sales are not included in the HPI. Source: Victoria Real Estate Board Victoria REB – Con Core – Con Westshore – Con Peninsula – Con Select Date Range: All values Jan 2003 Jan 2005 Jan 2007 Jan 2009 Jan 2011 Jan 2013 Jan 2015 Jan 2017 Jan 2019 Jan 2021 Jan 2023 Benchmark Price ($) 100,000 200,000 300,000 400,000 500,000 600,000 Benchmark Price Performance over Time 1. Area Group VREB Area Summary 3. Area/Property Type Selection All 2. Property Type – Condo Apartment (Con) HPI or Benchmark Price HPI Benchmark Price Adding labels Hold Ctrl (Cmd) and select points on the chart to show multiple date/value labels
  • 14. Note: Areas with insufficient sales are not included in the HPI. Source: Victoria Real Estate Board Victoria REB – Twn Core – Twn Westshore – Twn Peninsula – Twn Select Date Range: All values Jan 2003 Jan 2005 Jan 2007 Jan 2009 Jan 2011 Jan 2013 Jan 2015 Jan 2017 Jan 2019 Jan 2021 Jan 2023 Benchmark Price ($) 200,000 300,000 400,000 500,000 600,000 700,000 800,000 900,000 Benchmark Price Performance over Time 1. Area Group VREB Area Summary 3. Area/Property Type Selection Multiple values 2. Property Type – Townhouse (Twn) HPI or Benchmark Price HPI Benchmark Price Adding labels Hold Ctrl (Cmd) and select points on the chart to show multiple date/value labels
  • 15. Note: Areas with insufficient sales are not included in the HPI. Source: Victoria Real Estate Board Victoria REB – SF-All Victoria REB – Twn Victoria REB – Con Select Date Range: All values Jan 2003 Jan 2005 Jan 2007 Jan 2009 Jan 2011 Jan 2013 Jan 2015 Jan 2017 Jan 2019 Jan 2021 Jan 2023 Benchmark Price ($) 200,000 400,000 600,000 800,000 1,000,000 1,200,000 Benchmark Price Performance over Time 1. Area Group VREB Area Summary 3. Area/Property Type Selection Multiple values 2. Property Type Multiple values HPI or Benchmark Price HPI Benchmark Price Adding labels Hold Ctrl (Cmd) and select points on the chart to show multiple date/value labels
  • 16. Monthly Sales Summary (Mark I) Residential Waterfront Properties Integrated Into Their Own Districts Units Total Volume March 2023 District Produced: 03-Apr-2023 Residential Single Family Detached l Greater Victoria Victoria / Victoria West 34 $39,881,500 Oak Bay 20 $33,196,900 Esquimalt 11 $11,360,000 View Royal 9 $9,984,300 Saanich East 46 $66,324,400 Saanich West 19 $25,085,898 Central Saanich 14 $20,182,000 North Saanich 11 $18,120,000 Sidney 8 $7,594,000 Highlands 1 $1,200,000 Colwood 23 $24,174,980 Langford 33 $39,553,312 Metchosin 2 $3,000,000 Sooke 25 $22,189,760 Gulf Islands 10 $8,325,000 Total Greater Victoria 266 $330,172,050 Other Areas Malahat Area 15 $14,178,387 Total Other Areas 15 $14,178,387 Total Single Family Detached 281 $344,350,437 Condo Apartment l Greater Victoria Victoria / Victoria West 99 $61,528,987 Oak Bay 7 $6,249,000 Esquimalt 15 $8,971,700 View Royal 1 $650,000 Saanich East 24 $16,016,800 Saanich West 10 $5,159,799 Central Saanich 3 $1,534,900 North Saanich 1 $747,800 Sidney 14 $9,541,900 Colwood 7 $4,559,900 Langford 14 $7,895,465 Sooke 1 $300,000 Total Greater Victoria 196 $123,156,251 Other Areas Malahat Area 1 $605,000 Total Other Areas 1 $605,000 Total Condo Apartment 197 $123,761,251 Page 1 of 3 Victoria Real Estate Board Multiple Listing Service ®
  • 17. Monthly Sales Summary (Mark I) Residential Waterfront Properties Integrated Into Their Own Districts Units Total Volume March 2023 District Produced: 03-Apr-2023 Row/Townhouse l Greater Victoria Victoria / Victoria West 3 $2,674,900 Esquimalt 3 $2,025,000 View Royal 3 $1,734,999 Saanich East 11 $10,012,957 Saanich West 7 $5,282,500 Central Saanich 3 $2,640,000 North Saanich 2 $2,135,000 Sidney 3 $2,459,900 Colwood 9 $6,795,365 Langford 19 $13,737,919 Sooke 4 $2,407,000 Total Greater Victoria 67 $51,905,540 Total Row/Townhouse 67 $51,905,540 Manufactured Home l Greater Victoria View Royal 2 $565,000 Central Saanich 5 $1,721,500 Sidney 2 $1,076,500 Langford 2 $605,000 Sooke 2 $532,000 Gulf Islands 1 $255,000 Total Greater Victoria 14 $4,755,000 Other Areas Malahat Area 1 $325,000 Total Other Areas 1 $325,000 Total Manufactured Home 15 $5,080,000 Total Residential 560 $525,097,228 Page 2 of 3 Victoria Real Estate Board Multiple Listing Service ®
  • 18. Monthly Sales Summary (Mark I) Residential Waterfront Properties Integrated Into Their Own Districts Units Total Volume March 2023 District Produced: 03-Apr-2023 $538,946,000 590 Grand Totals Other Property Lots Acreage l Greater Victoria Victoria / Victoria West 1 $1,388,000 Saanich East 1 $730,000 Colwood 1 $550,000 Langford 1 $649,000 Sooke 1 $330,000 Gulf Islands 4 $1,510,000 Total Greater Victoria 9 $5,157,000 Total Lots Acreage 9 $5,157,000 21 $8,691,772 Other Commercial Properties l Page 3 of 3 Victoria Real Estate Board Multiple Listing Service ®
  • 19. Monthly Sales Summary (Mark II) Waterfront Properties Segregated Into a 'Waterfront' District Units Total Volume March 2023 District Produced: 03-Apr-2023 Residential Single Family Detached l Greater Victoria Victoria 32 $37,241,500 Victoria West 2 $2,640,000 Oak Bay 20 $33,196,900 Esquimalt 11 $11,360,000 View Royal 8 $8,704,300 Saanich East 44 $57,679,400 Saanich West 18 $21,515,898 Central Saanich 14 $20,182,000 North Saanich 9 $14,555,000 Sidney 8 $7,594,000 Highlands 1 $1,200,000 Colwood 23 $24,174,980 Langford 33 $39,553,312 Metchosin 2 $3,000,000 Sooke 24 $20,814,760 Gulf Islands 9 $6,425,000 Waterfront (all districts) 8 $20,335,000 Total Greater Victoria 266 $330,172,050 Other Areas Malahat Area 15 $14,178,387 Total Other Areas 15 $14,178,387 Total Single Family Detached 281 $344,350,437 Condo Apartment l Greater Victoria Victoria 80 $46,486,987 Victoria West 11 $7,568,000 Oak Bay 6 $5,689,000 Esquimalt 12 $6,466,800 View Royal 1 $650,000 Saanich East 24 $16,016,800 Saanich West 9 $4,809,800 Central Saanich 3 $1,534,900 North Saanich 1 $747,800 Sidney 13 $8,911,900 Colwood 6 $4,039,900 Langford 14 $7,895,465 Waterfront (all districts) 16 $12,338,899 Total Greater Victoria 196 $123,156,251 Other Areas Waterfront (all districts) 1 $605,000 Total Other Areas 1 $605,000 Total Condo Apartment 197 $123,761,251 Page 1 of 3 Victoria Real Estate Board Multiple Listing Service ®
  • 20. Monthly Sales Summary (Mark II) Waterfront Properties Segregated Into a 'Waterfront' District Units Total Volume March 2023 District Produced: 03-Apr-2023 Row/Townhouse l Greater Victoria Victoria 3 $2,674,900 Esquimalt 3 $2,025,000 View Royal 3 $1,734,999 Saanich East 11 $10,012,957 Saanich West 7 $5,282,500 Central Saanich 2 $1,590,000 North Saanich 2 $2,135,000 Sidney 3 $2,459,900 Colwood 9 $6,795,365 Langford 19 $13,737,919 Sooke 3 $1,842,000 Waterfront (all districts) 2 $1,615,000 Total Greater Victoria 67 $51,905,540 Total Row/Townhouse 67 $51,905,540 Manufactured Home l Greater Victoria View Royal 2 $565,000 Central Saanich 5 $1,721,500 Sidney 2 $1,076,500 Langford 2 $605,000 Sooke 2 $532,000 Gulf Islands 1 $255,000 Total Greater Victoria 14 $4,755,000 Other Areas Malahat Area 1 $325,000 Total Other Areas 1 $325,000 Total Manufactured Home 15 $5,080,000 Total Residential 560 $525,097,228 Page 2 of 3 Victoria Real Estate Board Multiple Listing Service ®
  • 21. Monthly Sales Summary (Mark II) Waterfront Properties Segregated Into a 'Waterfront' District Units Total Volume March 2023 District Produced: 03-Apr-2023 $538,946,000 590 Grand Totals Other Property Lots Acreage l Greater Victoria Victoria / Victoria West 1 $1,388,000 Saanich East 1 $730,000 Colwood 1 $550,000 Langford 1 $649,000 Sooke 1 $330,000 Gulf Islands 4 $1,510,000 Total Greater Victoria 9 $5,157,000 Total Lots Acreage 9 $5,157,000 21 $8,691,772 Other Commercial Properties l Page 3 of 3 Victoria Real Estate Board Multiple Listing Service ®
  • 22. Sales to Active Listings Ratio The ratio of counts of total residential sales over total active residential listings for the last 25 months March 2023 Produced: 03-Apr-2023 10% 20% 30% 40% 50% 60% 70% 80% 90% 100% 110% 120% Mar 2021 Apr 2021 May 2021 Jun 2021 Jul 2021 Aug 2021 Sep 2021 Oct 2021 Nov 2021 Dec 2021 Jan 2022 Feb 2022 Mar 2022 Apr 2022 May 2022 Jun 2022 Jul 2022 Aug 2022 Sep 2022 Oct 2022 Nov 2022 Dec 2022 Jan 2023 Feb 2023 Mar 2023 The Sales to Active Listings Ratio This chart tracks the ratio of total residential sales over total active residential listings at month-end for each of the last 25 months. The active listing count and the sales count can be viewed as indicators of housing supply and demand respectively. Observing the ratio between them can thus help indicate a buyers' market, where there is sustained downward pressure on prices, and a sellers' market, where there is sustained upward pressure on prices. Based on a regression analysis performed by the Economics Department of the BC Real Estate Association in each market area of the province, the Sales to Active Listings Ratio for Victoria can be interpreted as follows: - below 14%, there is downward pressure on prices (buyers' market) - above 20%, there is upward pressure on prices (sellers' market) - in the 14-20% range, there is little pressure on prices either way (balanced market) Victoria Real Estate Board Multiple Listing Service ® Page 1 of 1
  • 23. Monthly Comparative Activity By Property Type Includes All MLS® Property Types March 2023 Current Month This Year % Change Last Year Year To Date This Year % Change Last Year Produced: 03-Apr-2023 Single Family - Residential Units Listed 410 Units Sold 237 Sell/List Ratio 58 Sales Dollars $279,392,662 Average Price / Unit $1,178,872 Price Ratio 99 Days To Sell 39 Active Listings at Month End 552 % % 470 329 70 $458,170,136 $1,392,614 106 12 276 % % -13 -28 -39 -15 235 100 % % % % % % 940 490 52 $587,457,891 $1,198,894 98 41 % % 1019 727 71 $1,008,132,308 $1,386,702 107 13 % % -8 -33 -42 -14 229 % % % % % Single Family - Residential Waterfront Units Listed 27 Units Sold 8 Sell/List Ratio 30 Sales Dollars $20,335,000 Average Price / Unit $2,541,875 Price Ratio 96 Days To Sell 81 Active Listings at Month End 100 % % 34 16 47 $48,148,702 $3,009,294 98 51 63 % % -21 -50 -58 -16 59 59 % % % % % % 84 27 32 $65,862,000 $2,439,333 93 66 % % 78 39 50 $102,283,452 $2,622,653 100 50 % % 8 -31 -36 -7 33 % % % % % Single Family - Residential Acreage Units Listed 59 Units Sold 23 Sell/List Ratio 39 Sales Dollars $32,774,900 Average Price / Unit $1,424,996 Price Ratio 96 Days To Sell 49 Active Listings at Month End 113 % % 46 30 65 $48,913,000 $1,630,433 99 26 48 % % 28 -23 -33 -13 91 135 % % % % % % 133 52 39 $71,850,900 $1,381,748 94 66 % % 96 57 59 $91,604,600 $1,607,098 100 30 % % 39 -9 -22 -14 120 % % % % % Condo Apartment Units Listed 342 Units Sold 197 Sell/List Ratio 58 Sales Dollars $123,761,251 Average Price / Unit $628,230 Price Ratio 98 Days To Sell 33 Active Listings at Month End 468 % % 344 279 81 $187,567,053 $672,283 104 14 212 % % -1 -29 -34 -7 136 121 % % % % % % 853 459 54 $278,259,003 $606,229 98 36 % % 900 734 82 $497,369,917 $677,616 104 17 % % -5 -37 -44 -11 116 % % % % % Page 1 of 8 Victoria Real Estate Board Multiple Listing Service ®
  • 24. Monthly Comparative Activity By Property Type Includes All MLS® Property Types March 2023 Current Month This Year % Change Last Year Year To Date This Year % Change Last Year Produced: 03-Apr-2023 Row/Townhouse Units Listed 112 Units Sold 67 Sell/List Ratio 60 Sales Dollars $51,905,540 Average Price / Unit $774,710 Price Ratio 99 Days To Sell 33 Active Listings at Month End 173 % % 140 85 61 $73,453,453 $864,158 107 14 75 % % -20 -21 -29 -10 144 131 % % % % % % 287 149 52 $111,877,141 $750,853 99 38 % % 289 227 79 $201,651,028 $888,331 106 18 % % -1 -34 -45 -15 106 % % % % % Half Duplex (Up and Down) Units Listed 1 Units Sold 1 Sell/List Ratio 100 Sales Dollars $615,000 Average Price / Unit $615,000 Price Ratio 103 Days To Sell 18 Active Listings at Month End 2 % % 1 1 100 $840,000 $840,000 94 27 2 % % 0 0 -27 -27 -33 0 % % % % % % 4 1 25 $615,000 $615,000 103 18 % % 3 2 67 $2,624,000 $1,312,000 95 218 % % 33 -50 -77 -53 -92 % % % % % Half Duplex (Side by Side) Units Listed 25 Units Sold 9 Sell/List Ratio 36 Sales Dollars $7,851,875 Average Price / Unit $872,431 Price Ratio 100 Days To Sell 33 Active Listings at Month End 33 % % 33 24 73 $21,950,004 $914,584 108 8 21 % % -24 -63 -64 -5 305 57 % % % % % % 59 40 68 $35,630,538 $890,763 100 31 % % 72 51 71 $46,640,899 $914,527 108 13 % % -18 -22 -24 -3 136 % % % % % Half Duplex (Front and Back) Units Listed 3 Units Sold 2 Sell/List Ratio 67 Sales Dollars $1,856,000 Average Price / Unit $928,000 Price Ratio 103 Days To Sell 9 Active Listings at Month End 3 % % 6 2 33 $1,925,000 $962,500 114 6 3 % % -50 0 -4 -4 55 0 % % % % % % 7 5 71 $4,704,100 $940,820 100 21 % % 11 3 27 $2,536,000 $845,333 113 8 % % -36 67 85 11 165 % % % % % Page 2 of 8 Victoria Real Estate Board Multiple Listing Service ®
  • 25. Monthly Comparative Activity By Property Type Includes All MLS® Property Types March 2023 Current Month This Year % Change Last Year Year To Date This Year % Change Last Year Produced: 03-Apr-2023 Recreational Units Listed 4 Units Sold 0 Sell/List Ratio Sales Dollars $0 Average Price / Unit Price Ratio Days To Sell Active Listings at Month End 11 % % 6 5 83 $1,079,000 $215,800 96 57 9 % % -33 -100 -100 22 % % % % % % 8 2 25 $357,500 $178,750 96 47 % % 10 7 70 $2,043,250 $291,893 94 65 % % -20 -71 -83 -39 -28 % % % % % Manufactured Home Units Listed 20 Units Sold 15 Sell/List Ratio 75 Sales Dollars $5,080,000 Average Price / Unit $338,667 Price Ratio 97 Days To Sell 54 Active Listings at Month End 38 % % 30 18 60 $5,973,701 $331,872 101 27 33 % % -33 -17 -15 2 104 15 % % % % % % 47 30 64 $10,269,500 $342,317 96 64 % % 64 44 69 $14,880,101 $338,184 100 32 % % -27 -32 -31 1 97 % % % % % Residential Lots Units Listed 27 Units Sold 6 Sell/List Ratio 22 Sales Dollars $3,802,000 Average Price / Unit $633,667 Price Ratio 96 Days To Sell 108 Active Listings at Month End 93 % % 26 13 50 $7,149,850 $549,988 101 27 39 % % 4 -54 -47 15 296 138 % % % % % % 79 11 14 $7,127,000 $647,909 95 103 % % 71 44 62 $24,896,046 $565,819 100 29 % % 11 -75 -71 15 258 % % % % % Residential Lots - Waterfront Units Listed 2 Units Sold 0 Sell/List Ratio Sales Dollars $0 Average Price / Unit Price Ratio Days To Sell Active Listings at Month End 13 % % 3 1 33 -$667,000 -$667,000 66 7 8 % % -33 -100 -100 63 % % % % % % 6 1 17 $1,250,000 $1,250,000 93 21 % % 10 2 20 $1,633,000 $816,500 110 7 % % -40 -50 -23 53 215 % % % % % Page 3 of 8 Victoria Real Estate Board Multiple Listing Service ®
  • 26. Monthly Comparative Activity By Property Type Includes All MLS® Property Types March 2023 Current Month This Year % Change Last Year Year To Date This Year % Change Last Year Produced: 03-Apr-2023 Residential Acreage Units Listed 12 Units Sold 3 Sell/List Ratio 25 Sales Dollars $1,355,000 Average Price / Unit $451,667 Price Ratio 97 Days To Sell 144 Active Listings at Month End 50 % % 10 4 40 $4,324,000 $1,081,000 104 111 33 % % 20 -25 -69 -58 30 52 % % % % % % 26 6 23 $4,786,000 $797,667 99 119 % % 32 16 50 $12,239,400 $764,963 100 98 % % -19 -63 -61 4 21 % % % % % Residential Acreage - Waterfront Units Listed 5 Units Sold 0 Sell/List Ratio Sales Dollars $0 Average Price / Unit Price Ratio Days To Sell Active Listings at Month End 22 % % 1 0 $0 3 % % 400 633 % % % % % % 9 1 11 $2,750,000 $2,750,000 92 57 % % 4 3 75 $2,014,000 $671,333 96 134 % % 125 -67 37 310 -57 % % % % % Revenue - Duplex/Triplex Units Listed 5 Units Sold 1 Sell/List Ratio 20 Sales Dollars $1,525,000 Average Price / Unit $1,525,000 Price Ratio 95 Days To Sell 50 Active Listings at Month End 8 % % 11 5 45 $6,745,000 $1,349,000 101 14 10 % % -55 -80 -77 13 262 -20 % % % % % % 13 4 31 $5,896,000 $1,474,000 92 55 % % 26 14 54 $20,151,000 $1,439,357 107 12 % % -50 -71 -71 2 356 % % % % % Revenue - Multi Units Units Listed 5 Units Sold 4 Sell/List Ratio 80 Sales Dollars $5,030,000 Average Price / Unit $1,257,500 Price Ratio 94 Days To Sell 120 Active Listings at Month End 17 % % 10 4 40 $5,992,000 $1,498,000 104 11 17 % % -50 0 -16 -16 1038 0 % % % % % % 13 5 38 $6,230,000 $1,246,000 94 100 % % 27 7 26 $10,022,000 $1,431,714 103 61 % % -52 -29 -38 -13 64 % % % % % Page 4 of 8 Victoria Real Estate Board Multiple Listing Service ®
  • 27. Monthly Comparative Activity By Property Type Includes All MLS® Property Types March 2023 Current Month This Year % Change Last Year Year To Date This Year % Change Last Year Produced: 03-Apr-2023 Revenue - Apartment Block Units Listed 0 Units Sold 0 Sell/List Ratio Sales Dollars $0 Average Price / Unit Price Ratio Days To Sell Active Listings at Month End 0 % % 0 0 $0 0 % % % % % % % % 0 0 $0 % % 0 0 $0 % % % % % % % Revenue - Commercial Units Listed 17 Units Sold 2 Sell/List Ratio 12 Sales Dollars $1,247,680 Average Price / Unit $623,840 Price Ratio 97 Days To Sell 70 Active Listings at Month End 41 % % 7 3 43 $7,715,000 $2,571,667 99 85 24 % % 143 -33 -84 -76 -18 71 % % % % % % 34 9 26 $5,229,180 $581,020 94 61 % % 22 13 59 $20,687,212 $1,591,324 99 52 % % 55 -31 -75 -63 18 % % % % % Revenue - Industrial Units Listed 6 Units Sold 1 Sell/List Ratio 17 Sales Dollars $1,850,000 Average Price / Unit $1,850,000 Price Ratio 97 Days To Sell 57 Active Listings at Month End 18 % % 2 7 350 $4,418,600 $631,229 101 51 9 % % 200 -86 -58 193 11 100 % % % % % % 12 3 25 $3,175,000 $1,058,333 96 151 % % 14 14 100 $11,133,600 $795,257 100 35 % % -14 -79 -71 33 329 % % % % % Business with Land Building Units Listed 0 Units Sold 0 Sell/List Ratio Sales Dollars $0 Average Price / Unit Price Ratio Days To Sell Active Listings at Month End 4 % % 0 0 $0 6 % % -33 % % % % % % 2 0 0 $0 % % 3 0 0 $0 % % -33 % % % % % Page 5 of 8 Victoria Real Estate Board Multiple Listing Service ®
  • 28. Monthly Comparative Activity By Property Type Includes All MLS® Property Types March 2023 Current Month This Year % Change Last Year Year To Date This Year % Change Last Year Produced: 03-Apr-2023 Business Only Units Listed 9 Units Sold 4 Sell/List Ratio 44 Sales Dollars $560,000 Average Price / Unit $140,000 Price Ratio 73 Days To Sell 125 Active Listings at Month End 60 % % 12 0 $0 54 % % -25 11 % % % % % % 37 12 32 $1,758,000 $146,500 85 129 % % 30 4 13 $805,000 $201,250 90 81 % % 23 200 118 -27 58 % % % % % Motel/Hotel Units Listed 0 Units Sold 0 Sell/List Ratio Sales Dollars $0 Average Price / Unit Price Ratio Days To Sell Active Listings at Month End 0 % % 0 0 $0 0 % % % % % % % % 0 0 $0 % % 0 0 $0 % % % % % % % Lease - Office Units Listed 11 Units Sold 5 Sell/List Ratio 45 Sales Dollars $3,988 Average Price / Unit $798 Price Ratio 98 Days To Sell 76 Active Listings at Month End 70 % % 9 4 44 $56 $14 97 96 50 % % 22 25 7002 5582 -21 40 % % % % % % 38 13 34 $4,142 $319 99 102 % % 26 8 31 $70,036 $8,755 50553 89 % % 46 63 -94 -96 15 % % % % % Lease - Retail Units Listed 10 Units Sold 3 Sell/List Ratio 30 Sales Dollars $71 Average Price / Unit $24 Price Ratio 99 Days To Sell 164 Active Listings at Month End 47 % % 11 2 18 $49 $25 96 150 41 % % -9 50 45 -3 9 15 % % % % % % 20 4 20 $96 $24 99 140 % % 21 6 29 $155 $26 97 90 % % -5 -33 -38 -7 56 % % % % % Page 6 of 8 Victoria Real Estate Board Multiple Listing Service ®
  • 29. Monthly Comparative Activity By Property Type Includes All MLS® Property Types March 2023 Current Month This Year % Change Last Year Year To Date This Year % Change Last Year Produced: 03-Apr-2023 Lease - Warehouse Units Listed 0 Units Sold 0 Sell/List Ratio Sales Dollars $0 Average Price / Unit Price Ratio Days To Sell Active Listings at Month End 0 % % 0 0 $0 0 % % % % % % % % 0 0 $0 % % 0 0 $0 % % % % % % % Lease - Industrial Units Listed 4 Units Sold 2 Sell/List Ratio 50 Sales Dollars $33 Average Price / Unit $16 Price Ratio 100 Days To Sell 87 Active Listings at Month End 19 % % 0 0 $0 3 % % 533 % % % % % % 18 4 22 $81 $20 3 55 % % 2 0 0 $0 % % 800 % % % % % Lease - Other Units Listed 1 Units Sold 0 Sell/List Ratio Sales Dollars $0 Average Price / Unit Price Ratio Days To Sell Active Listings at Month End 5 % % 0 1 $23 $23 100 157 3 % % -100 -100 67 % % % % % % 3 0 0 $0 % % 0 1 $23 $23 100 157 % % -100 -100 % % % % % Commercial Land Units Listed 1 Units Sold 0 Sell/List Ratio Sales Dollars $0 Average Price / Unit Price Ratio Days To Sell Active Listings at Month End 10 % % 5 0 $0 21 % % -80 -52 % % % % % % 2 0 0 $0 % % 11 2 18 $18,025,000 $9,012,500 99 131 % % -82 -100 -100 % % % % % Page 7 of 8 Victoria Real Estate Board Multiple Listing Service ®
  • 30. Monthly Comparative Activity By Property Type Includes All MLS® Property Types March 2023 Current Month This Year % Change Last Year Year To Date This Year % Change Last Year Produced: 03-Apr-2023 Units Listed 1118 Units Sold 590 Sell/List Ratio 53 Sales Dollars $538,946,000 Average Price / Unit $913,468 Price Ratio 98 Days To Sell 41 Active Listings at Month End 1970 % % Grand Totals 1217 833 68 $883,697,627 $1,060,861 105 17 1063 % % -8 -29 -39 -14 147 85 % % % % % % 2734 1328 49 $1,205,089,072 $907,447 97 44 % % 2841 2025 71 $2,091,442,027 $1,032,811 105 19 % % -4 -34 -42 -12 127 % % % % % Page 8 of 8 Victoria Real Estate Board Multiple Listing Service ®