Download as PDF, PPTX


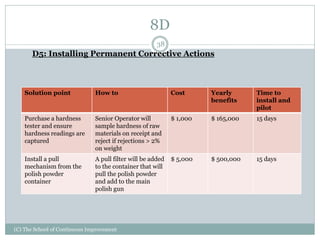
![8D
(C) The School of Continuous Improvement
28
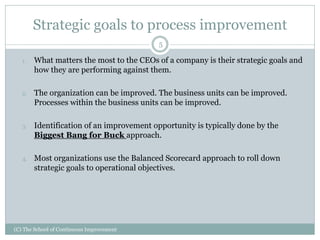
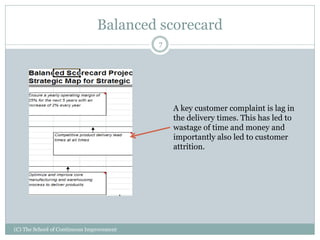
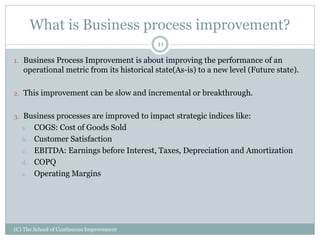
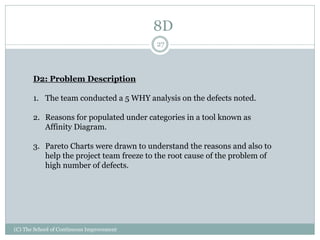
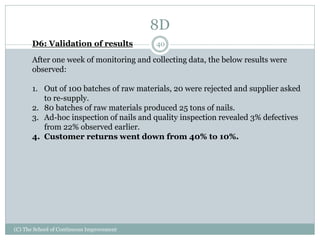
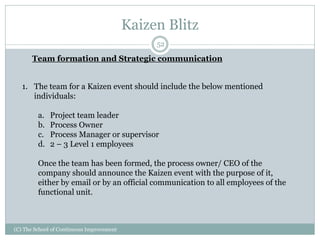
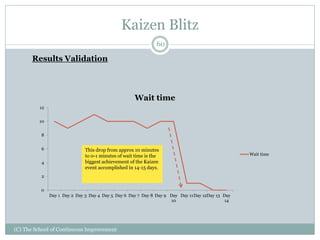
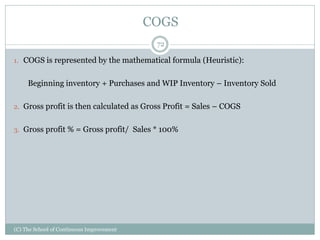
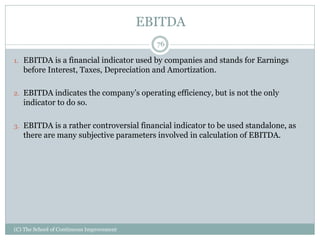
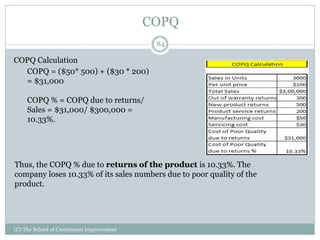
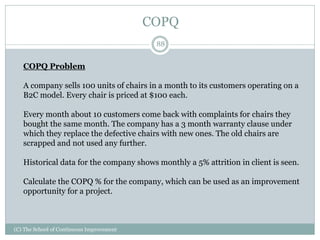
D2: Problem Description
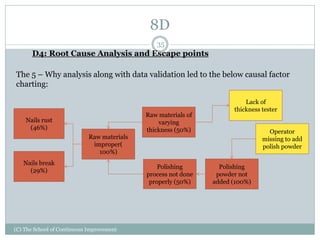
Nailsrustwithin10days
Strengthofnailsisbad
Nailbreaks
Nailtipisnotsharp
Nailheadisnotround
Nailisnotcentred
0%
20%
40%
60%
80%
100%
0
10
20
30
40
50
60
Cumulative%
Defects
Causes
[Pareto Chart for Defects]
Vital Few Useful Many
75% of defects happen due to
Nails rusting quickly and nails
breaking earlier than expected.](https://image.slidesharecdn.com/yellowbeltprocessimprovementtrainingandcertificationmodule-150419040943-conversion-gate02/85/Yellow-belt-process-improvement-training-and-certification-module-28-320.jpg)

The document outlines a free training and certification program focused on process improvement, detailing key concepts such as linking strategic goals to improvement initiatives and various methodologies like Kaizen and Lean Six Sigma. It emphasizes the importance of management buy-in, data availability, and a structured approach to business process improvement through steps like standardization and optimization. Additionally, it includes case studies illustrating how to select appropriate improvement approaches based on organizational needs and constraints.


