Download as PDF, PPTX


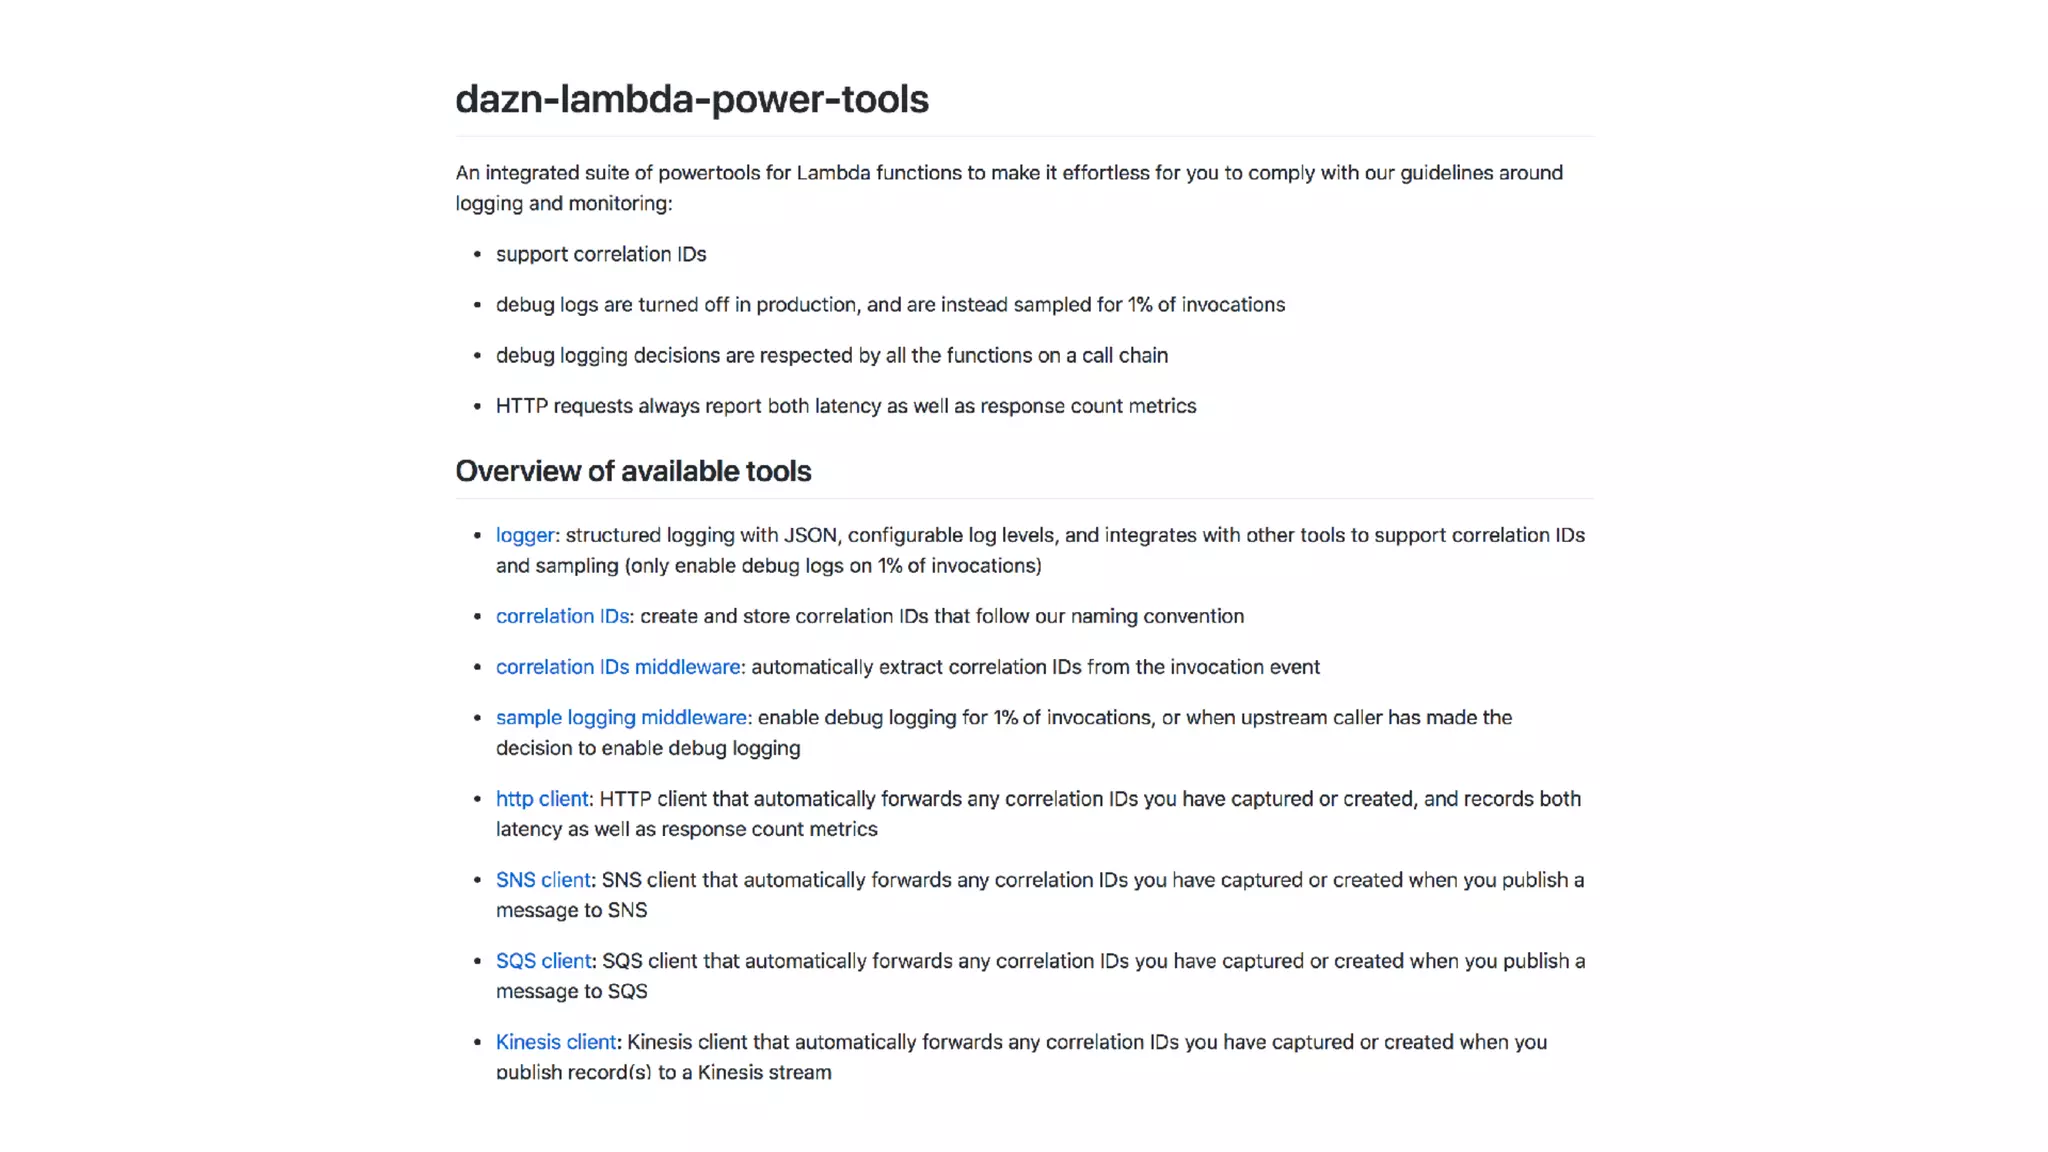
![get-restaurants
global.CONTEXT
global.CONTEXT
x-correlation-id = …
x-correlation-xxx = …
get-index
headers[“User-Agent”]
headers[“Debug-Log-Enabled”]
headers[“User-Agent”]
headers[“Debug-Log-Enabled”]
headers[“x-correlation-id”]
capture
forward
function
event
log.info(…)](https://image.slidesharecdn.com/howtobuildobservabilityintoaserverlessapplication-190519103939/75/Yan-Cui-How-to-build-observability-into-a-serverless-application-Codemotion-Amsterdam-2019-140-2048.jpg)
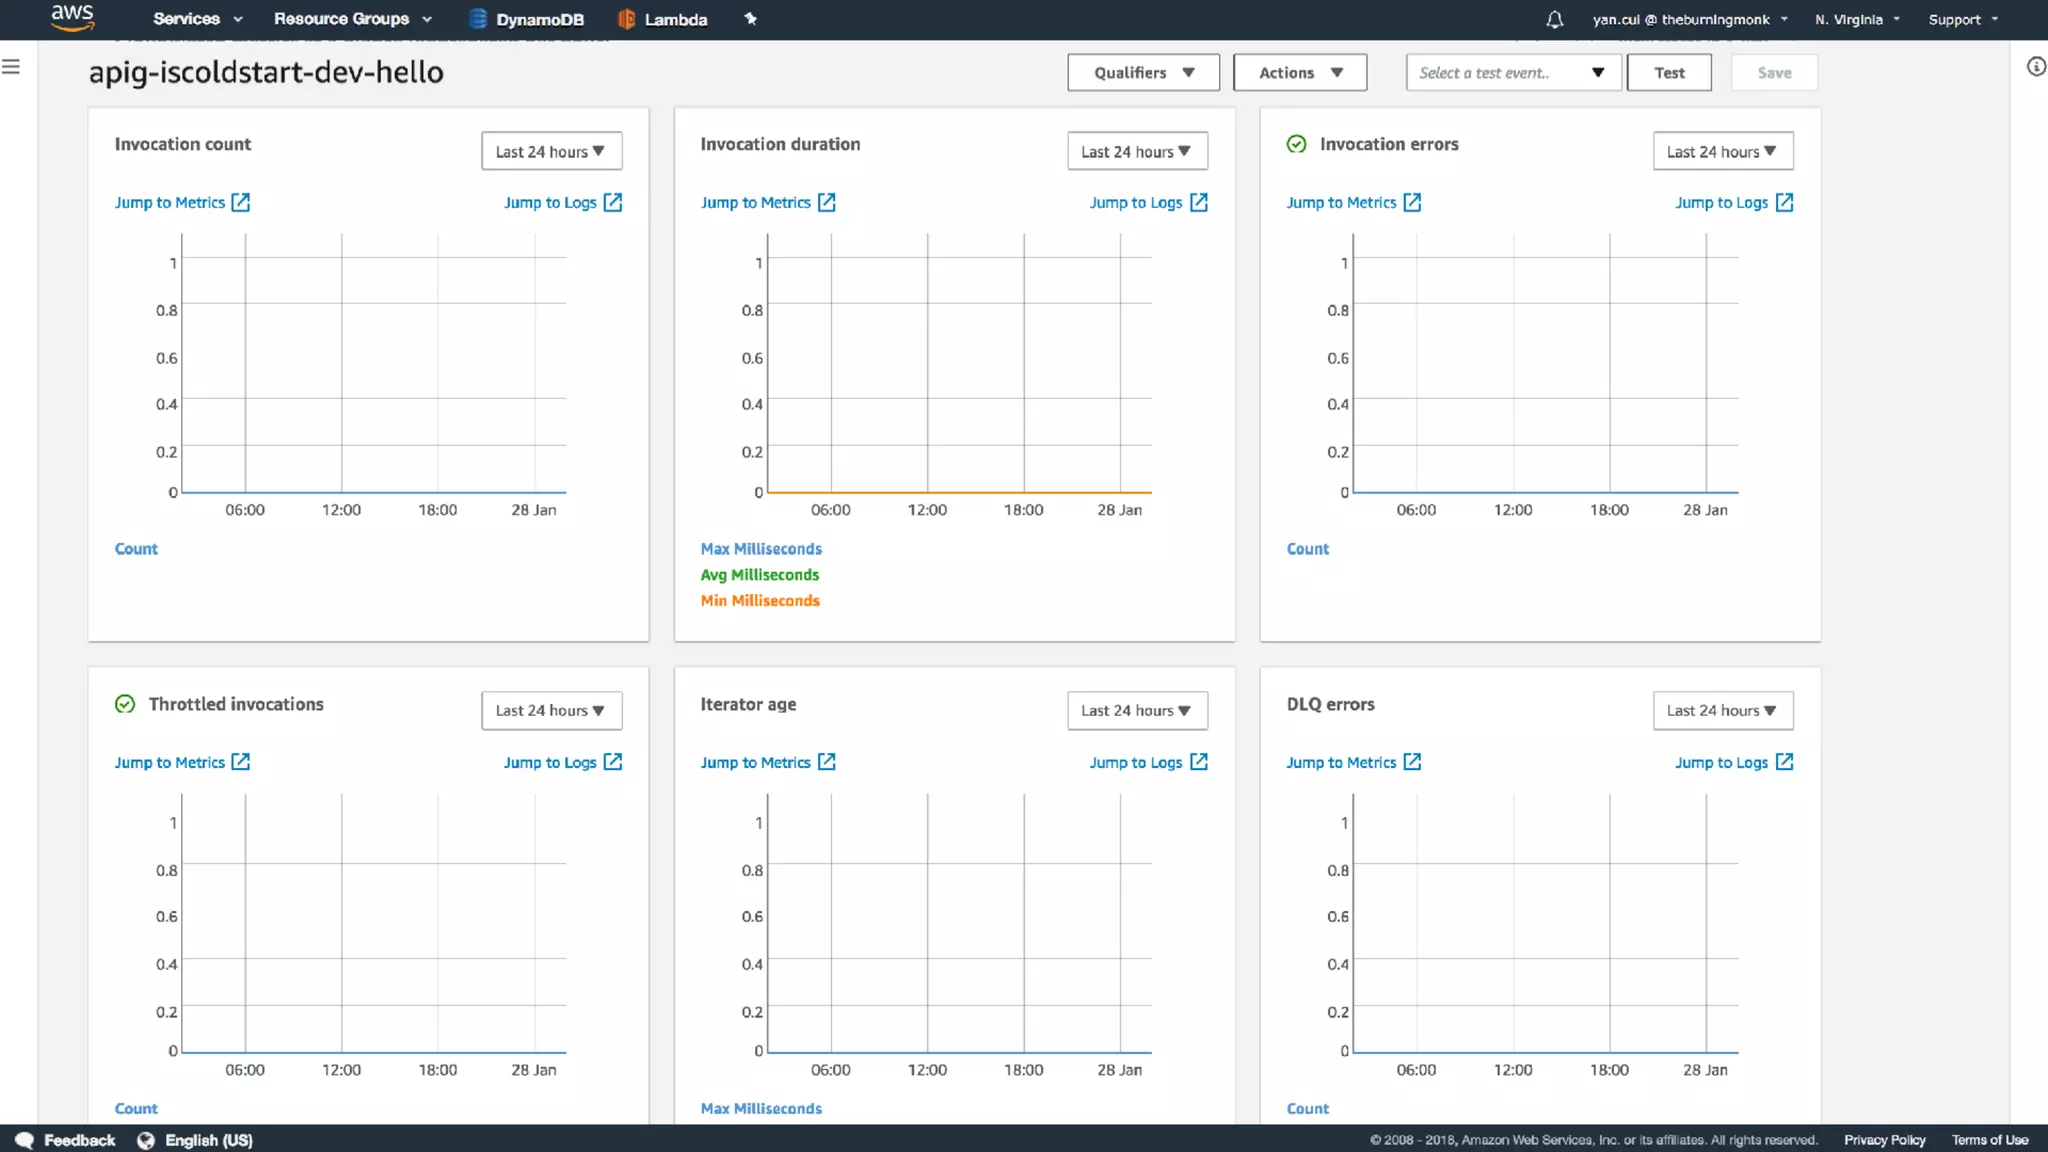
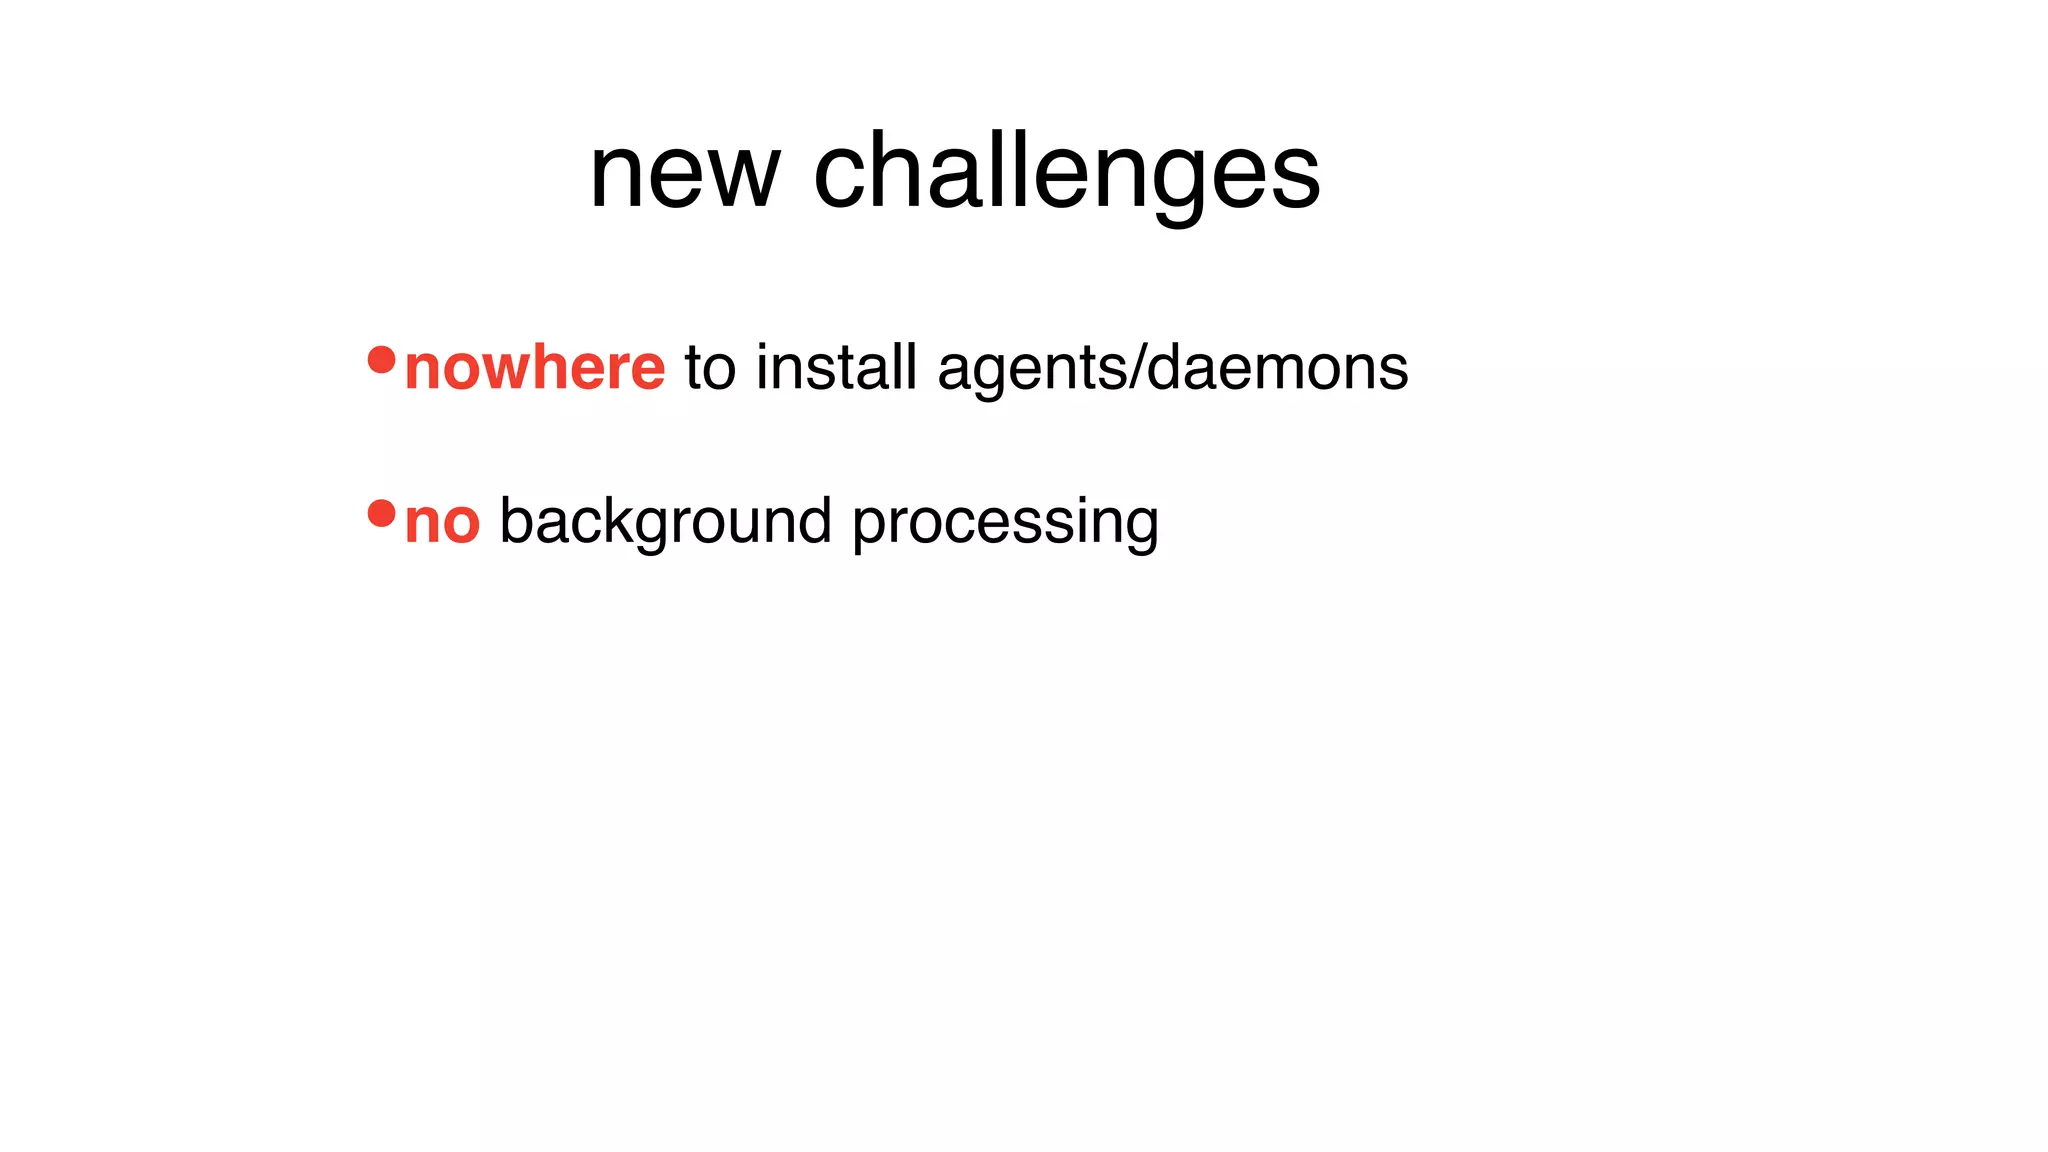

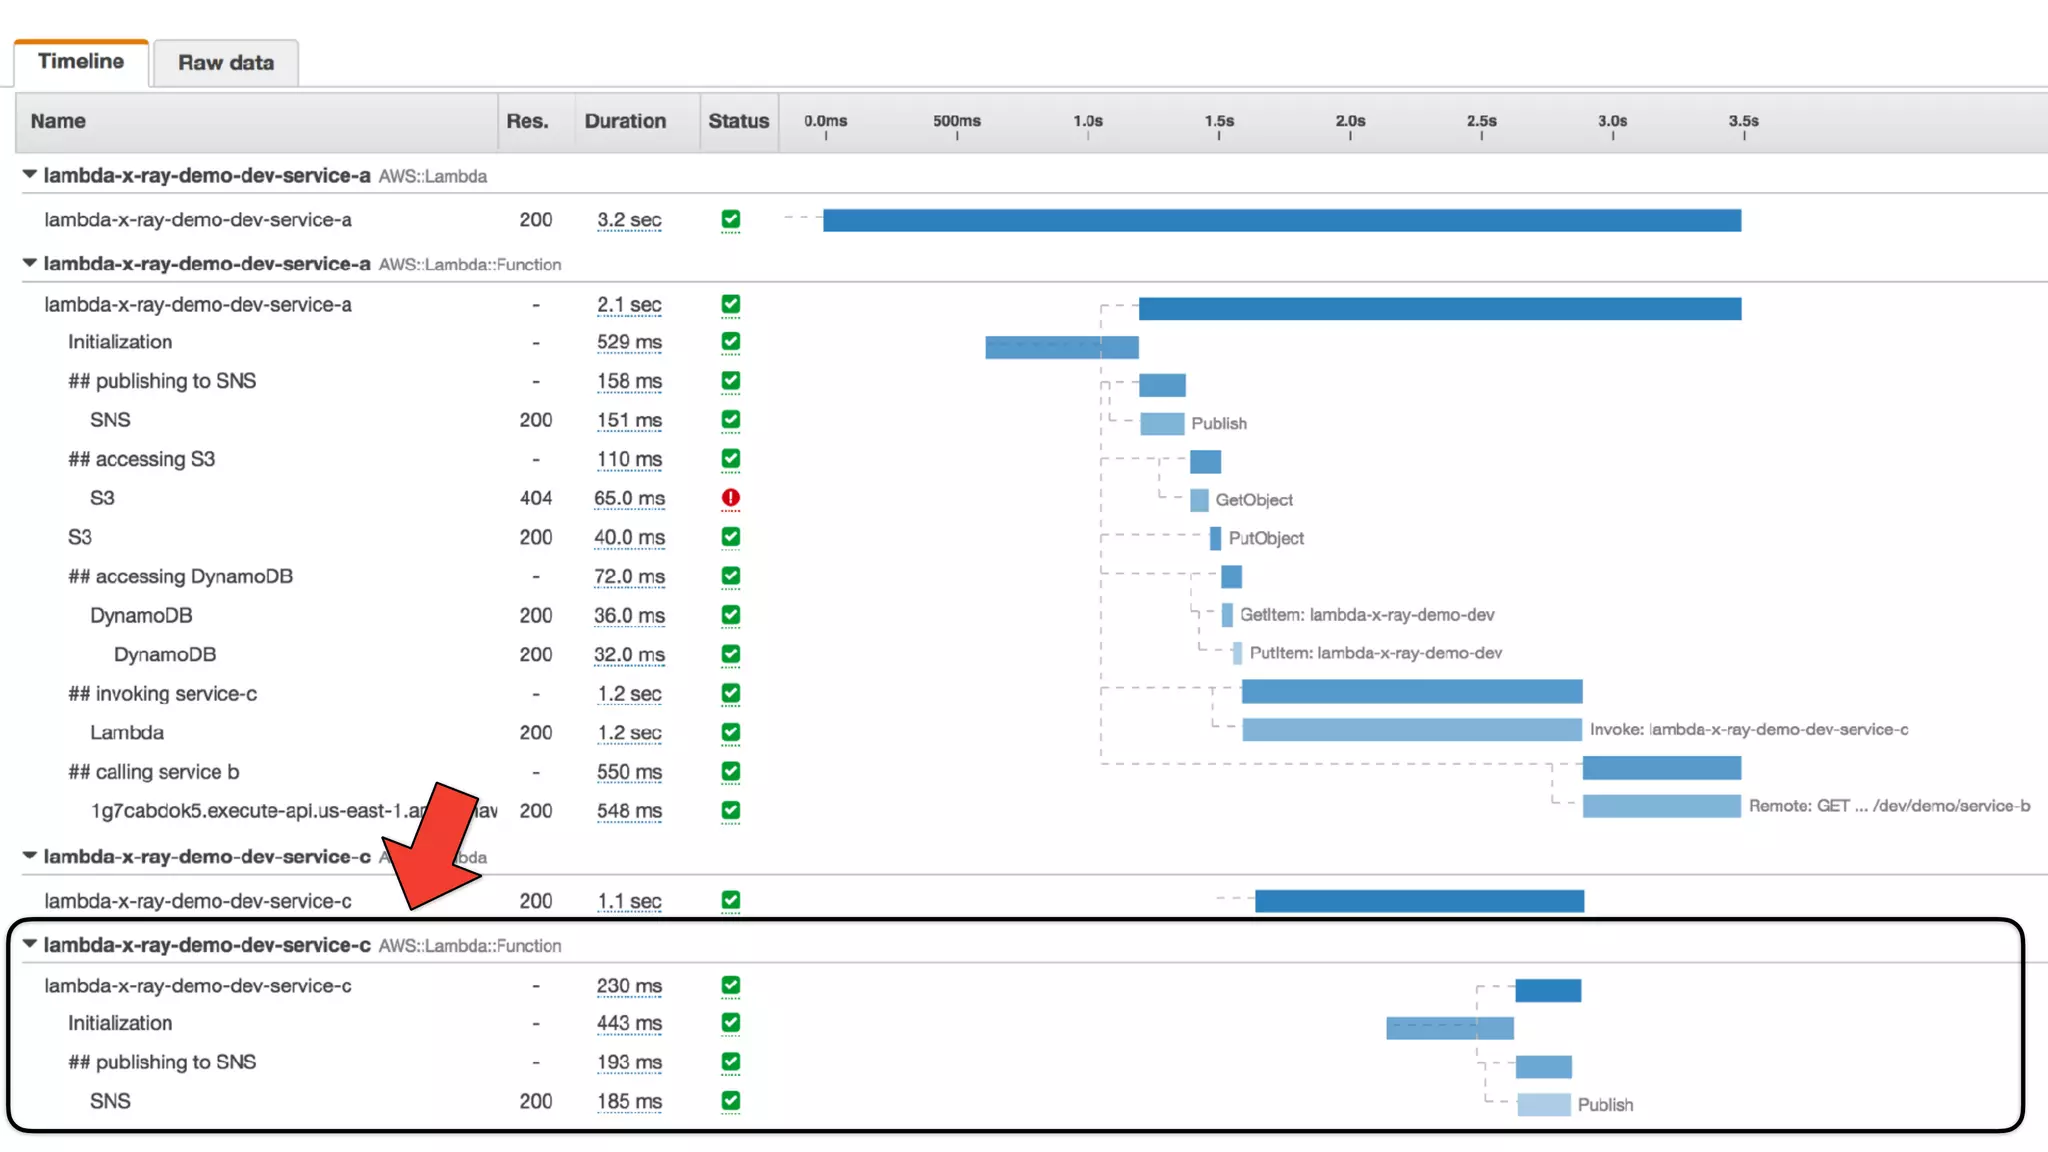
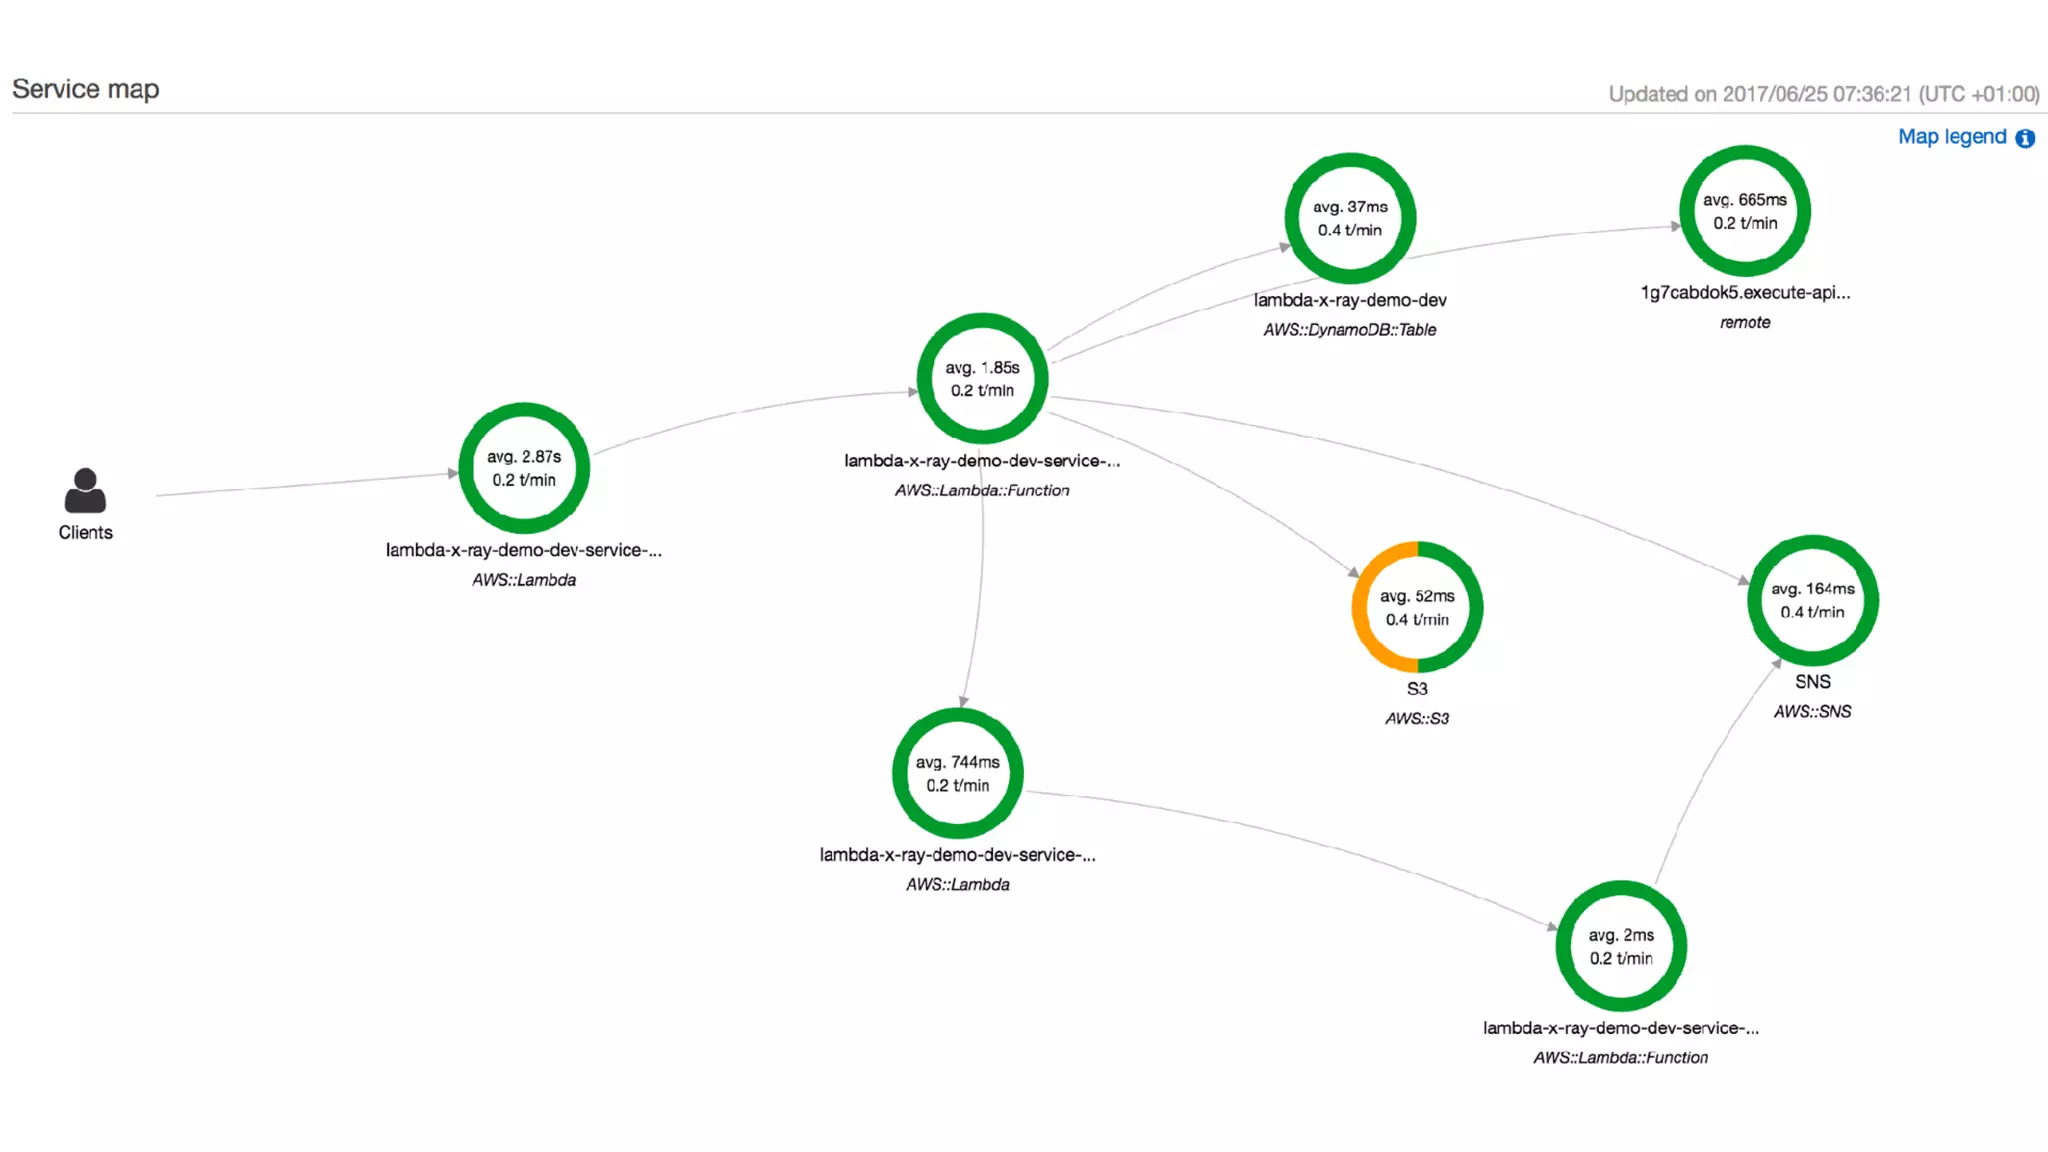
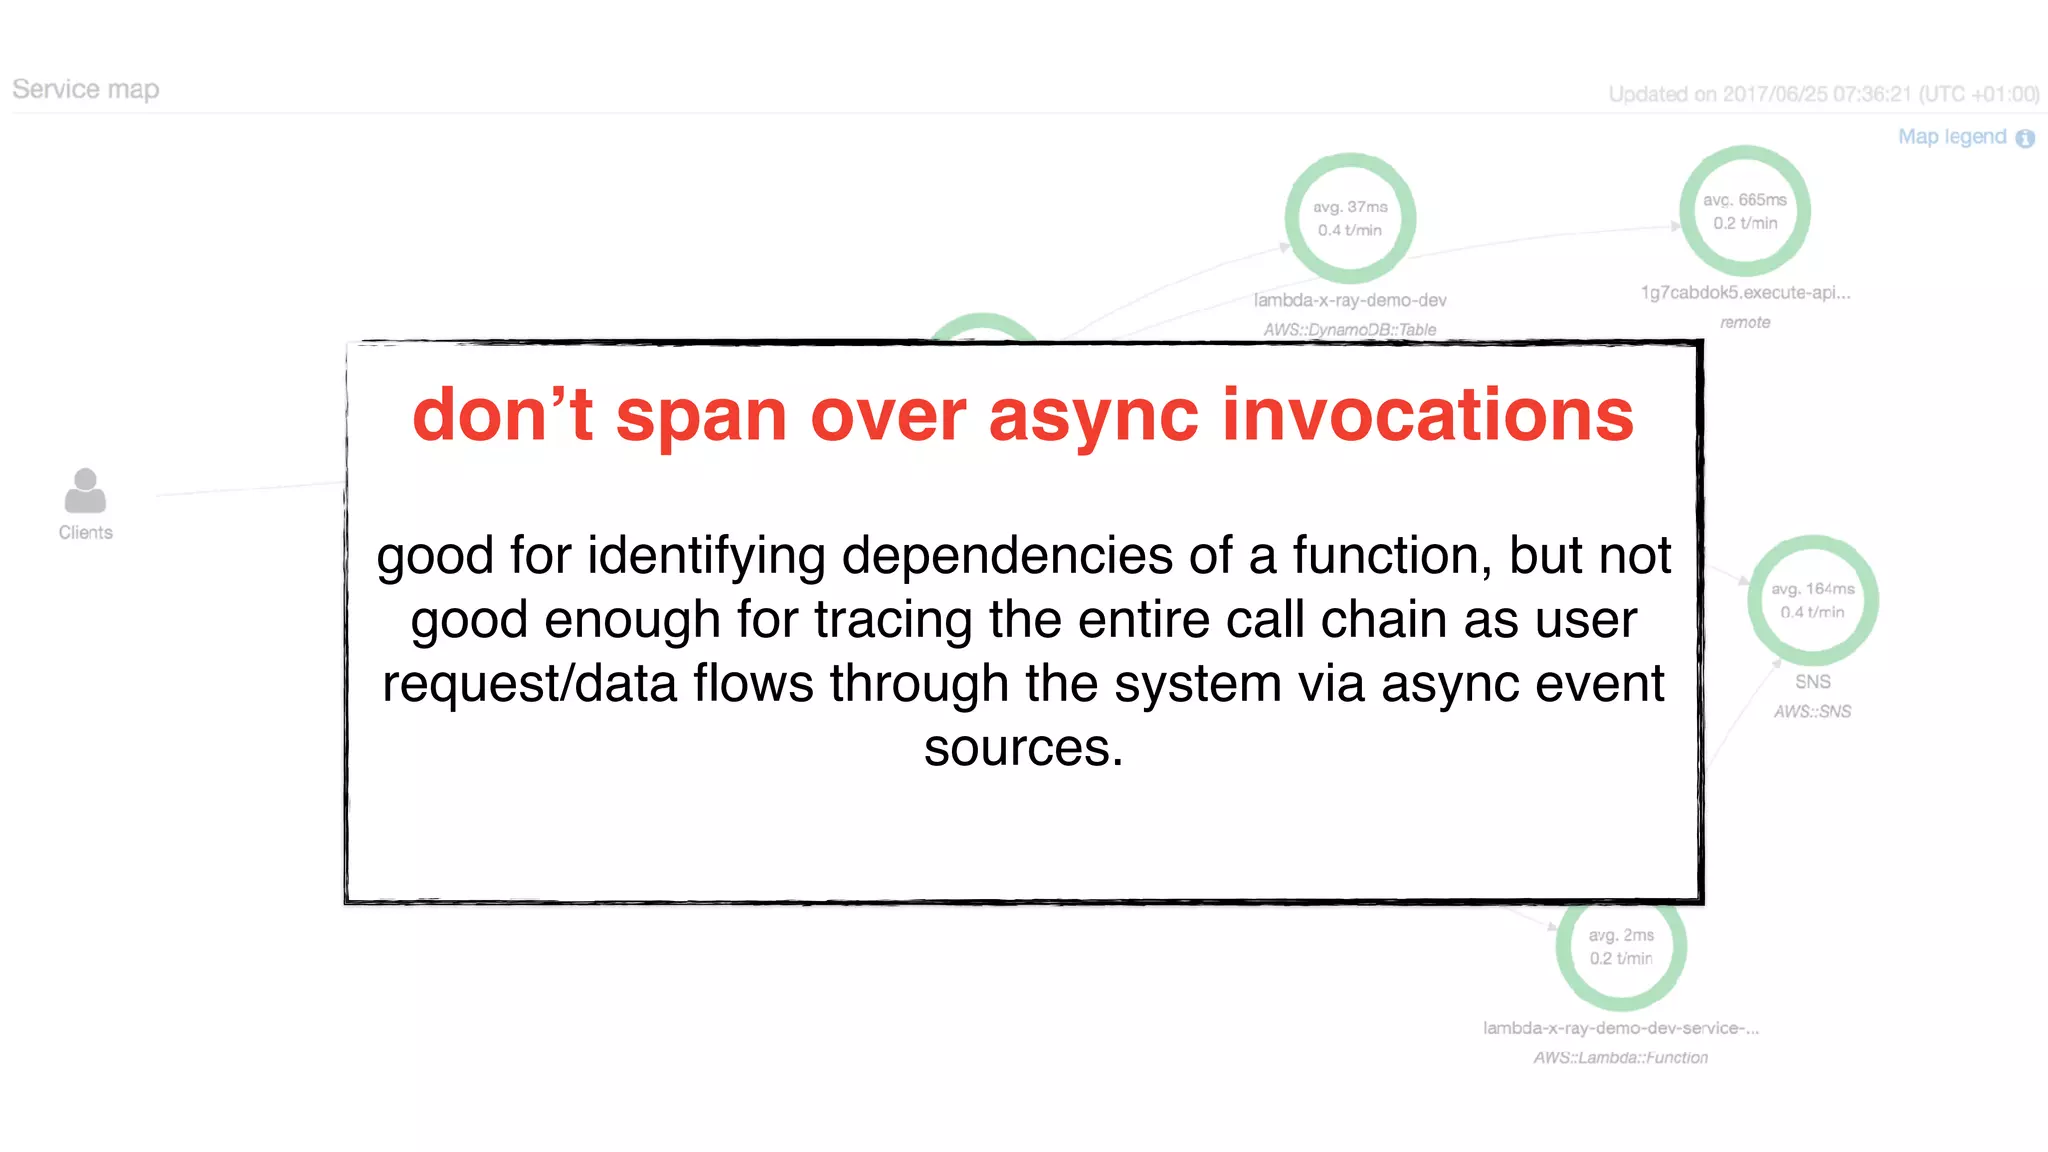
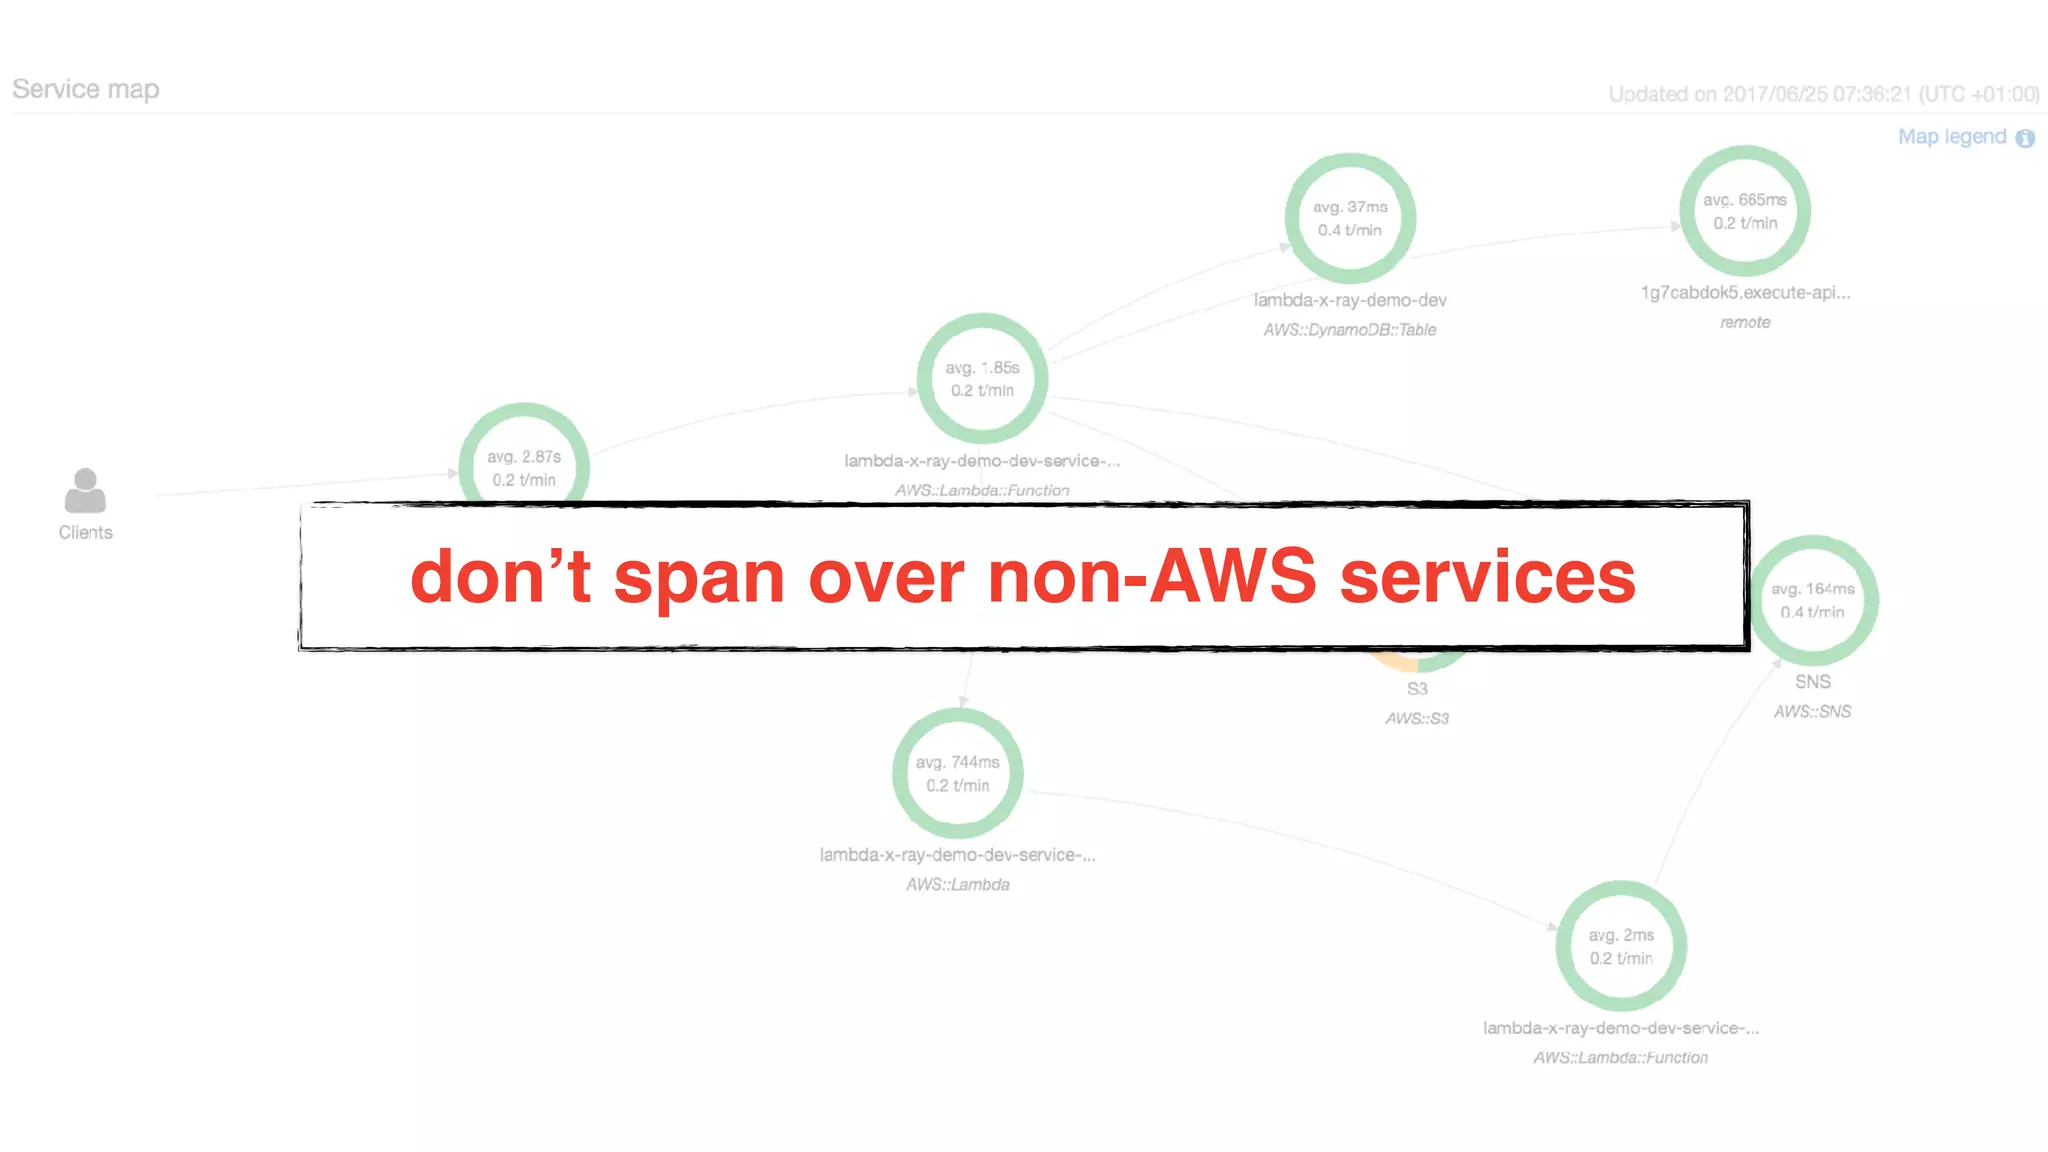
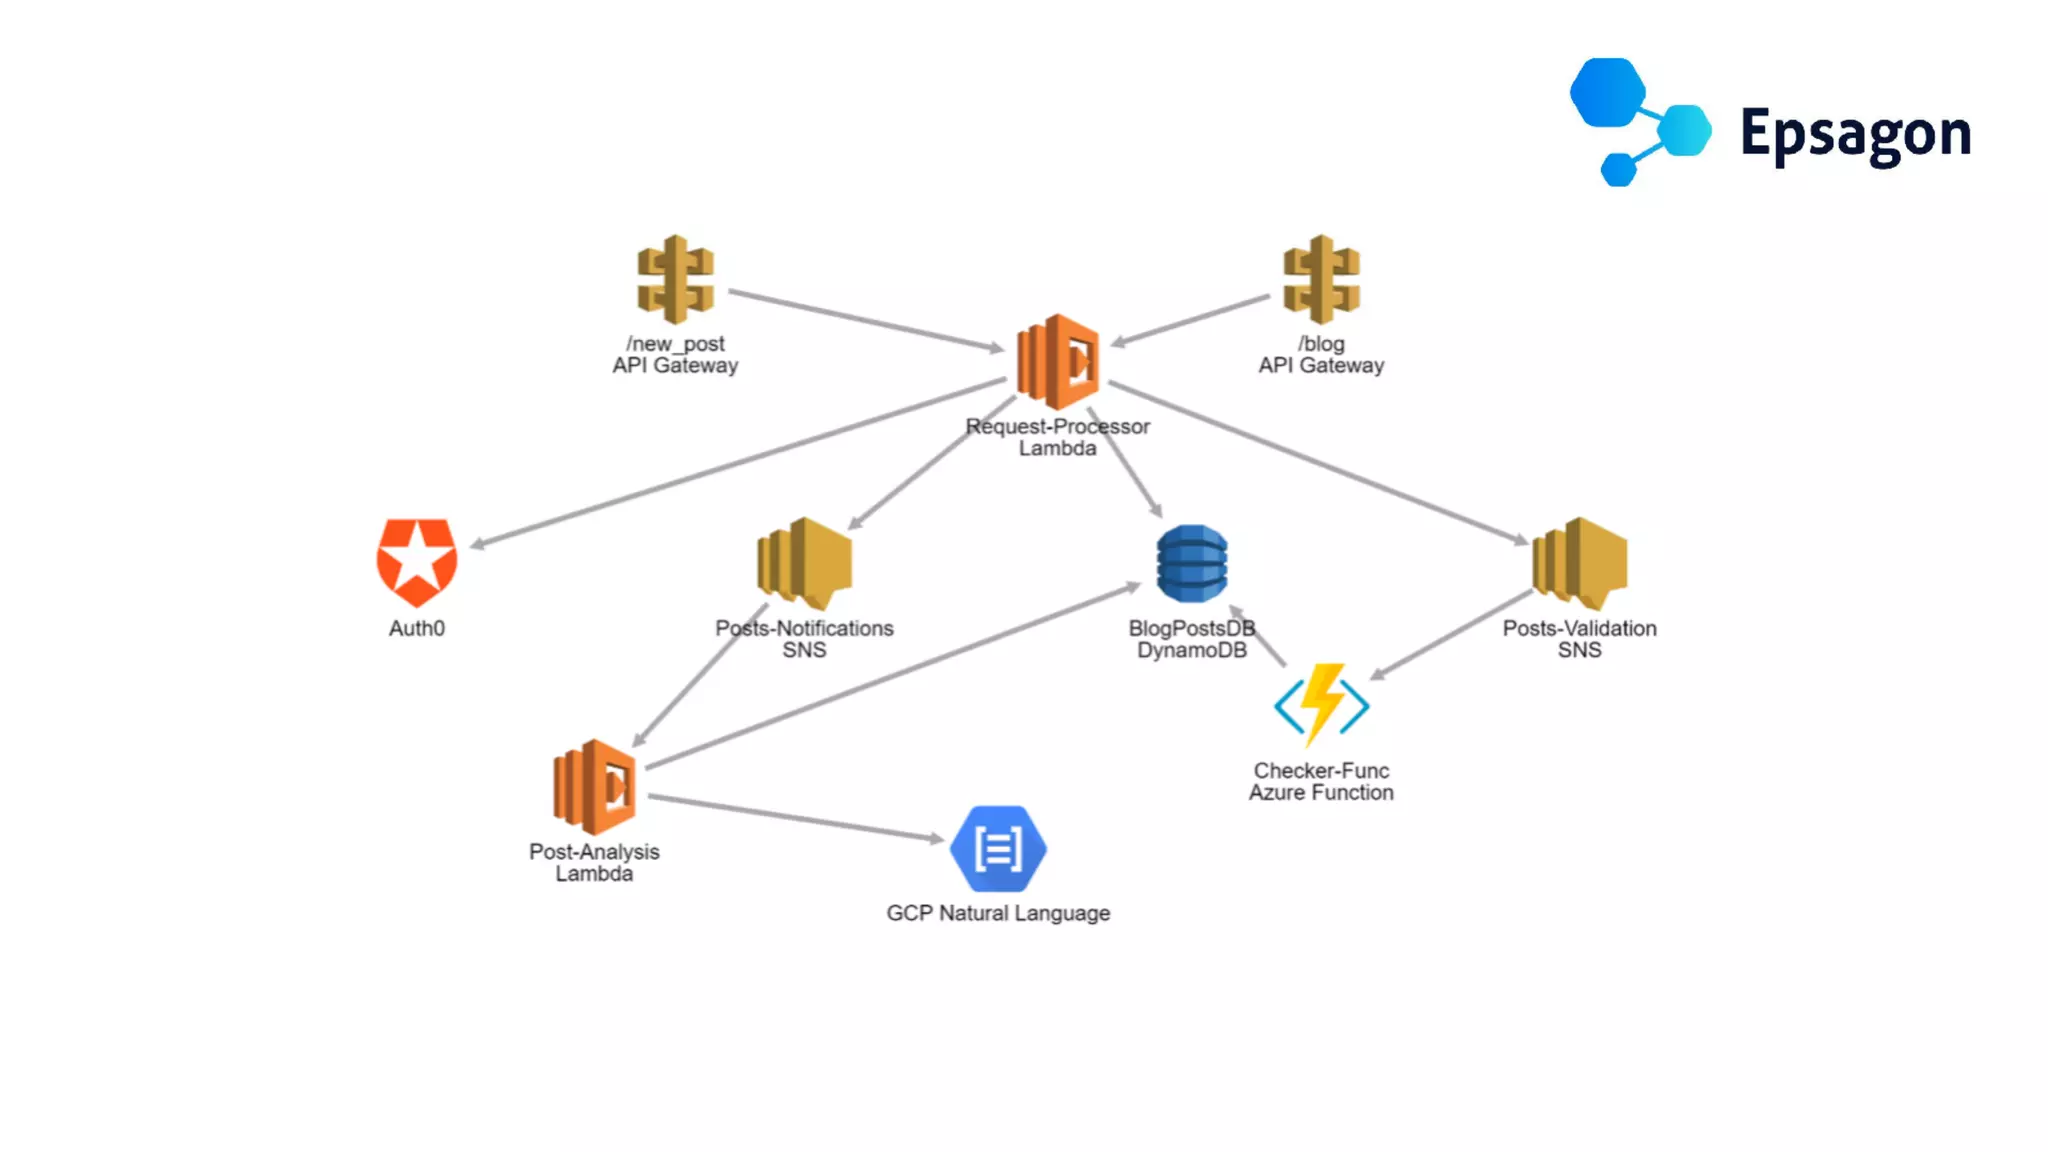
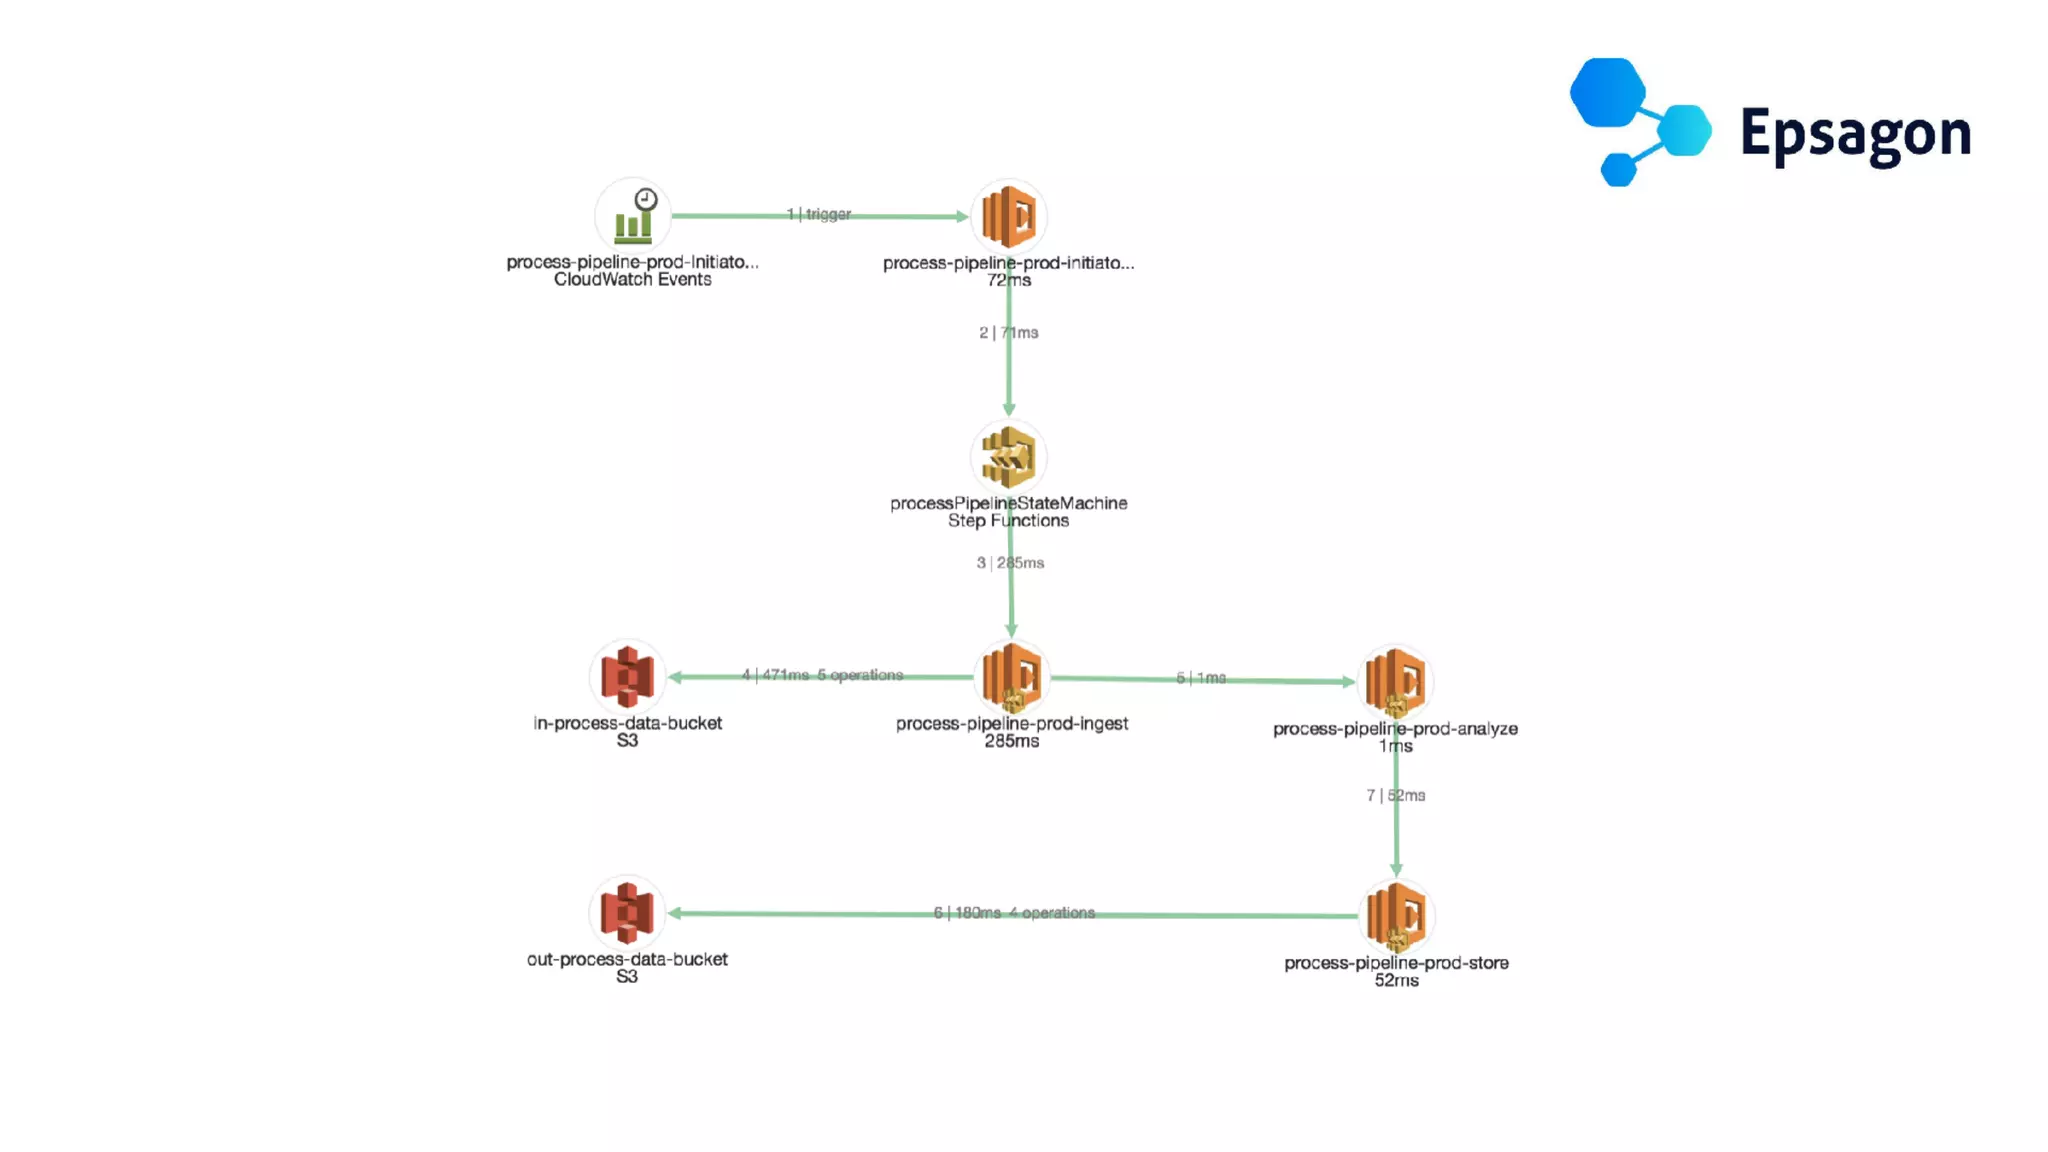
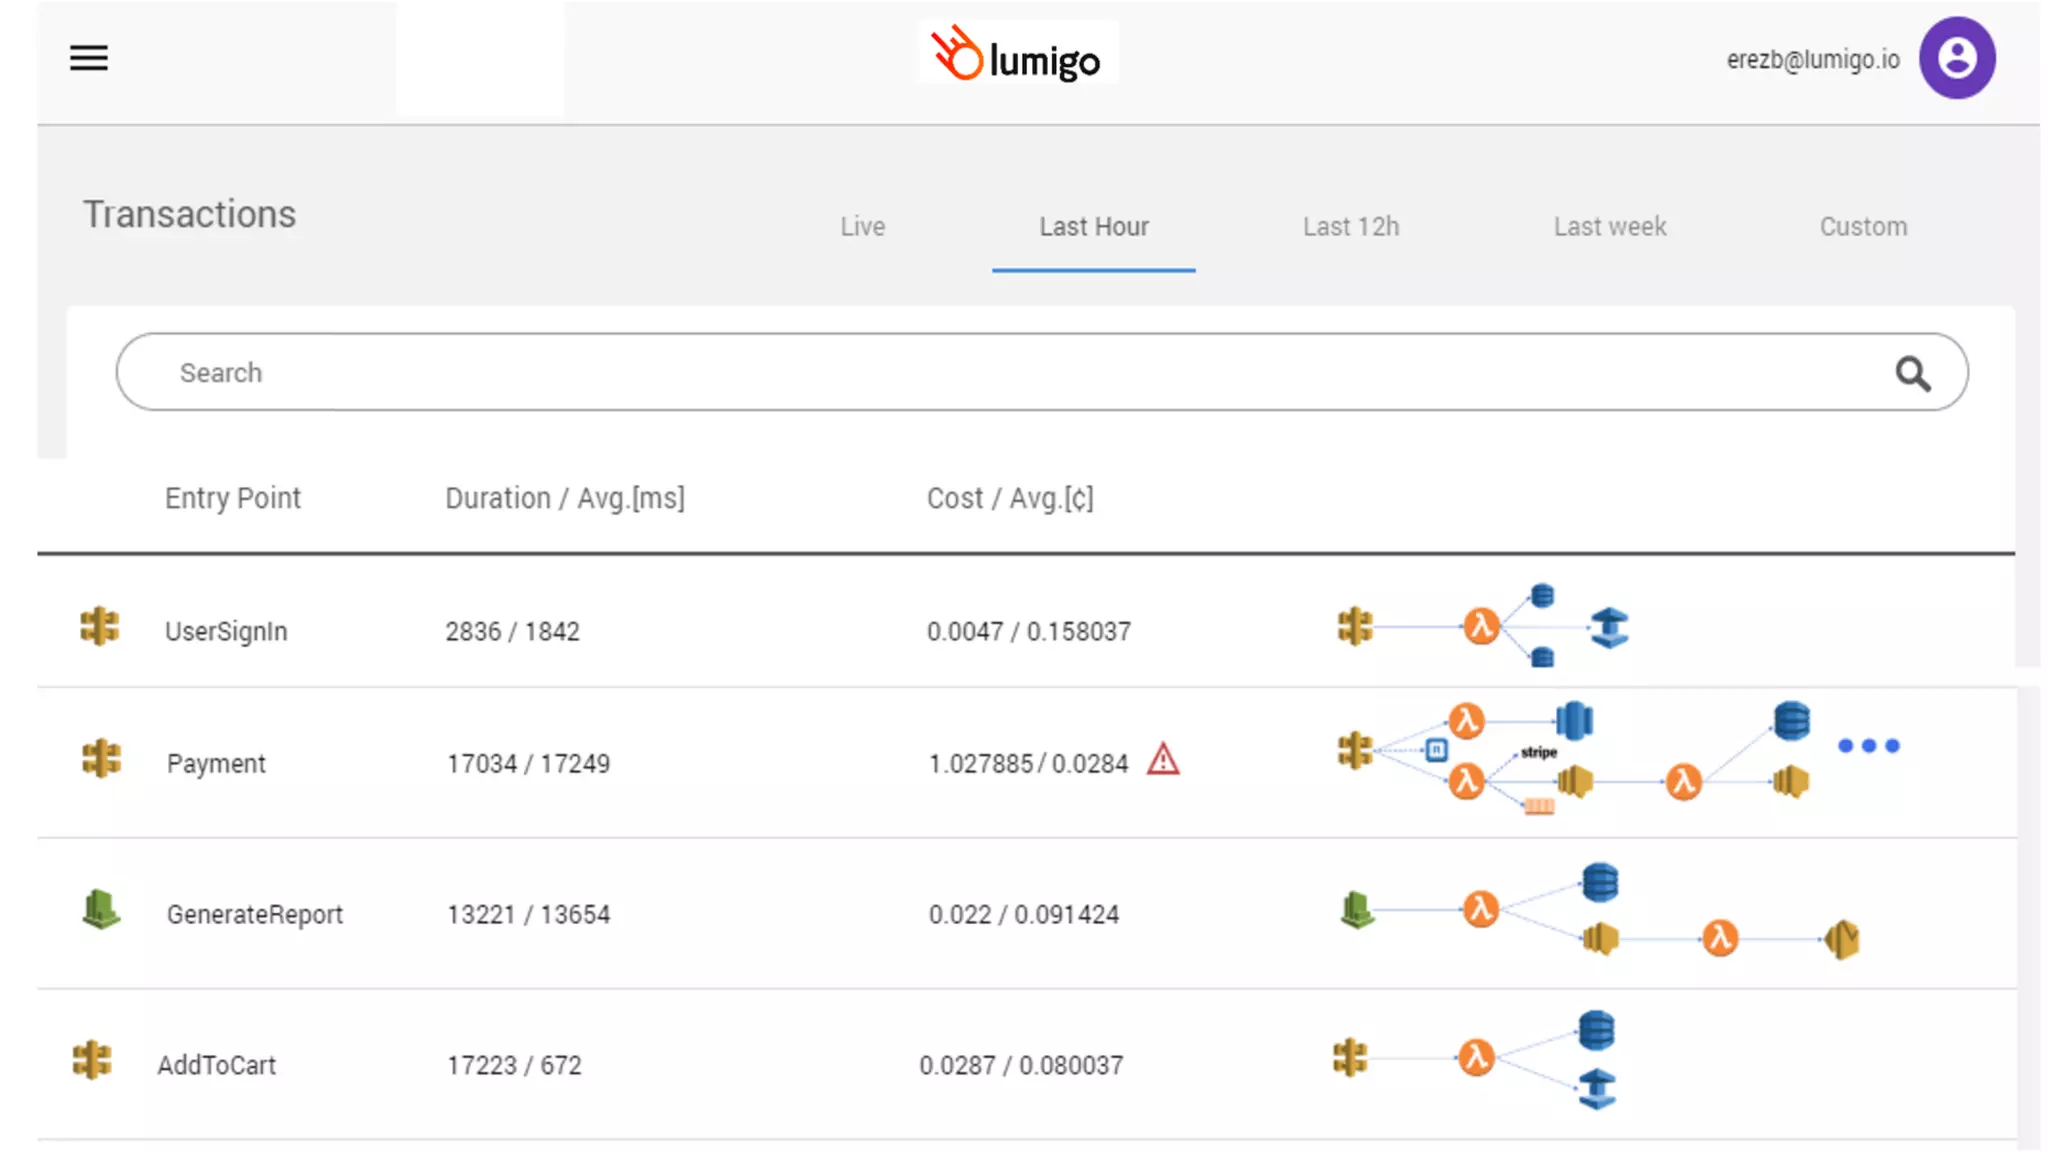


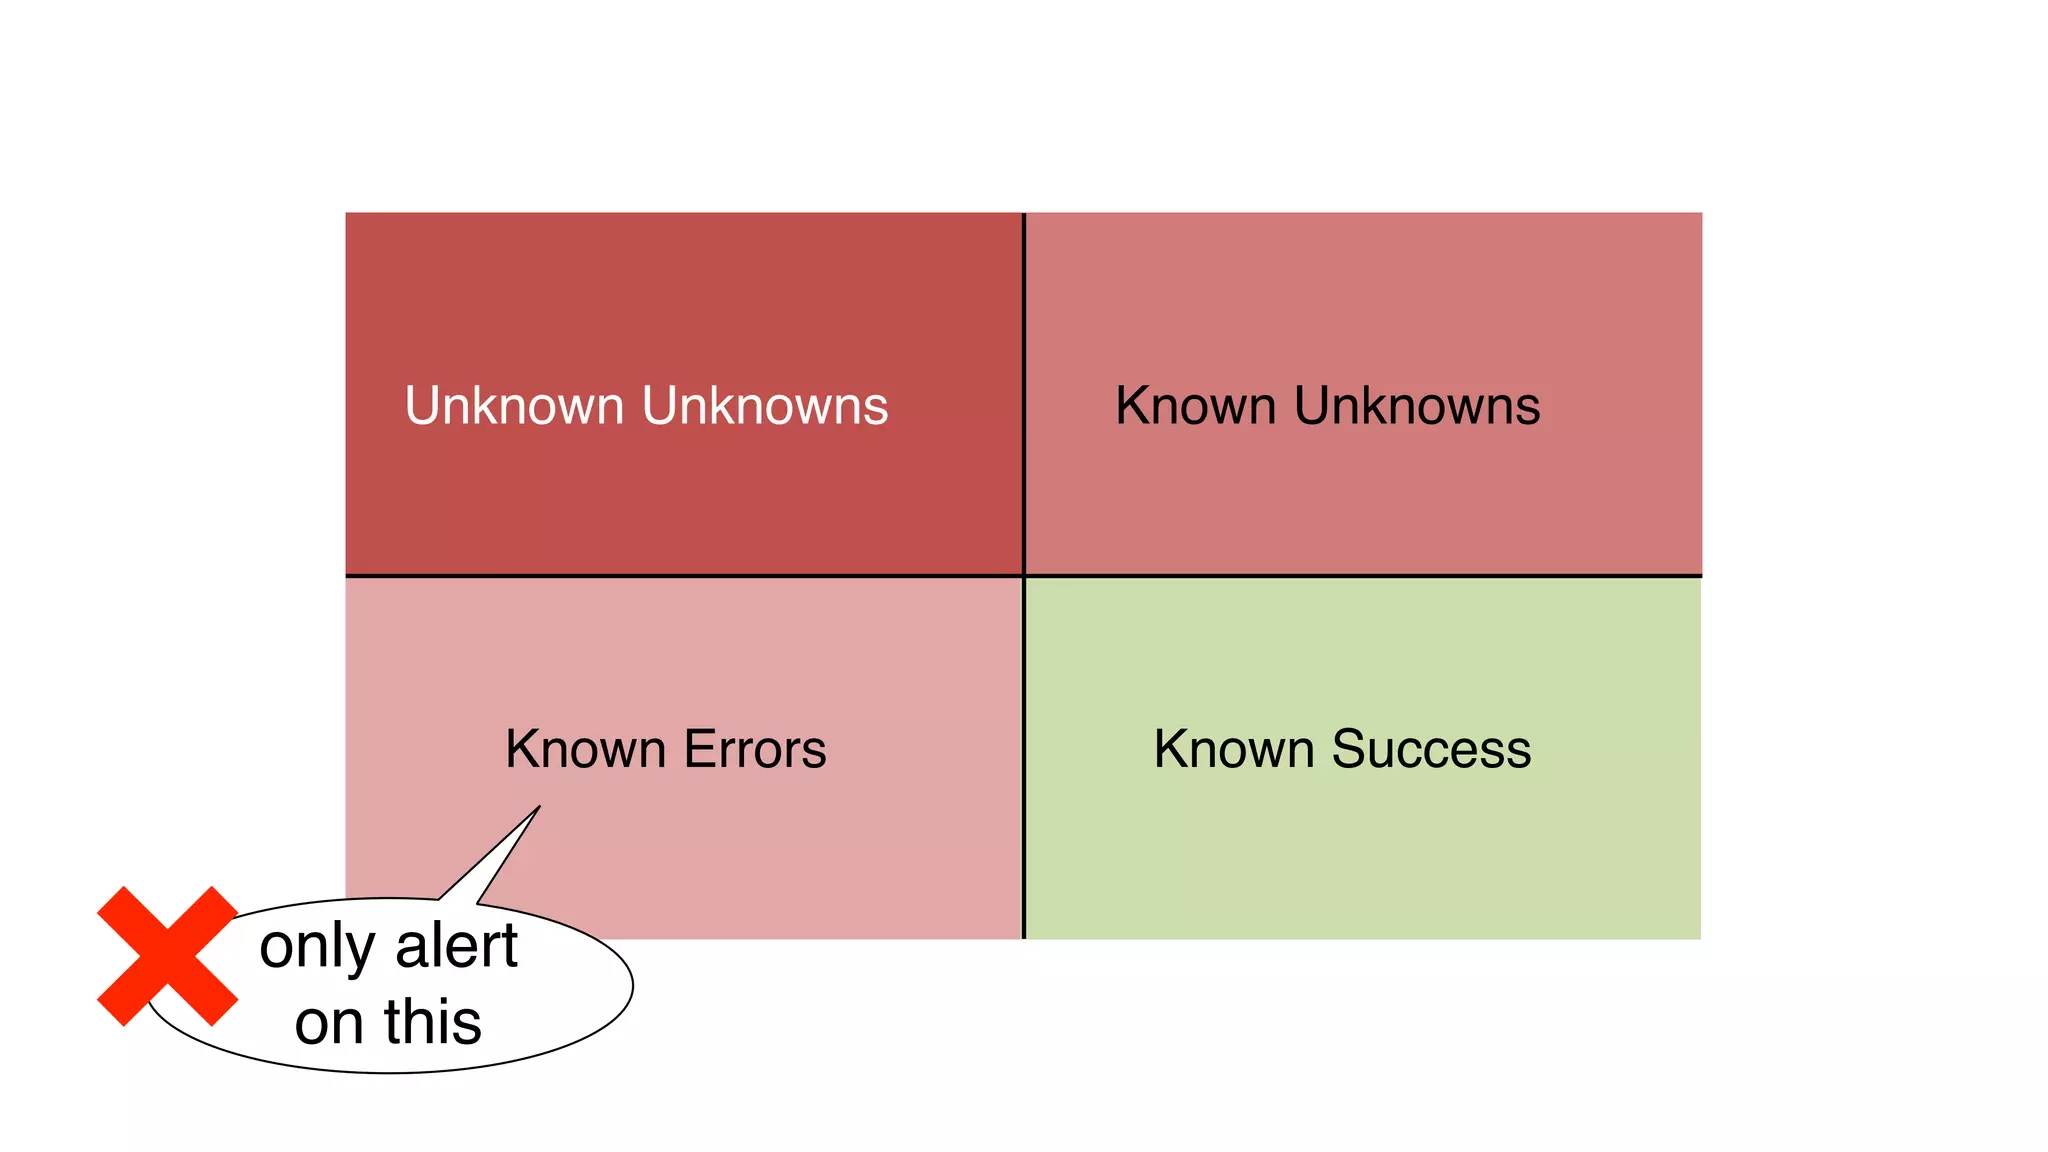
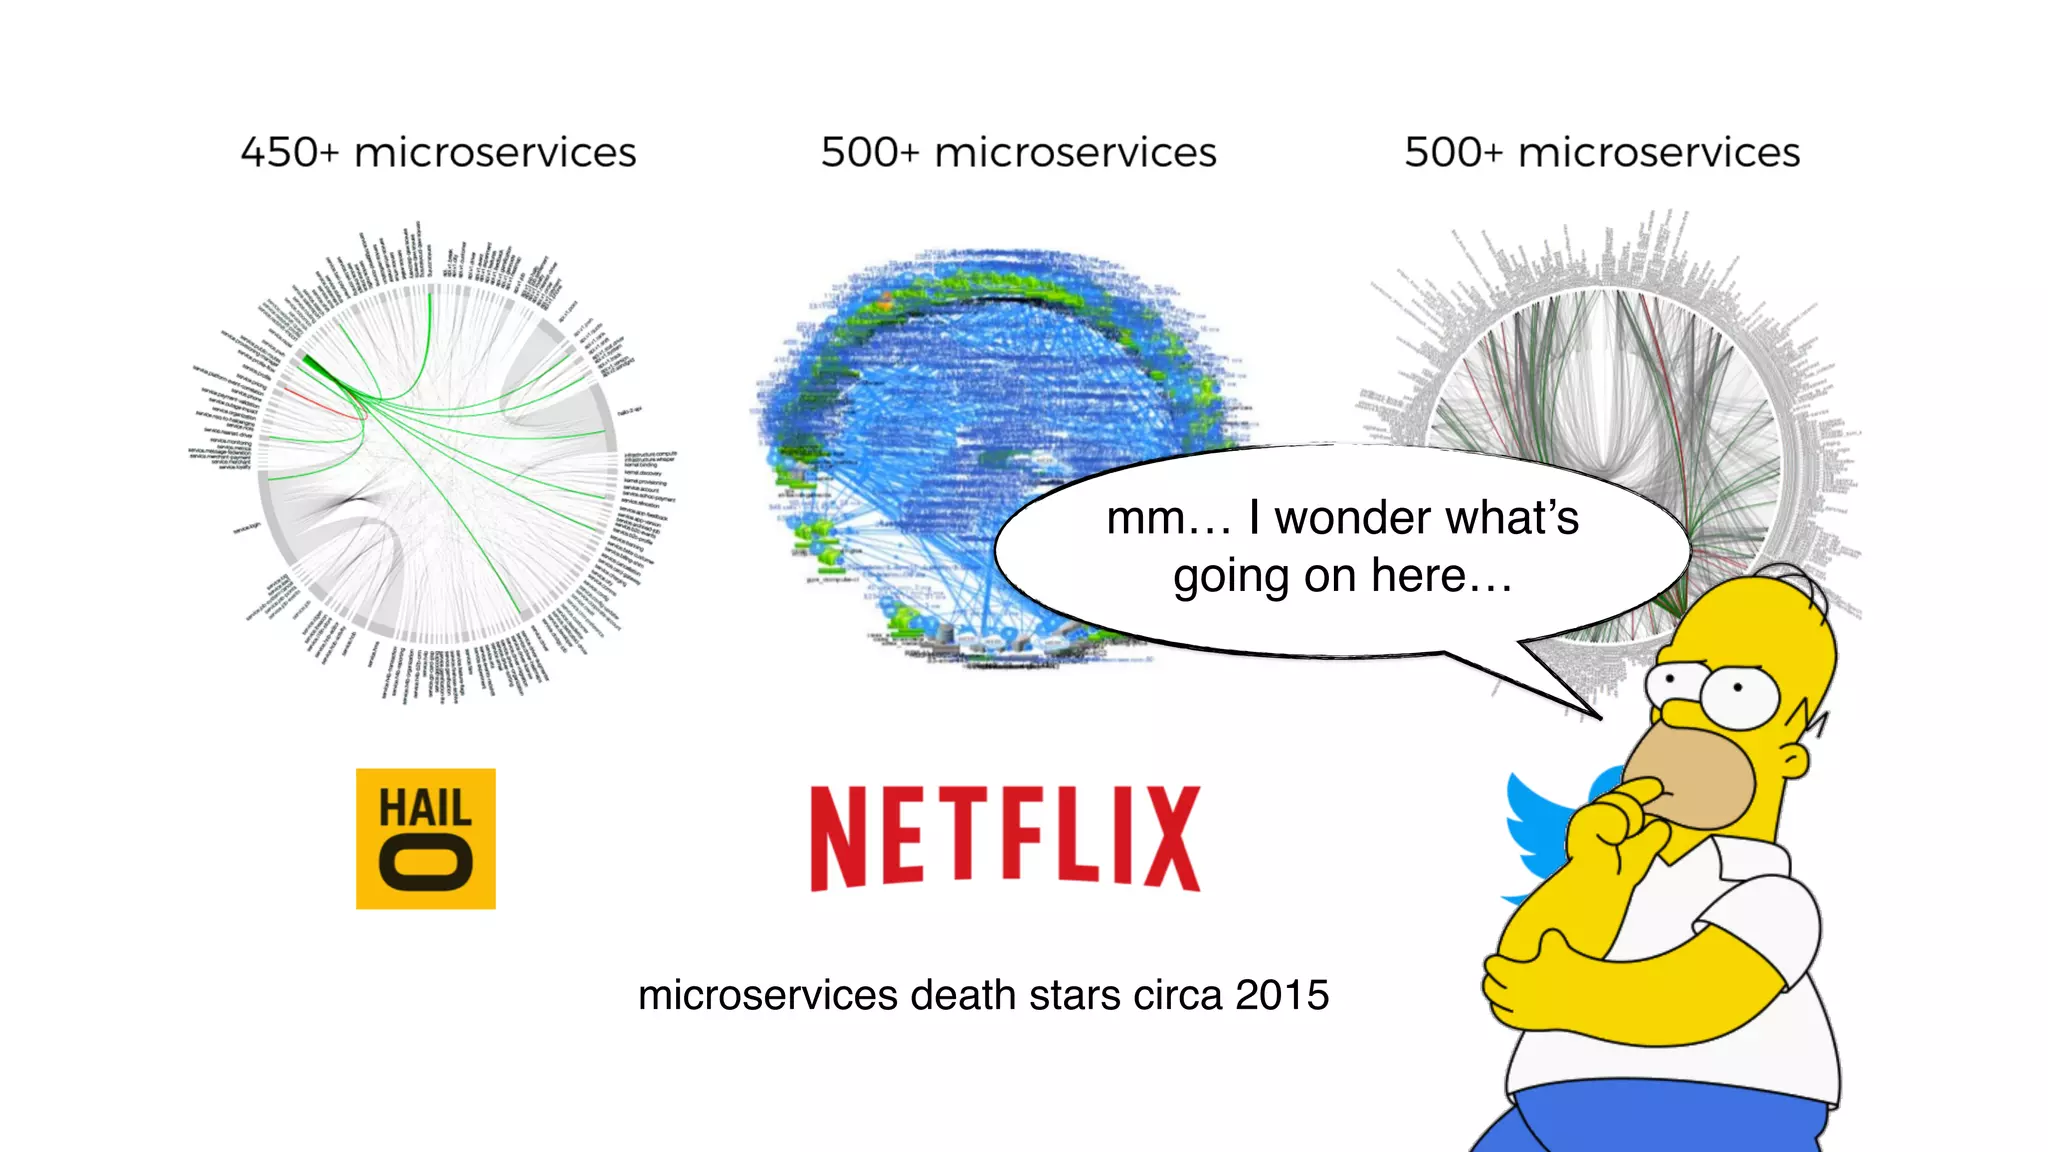
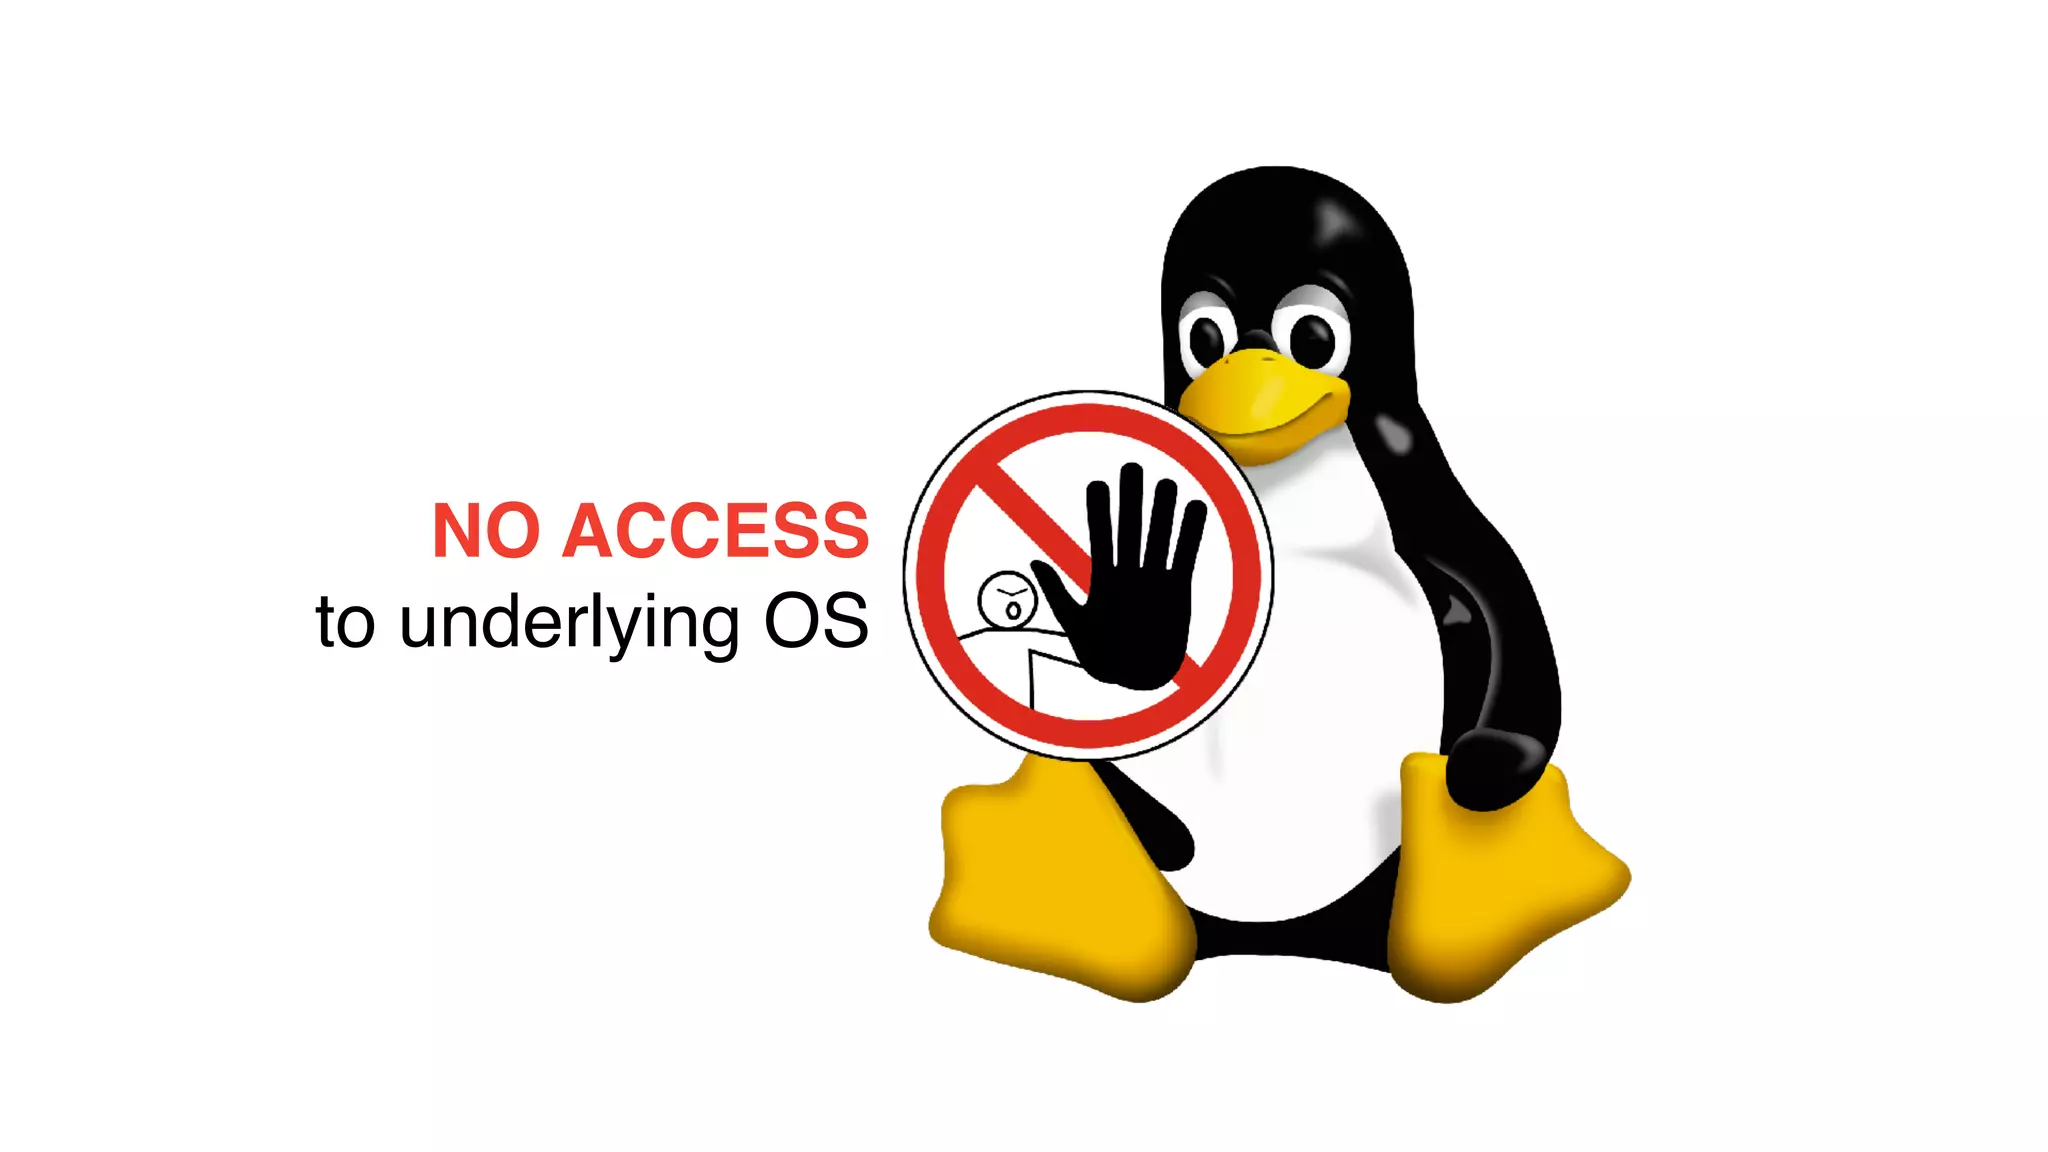
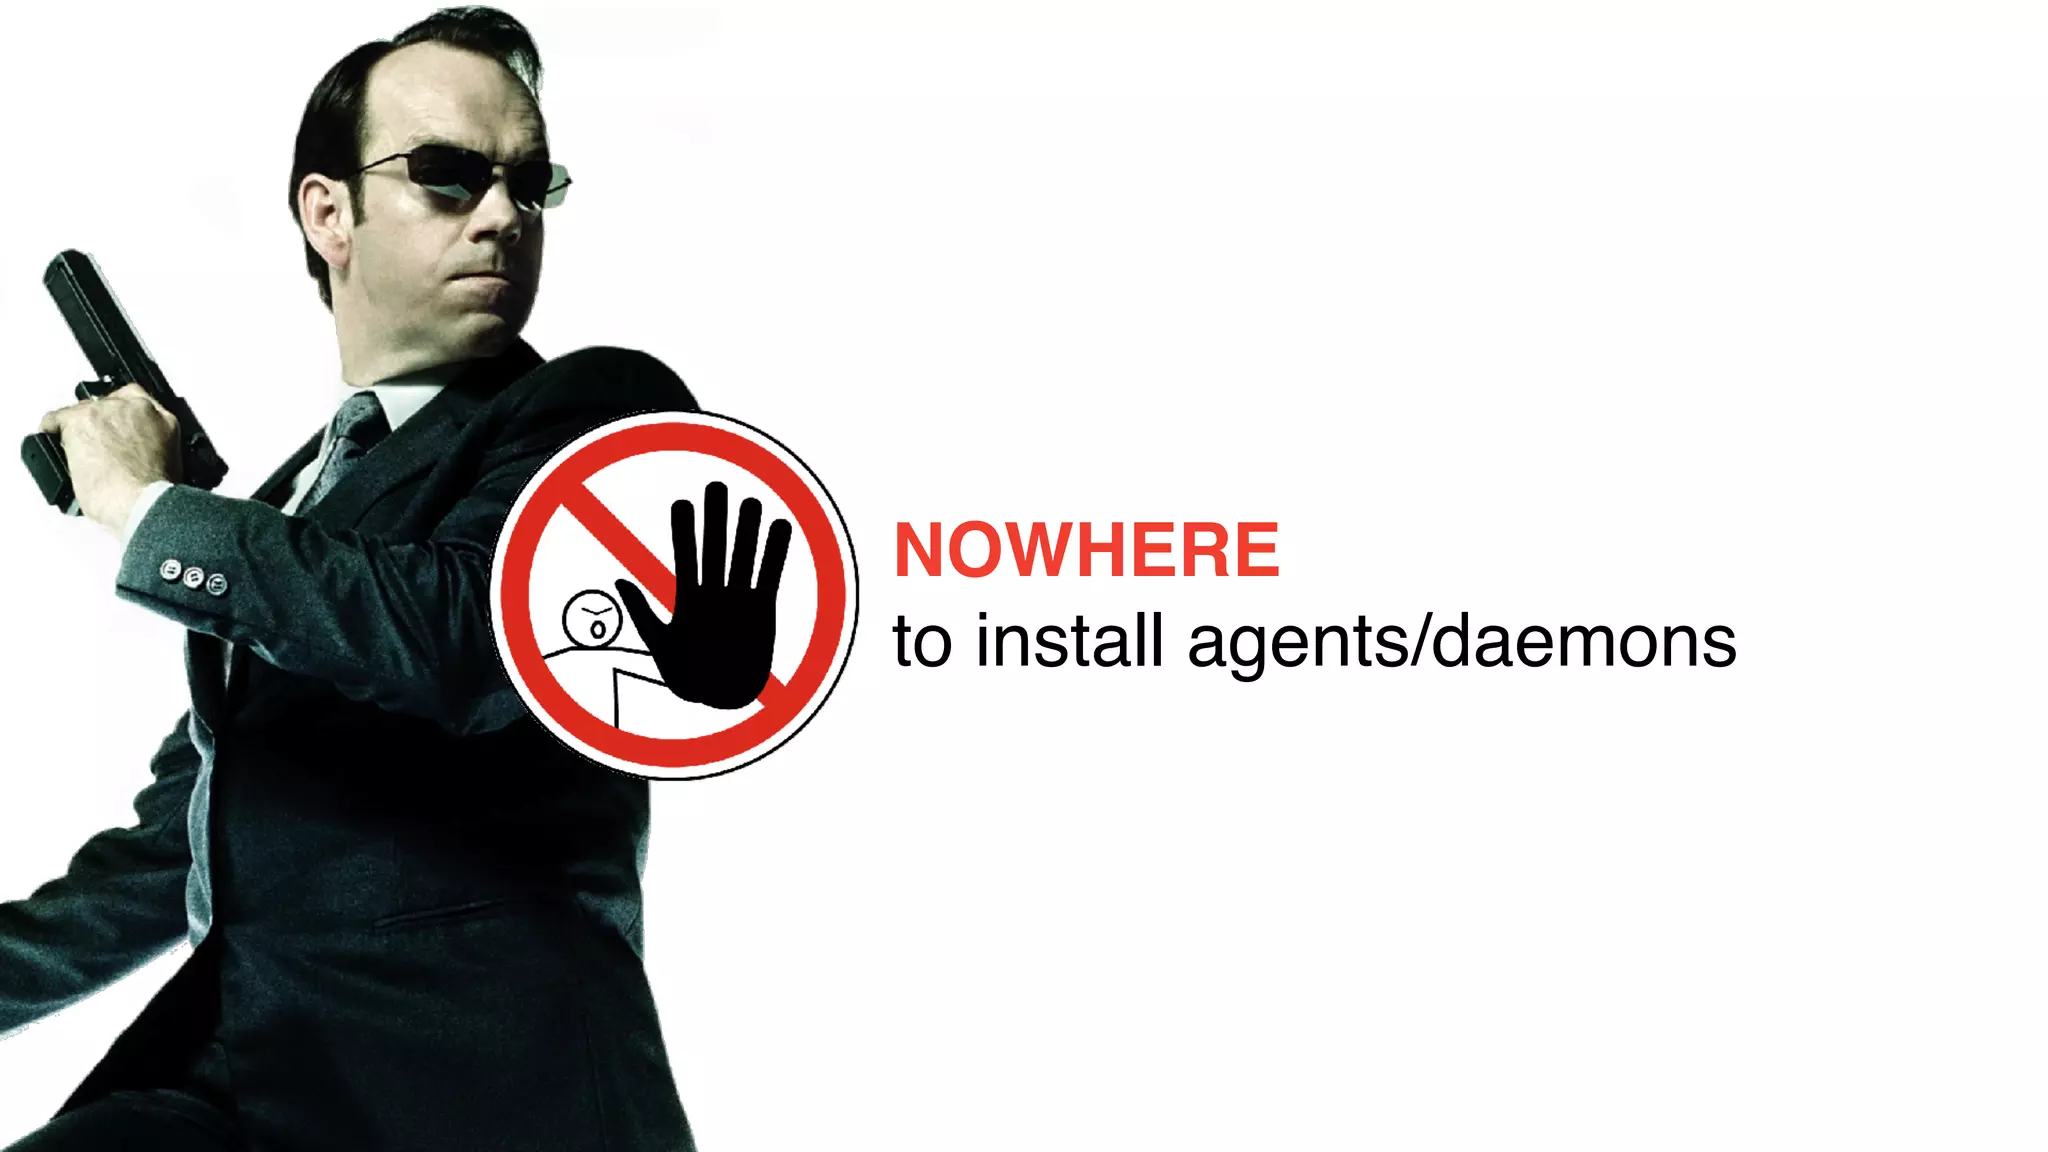
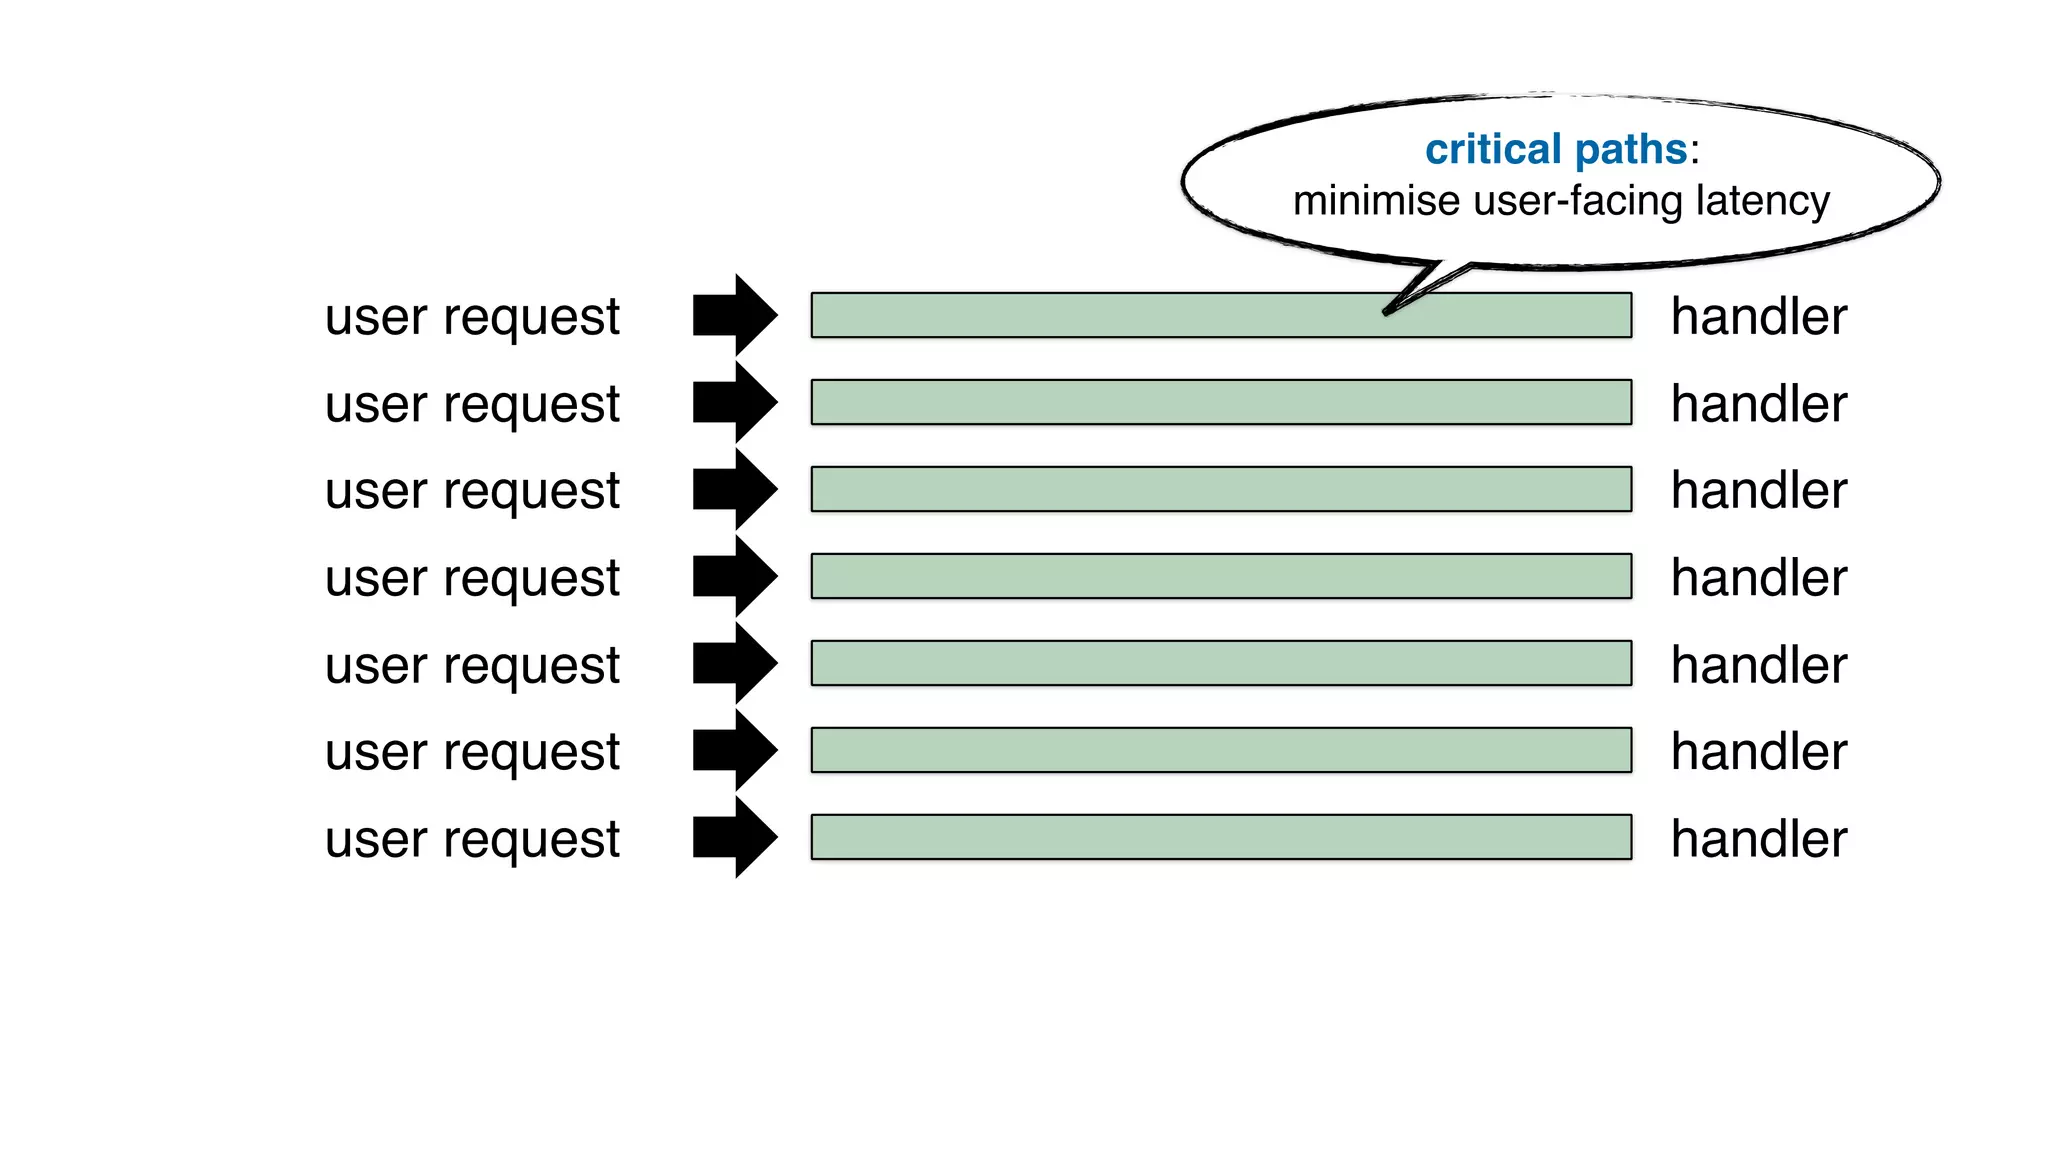
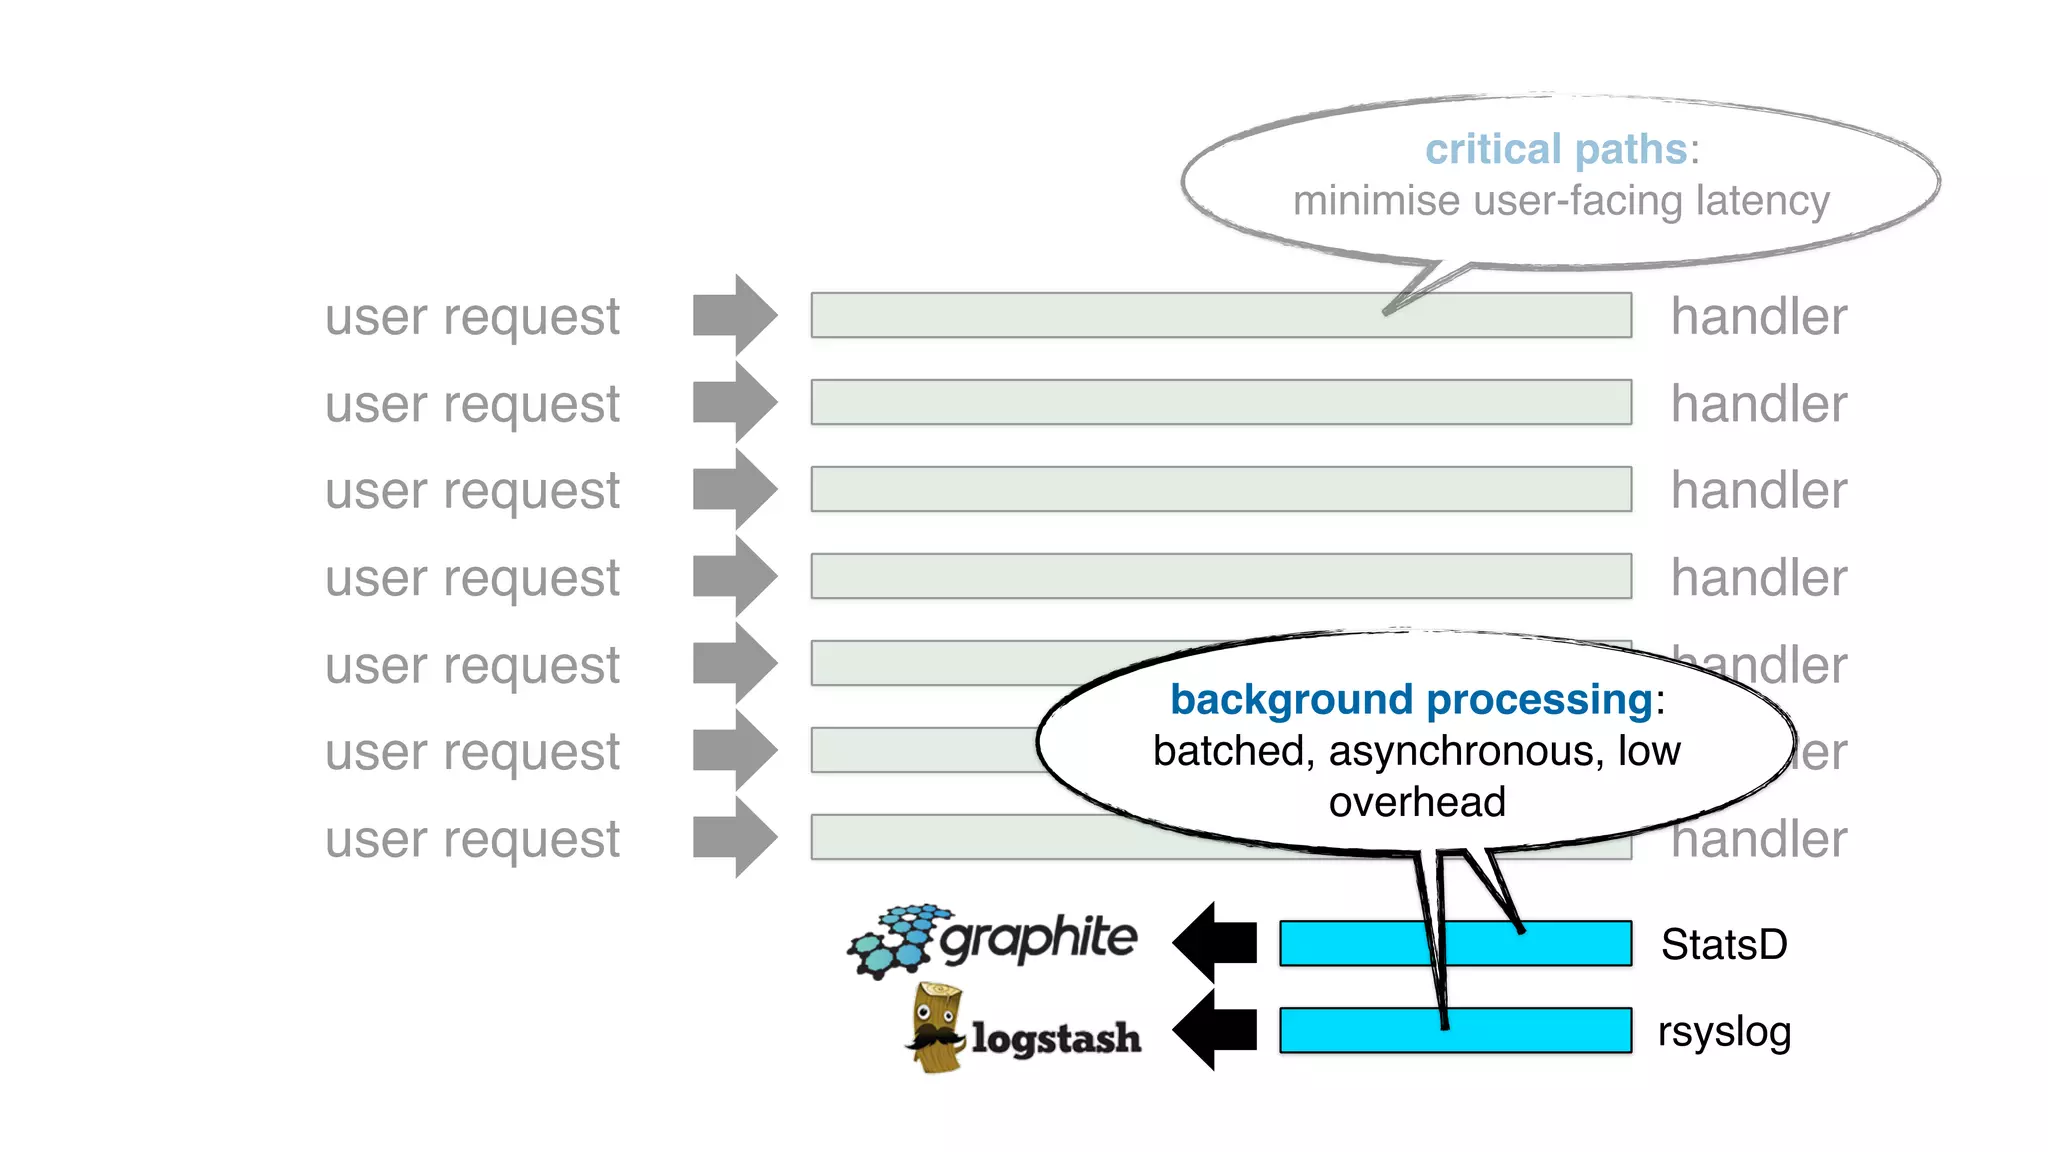
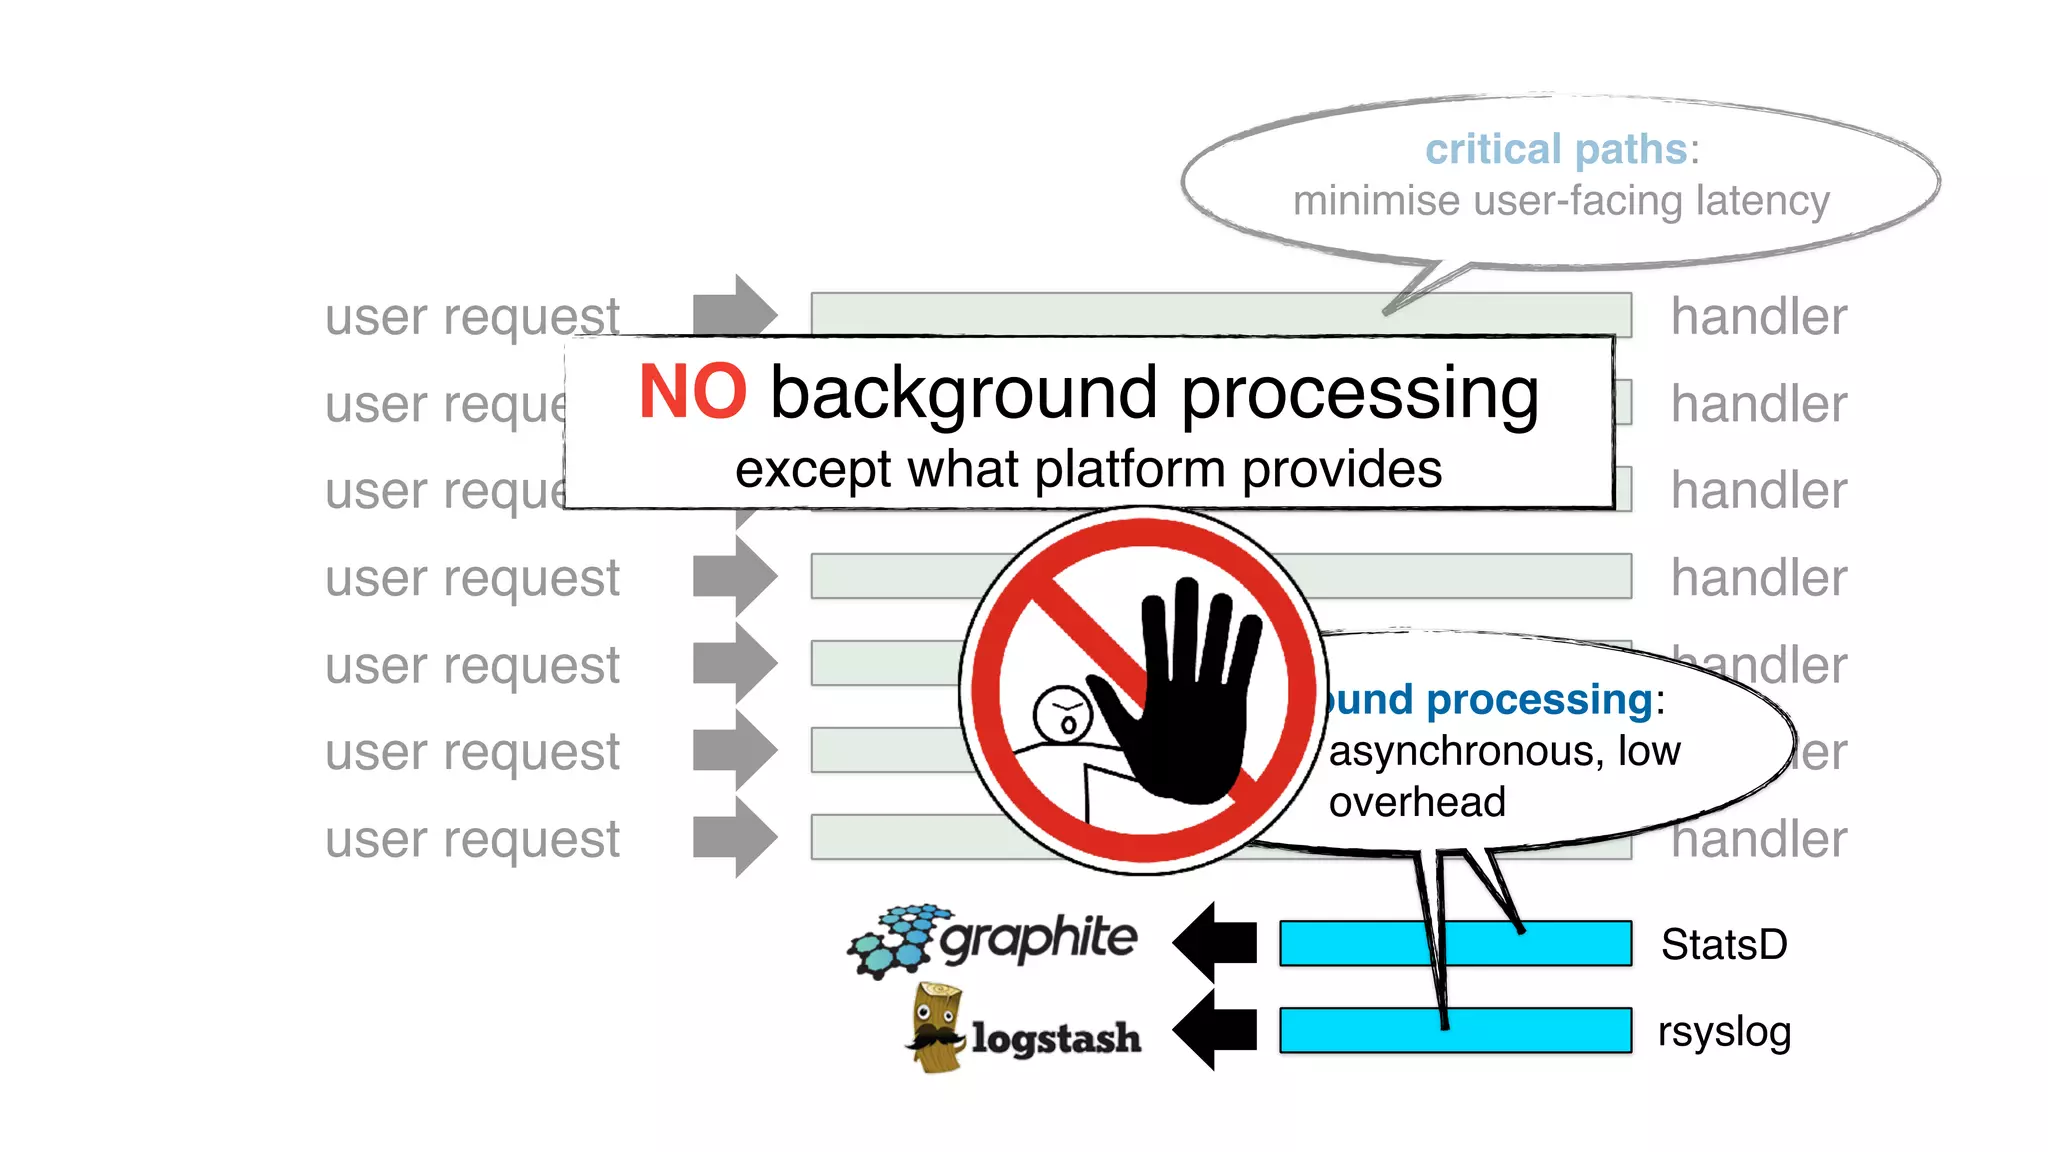
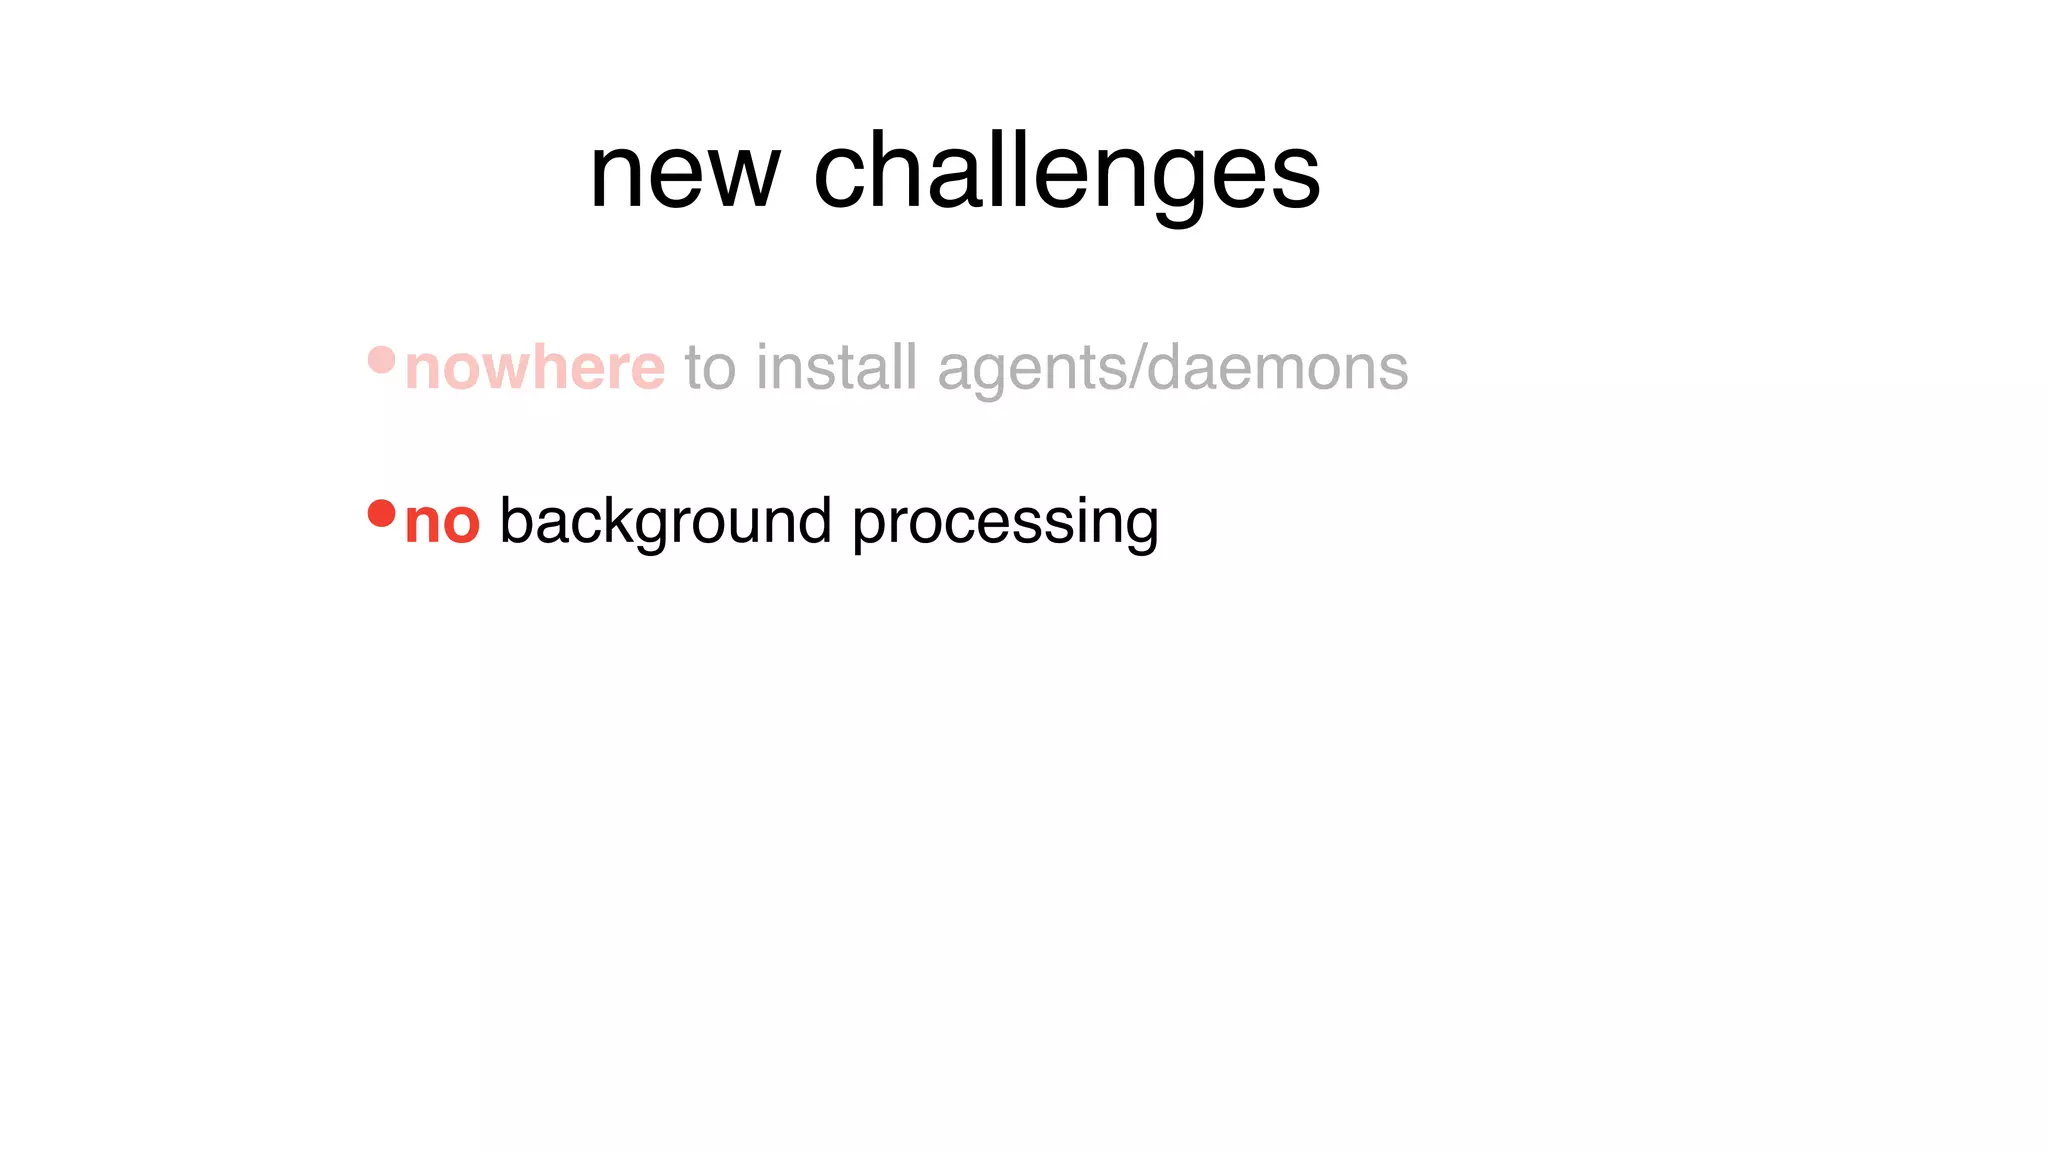
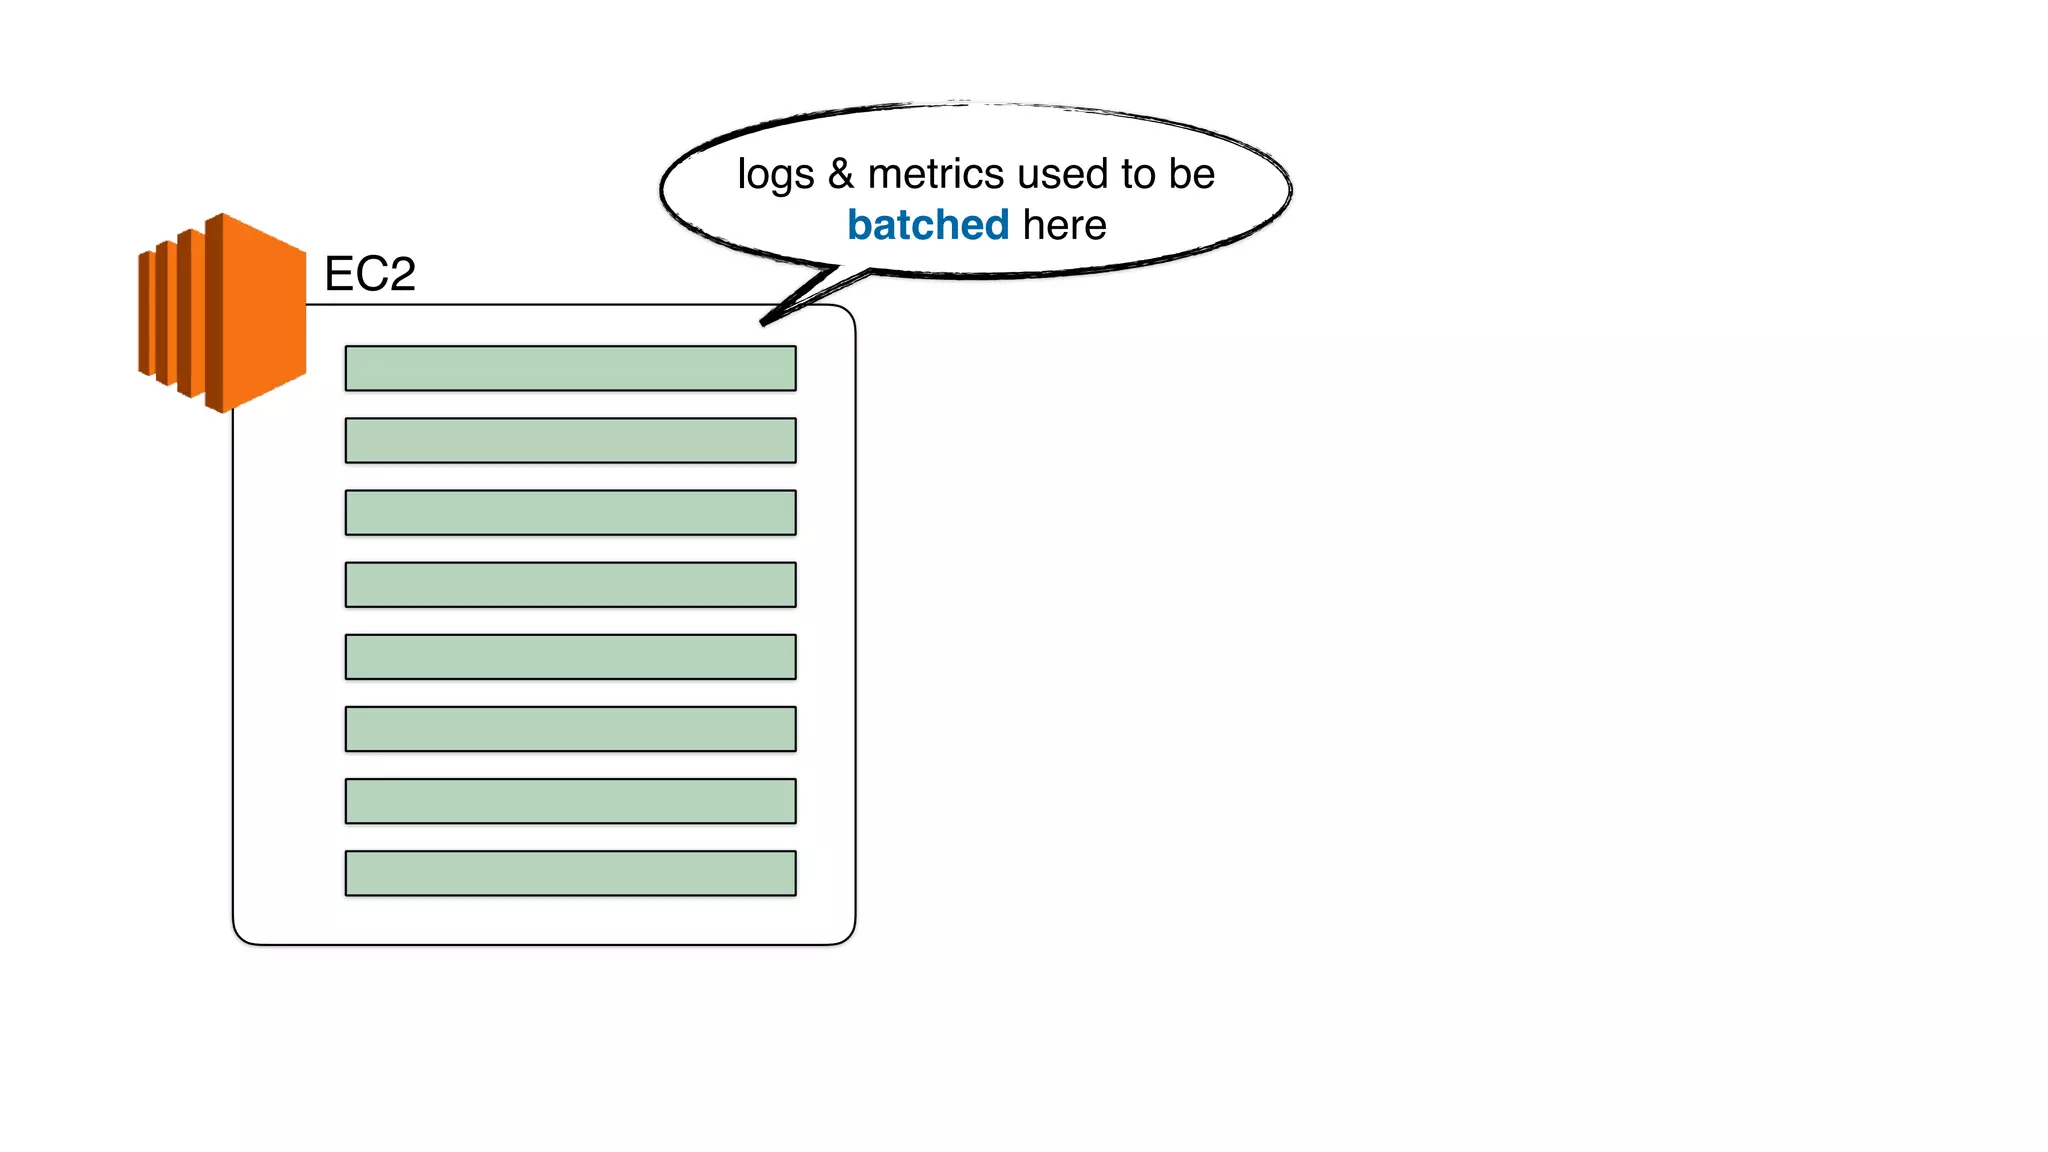
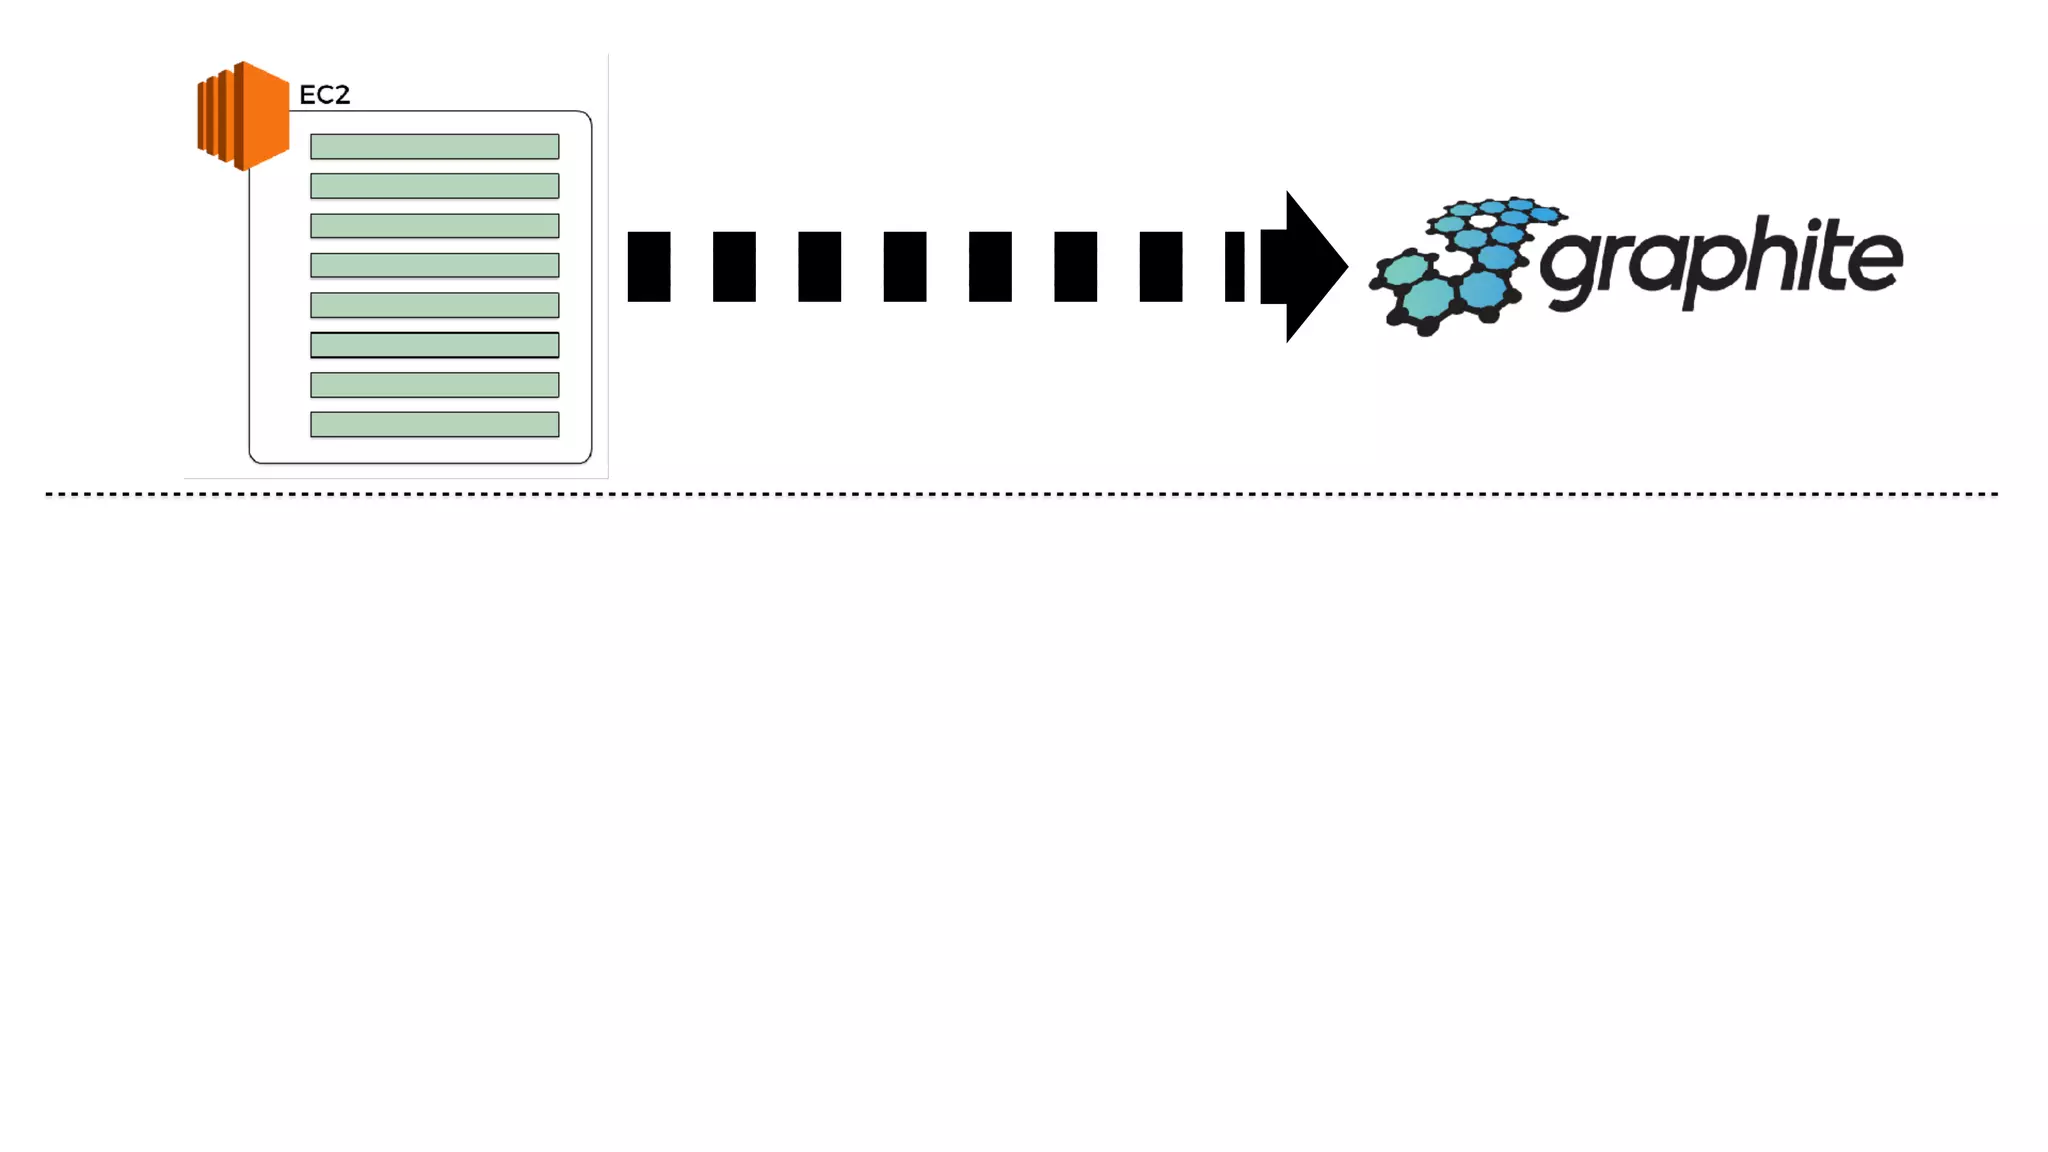
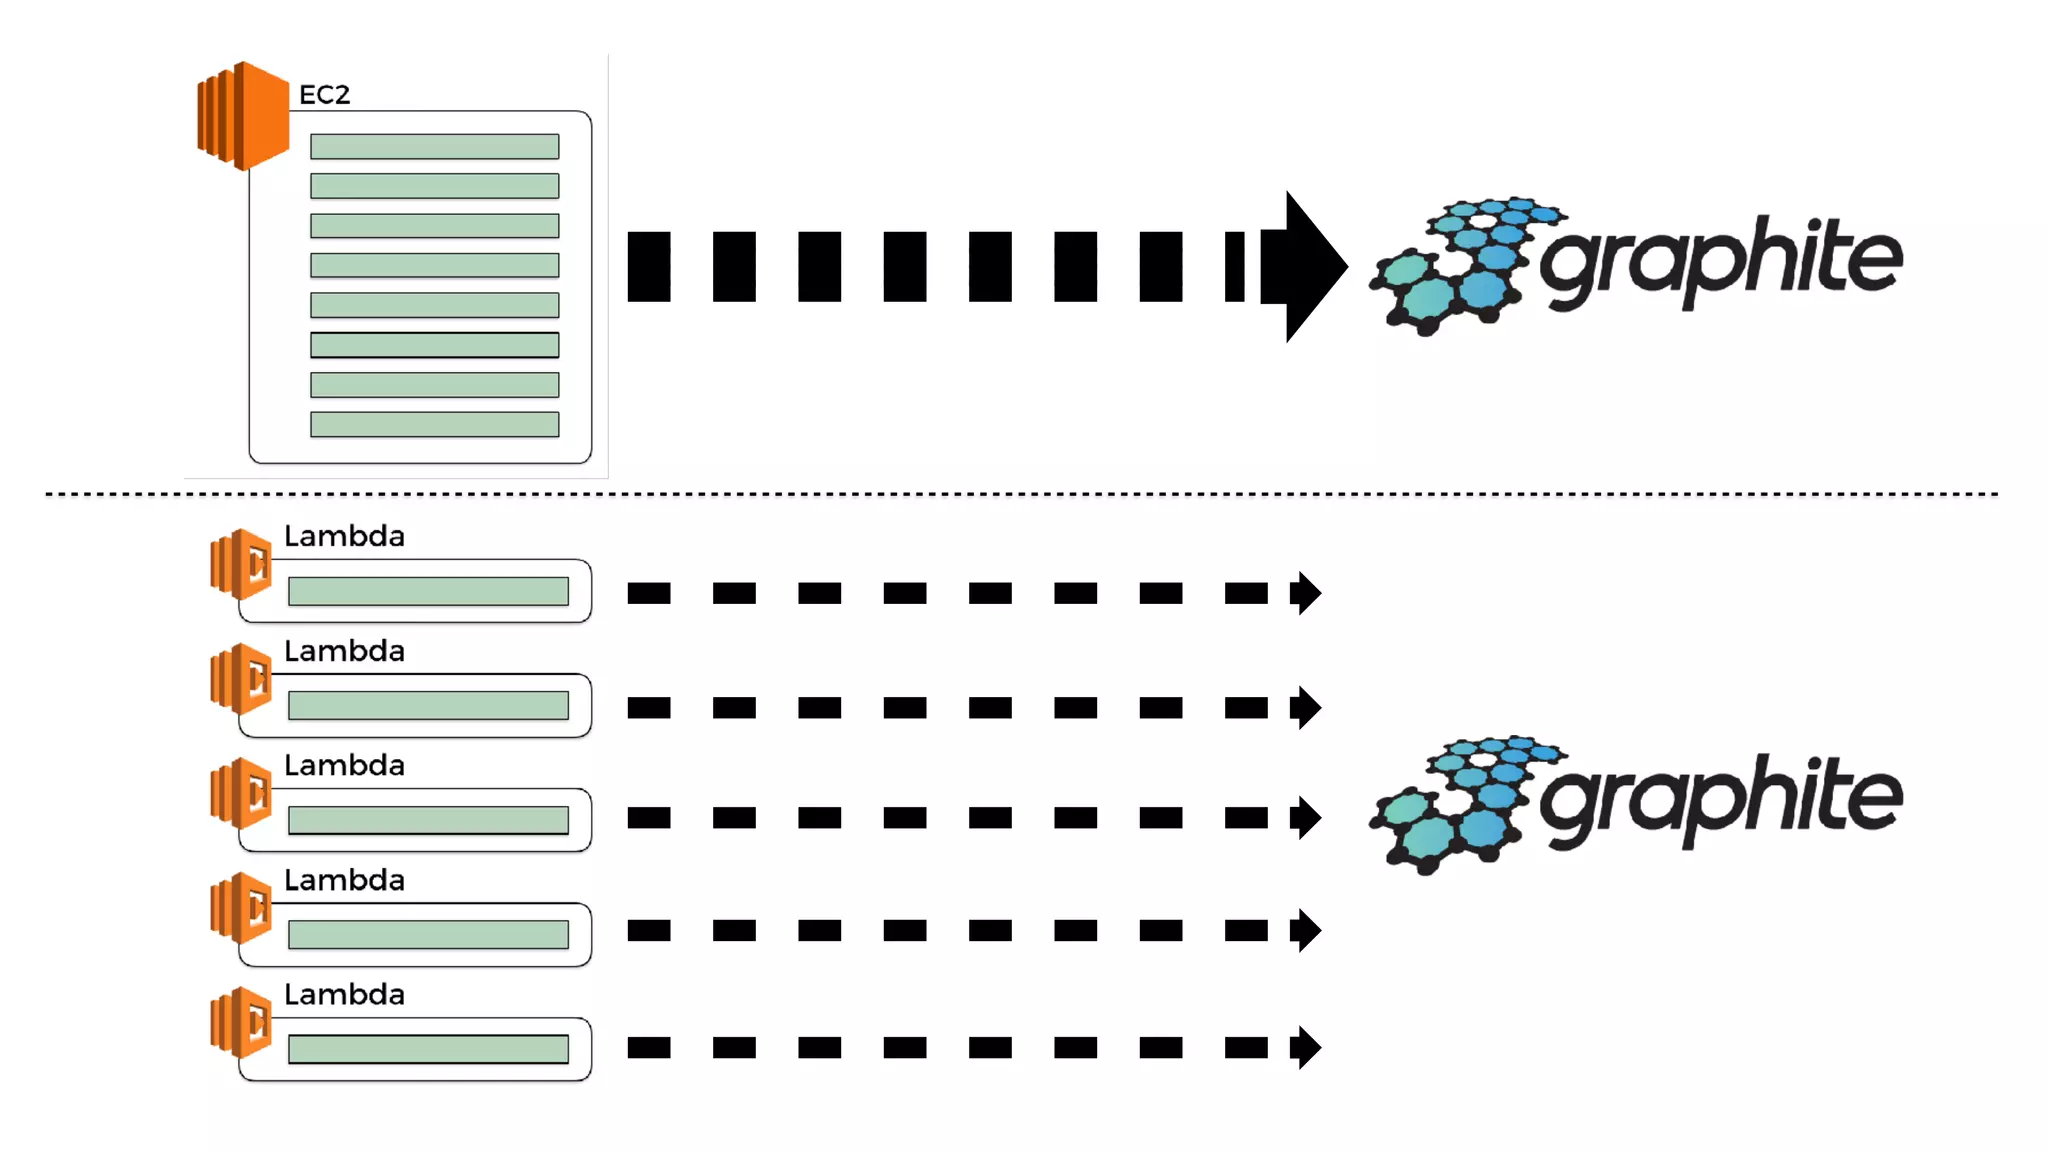
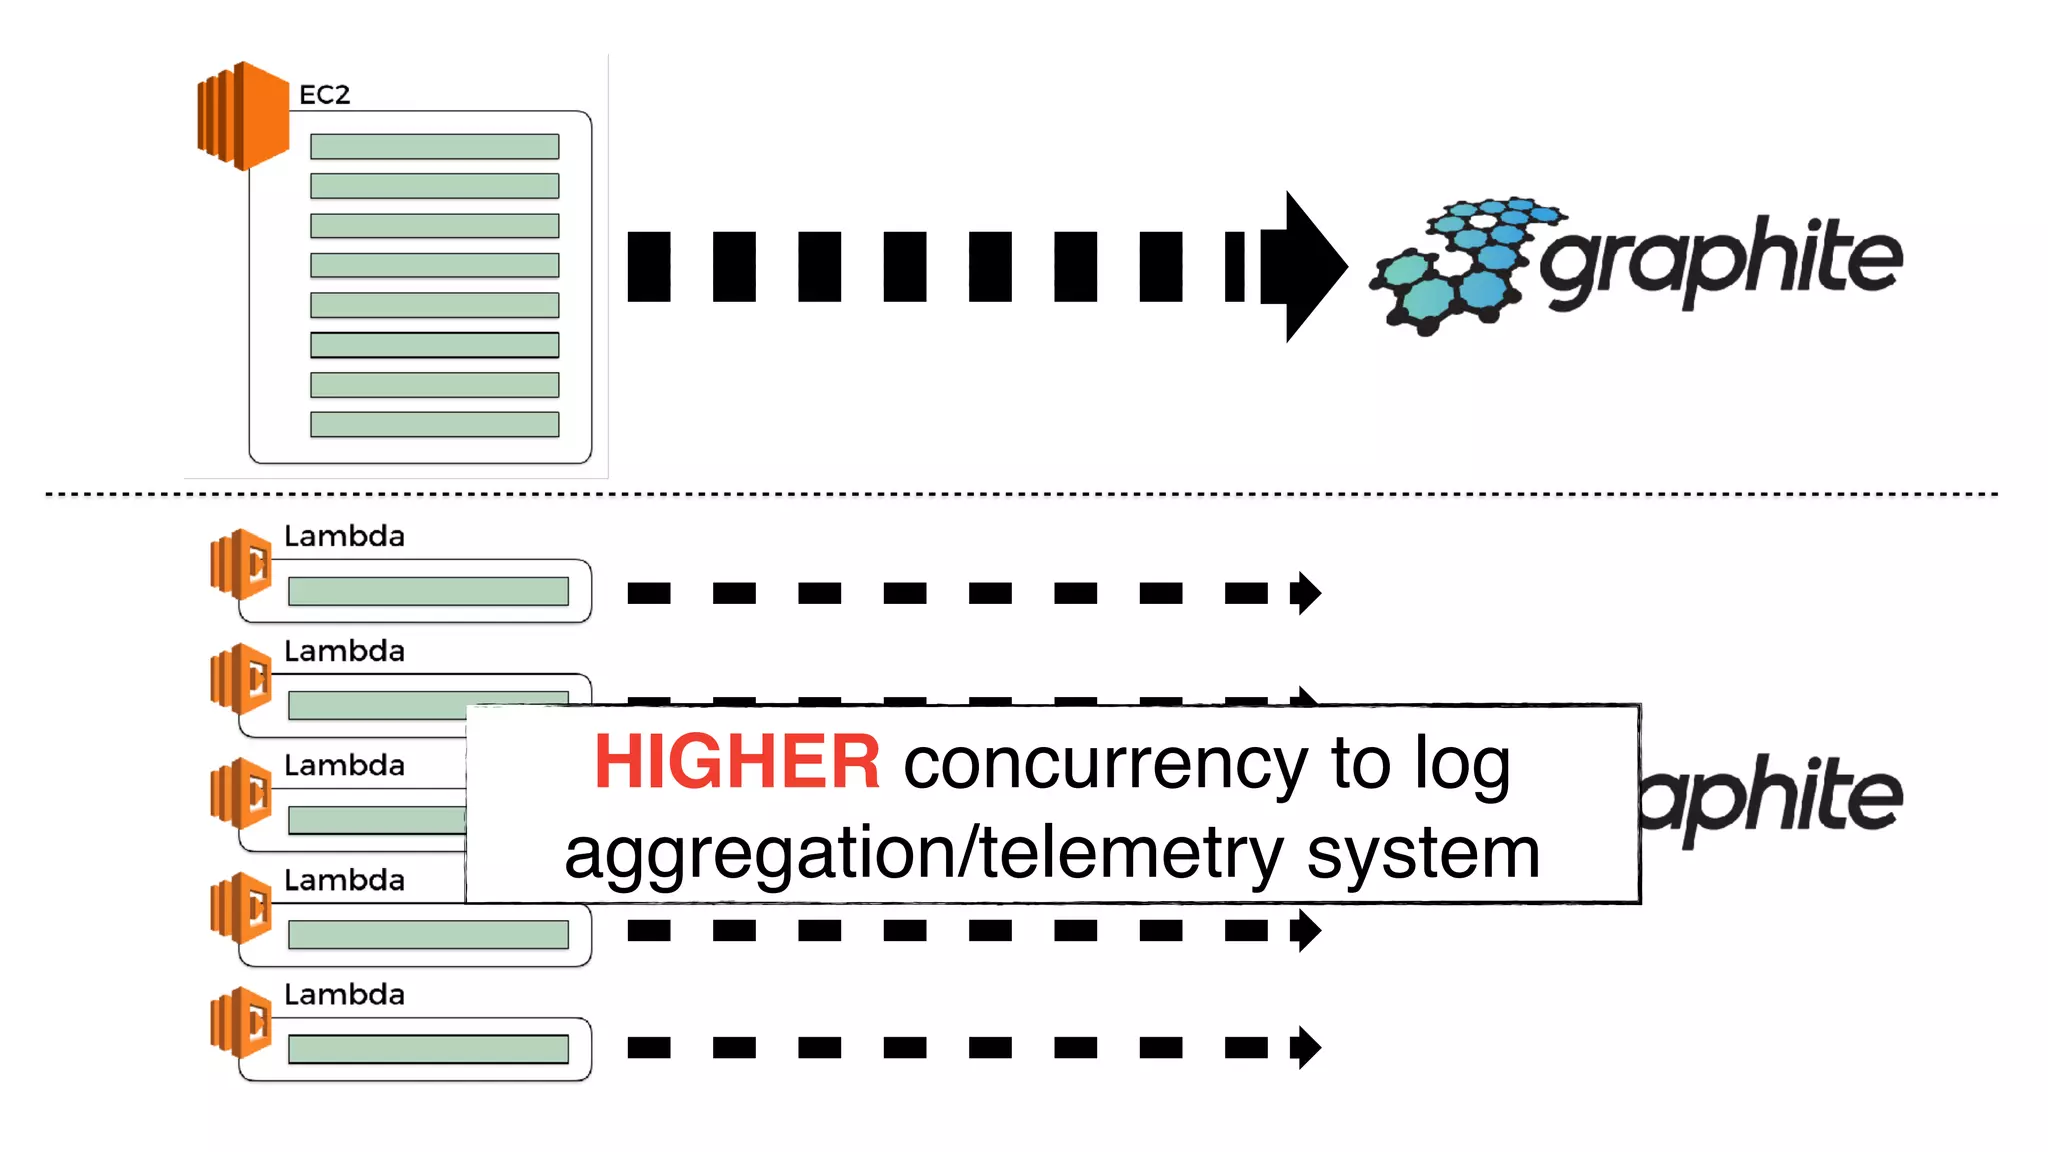
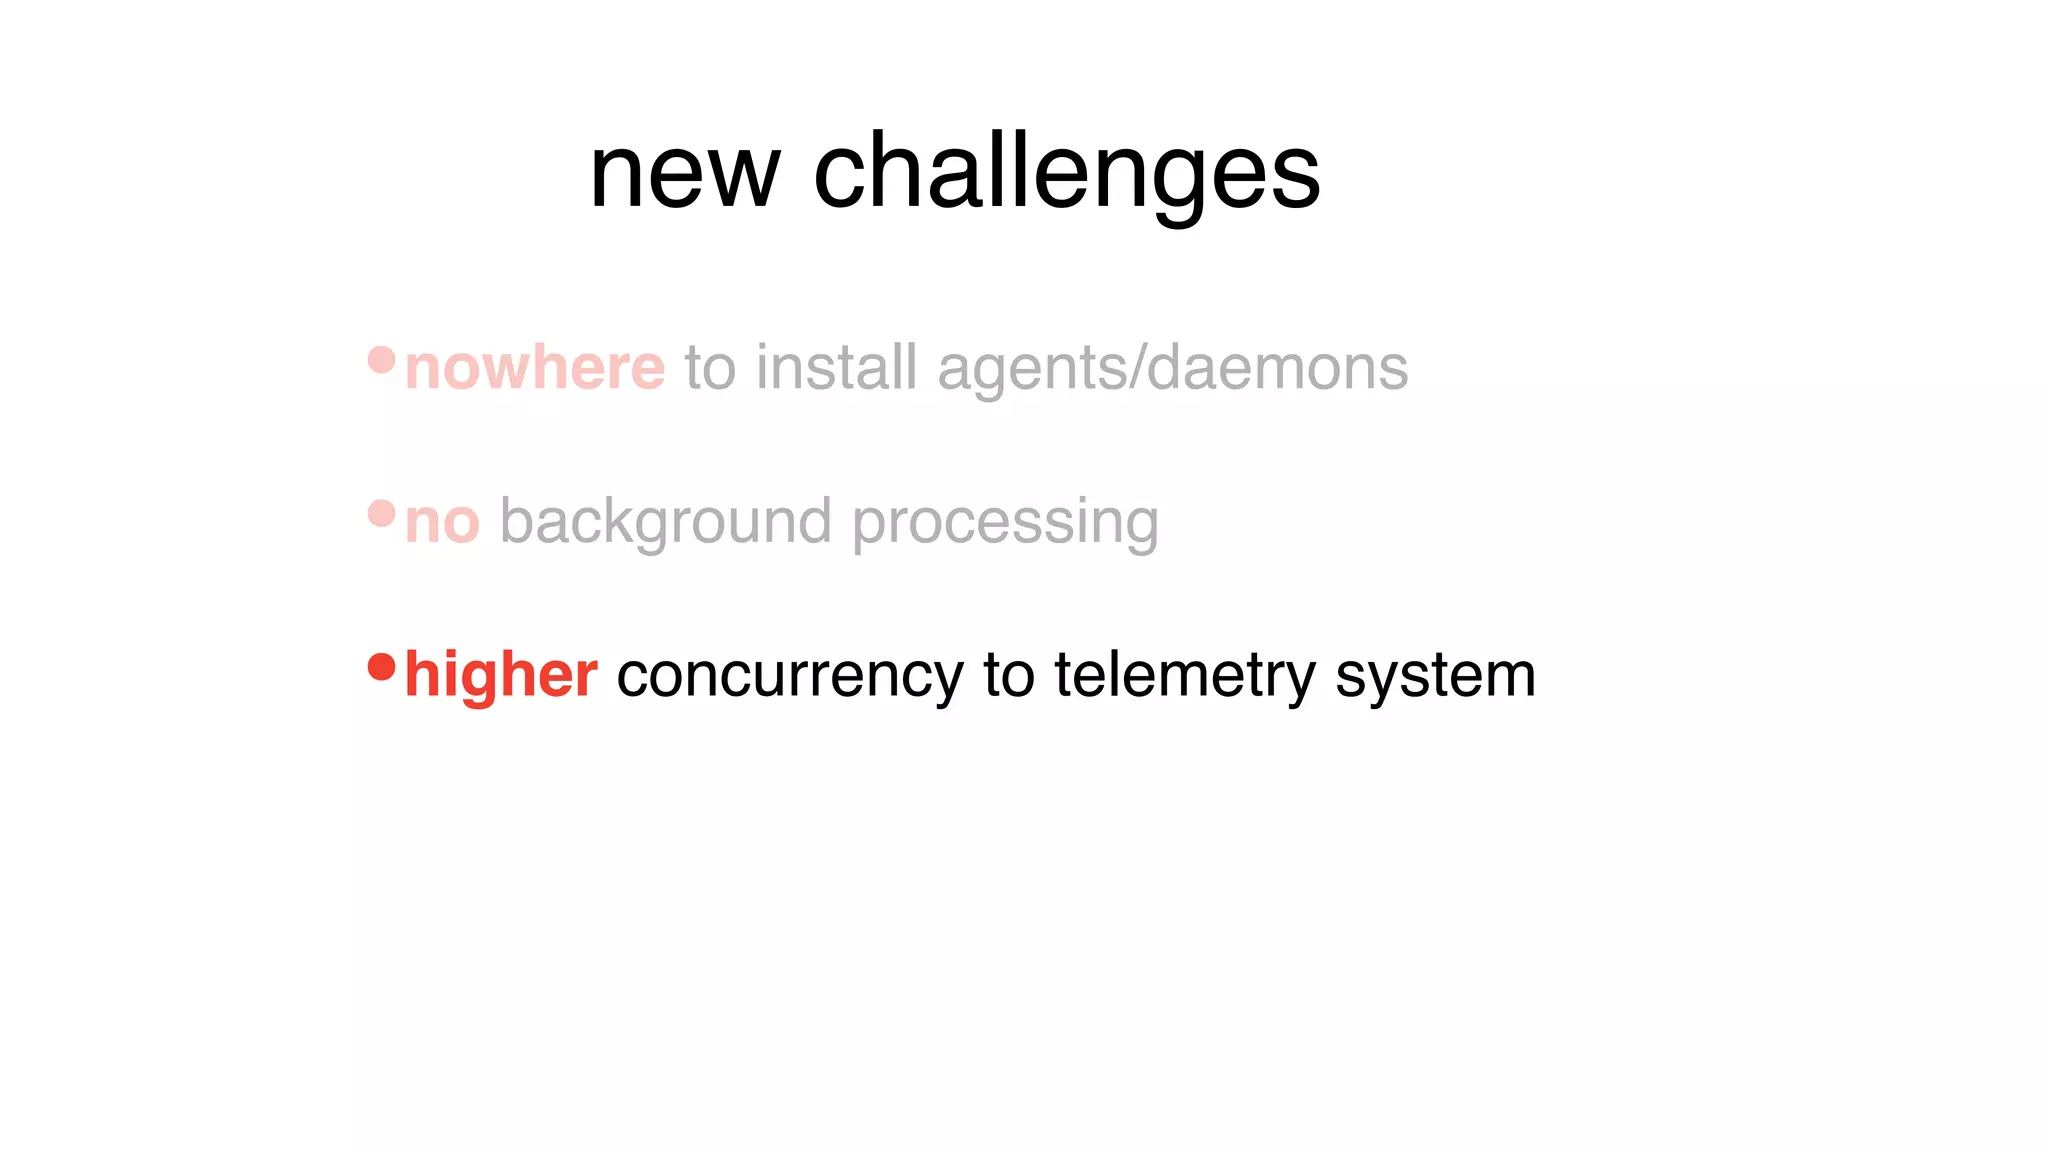
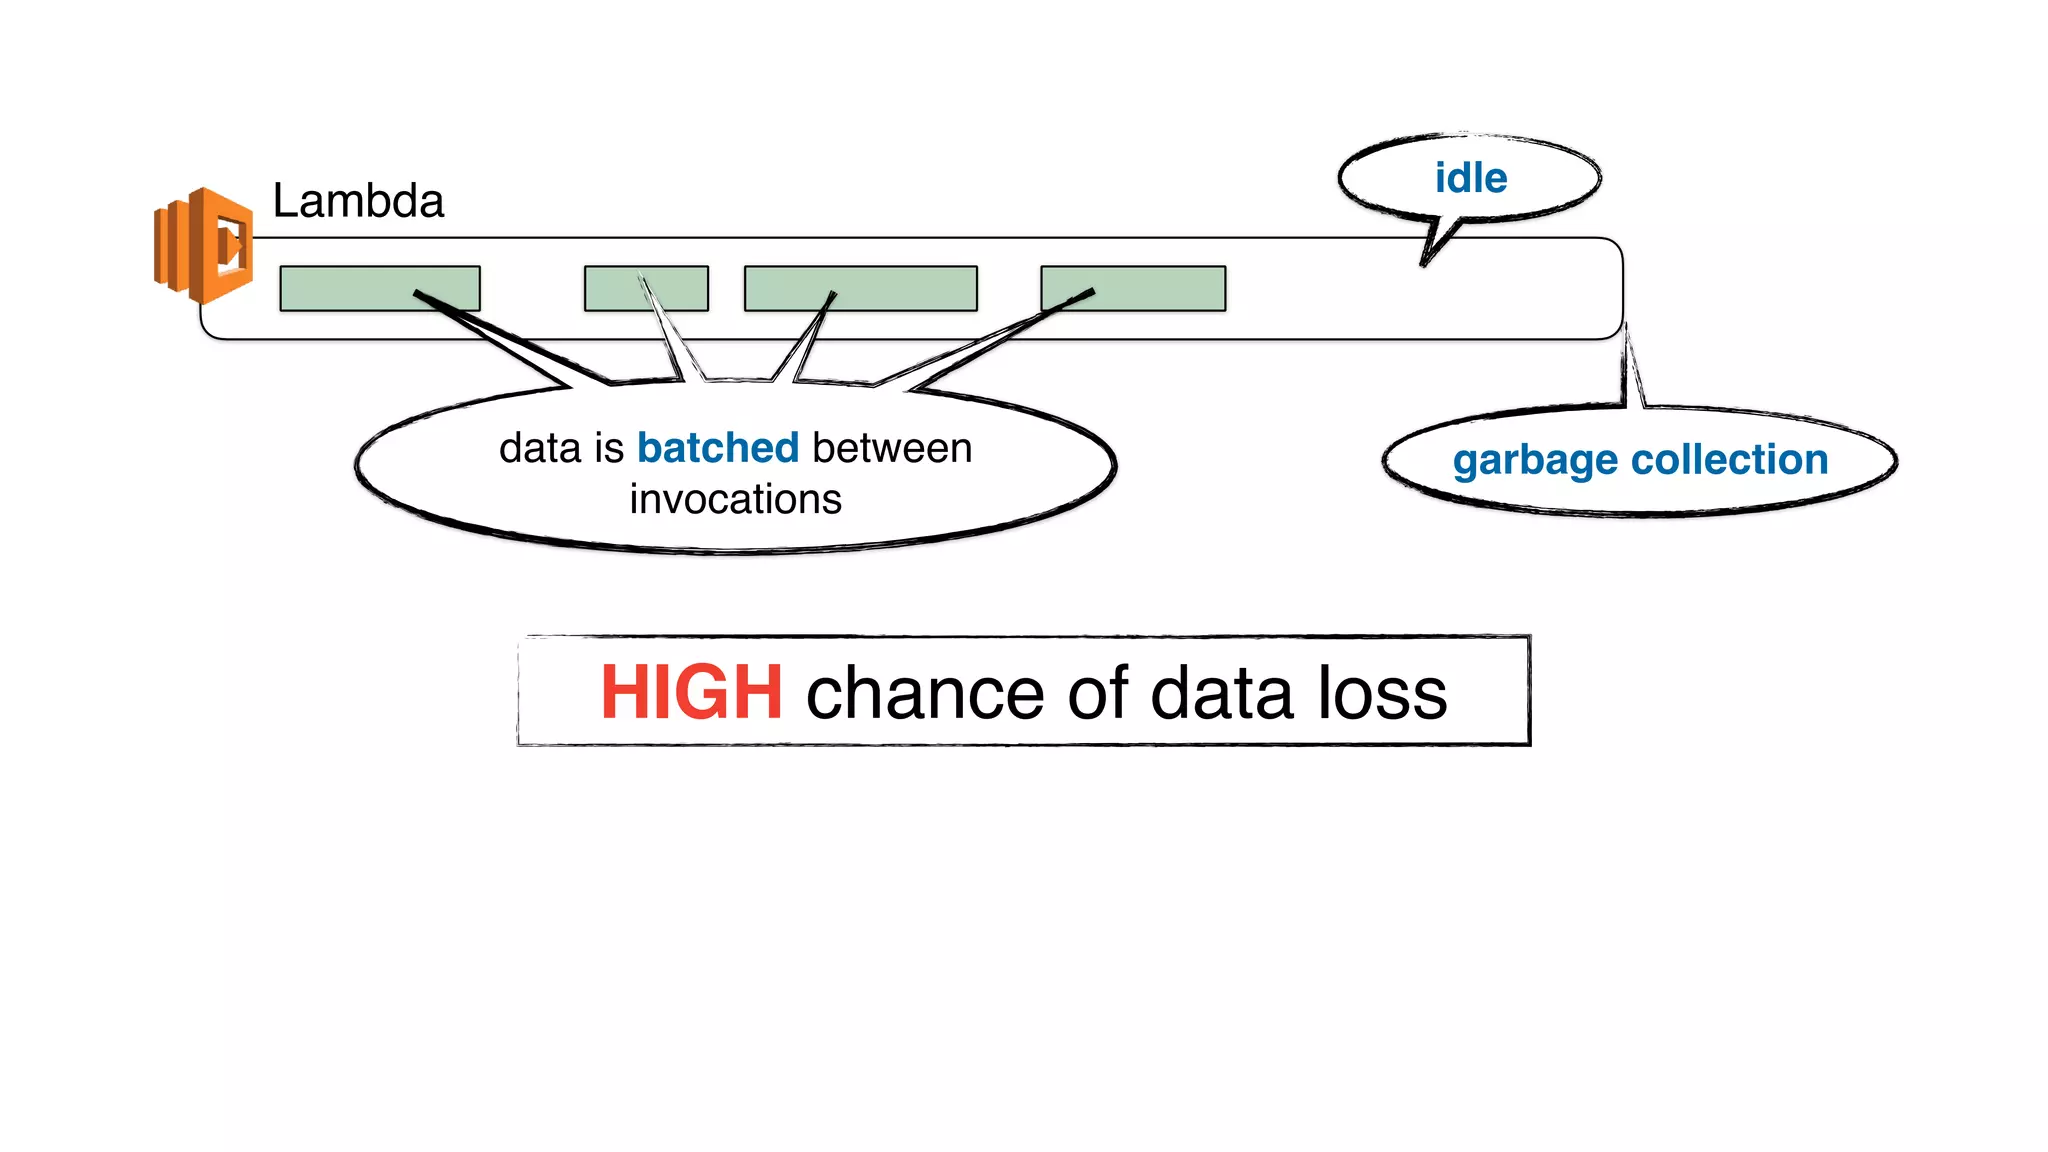
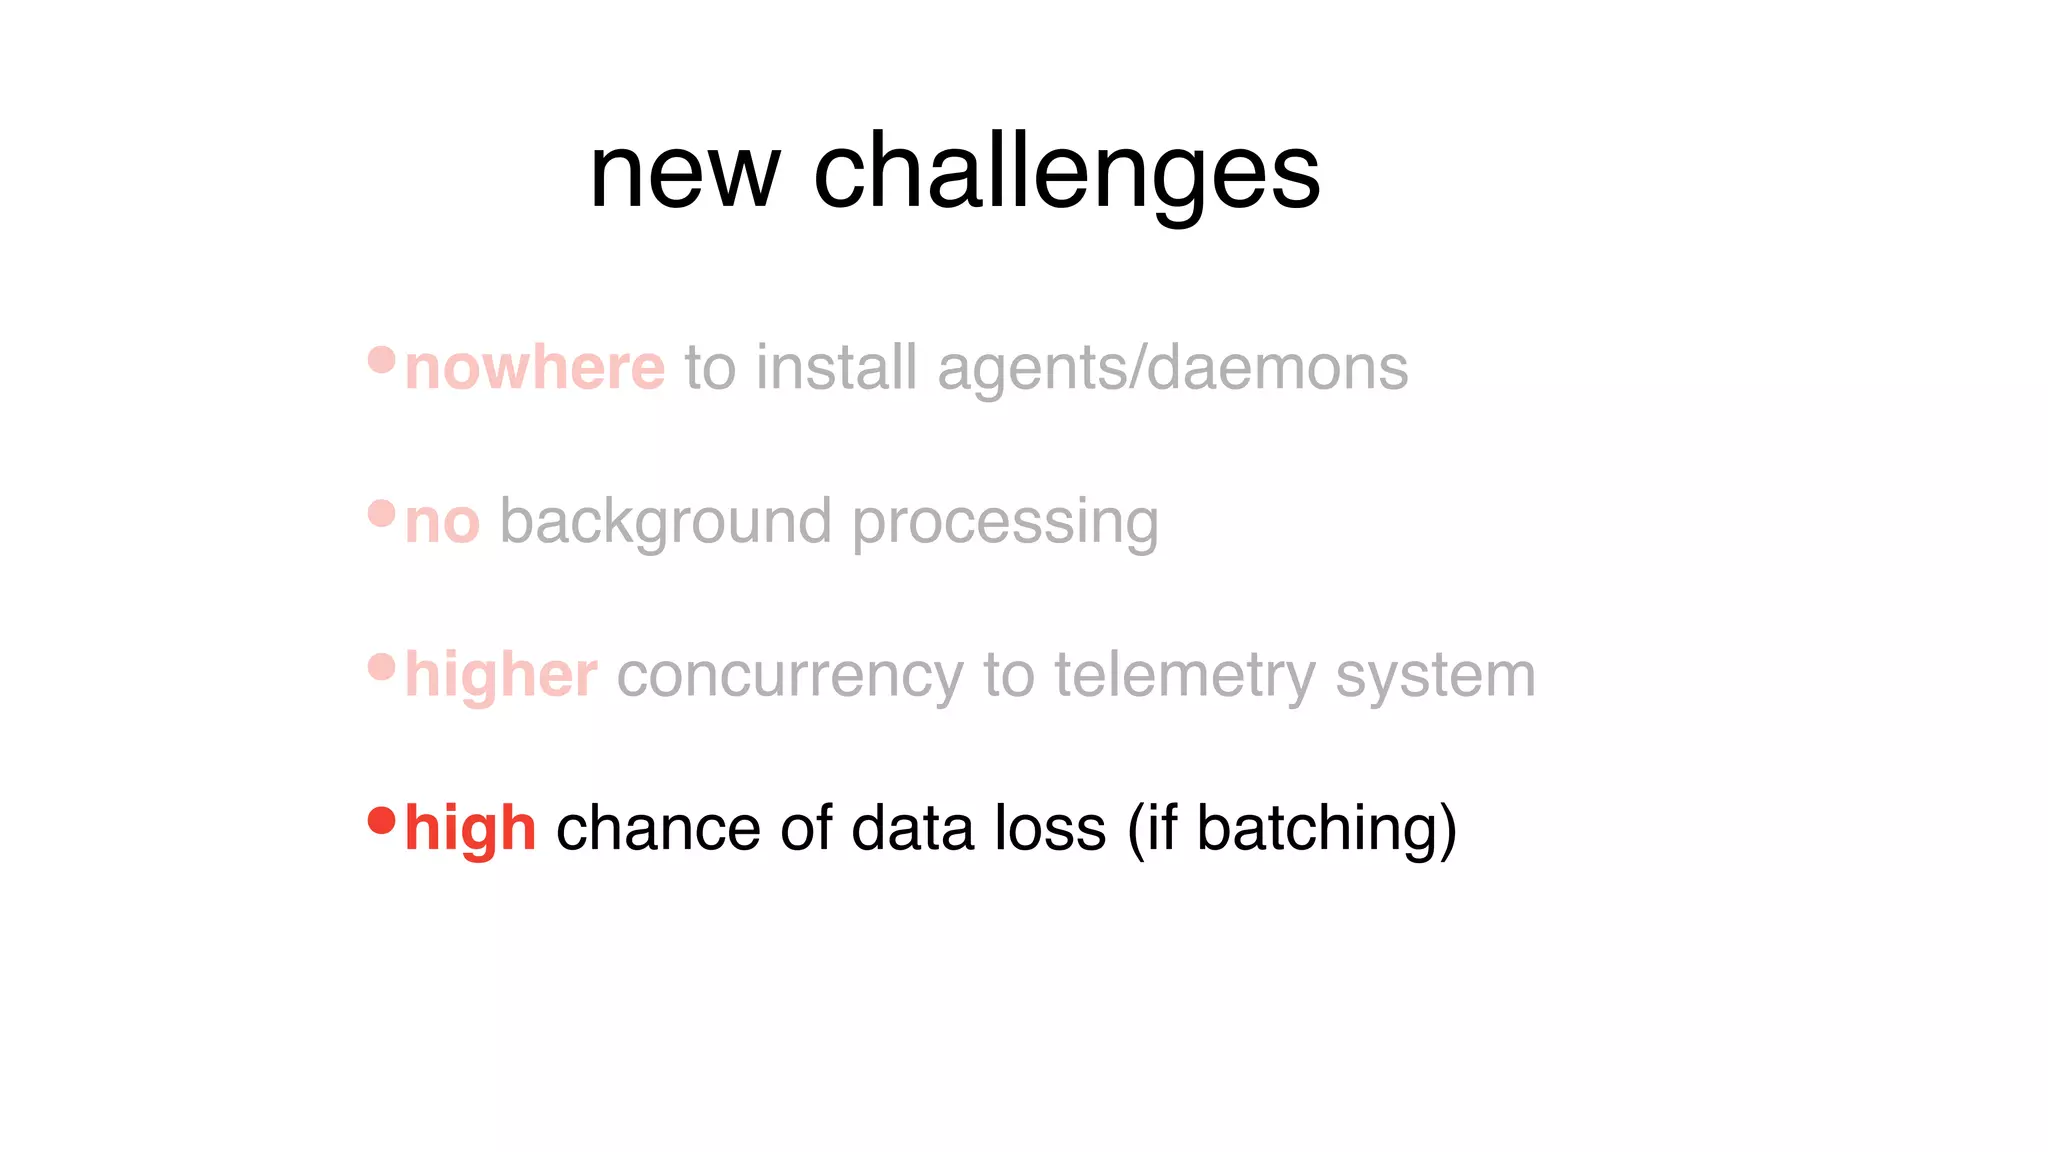
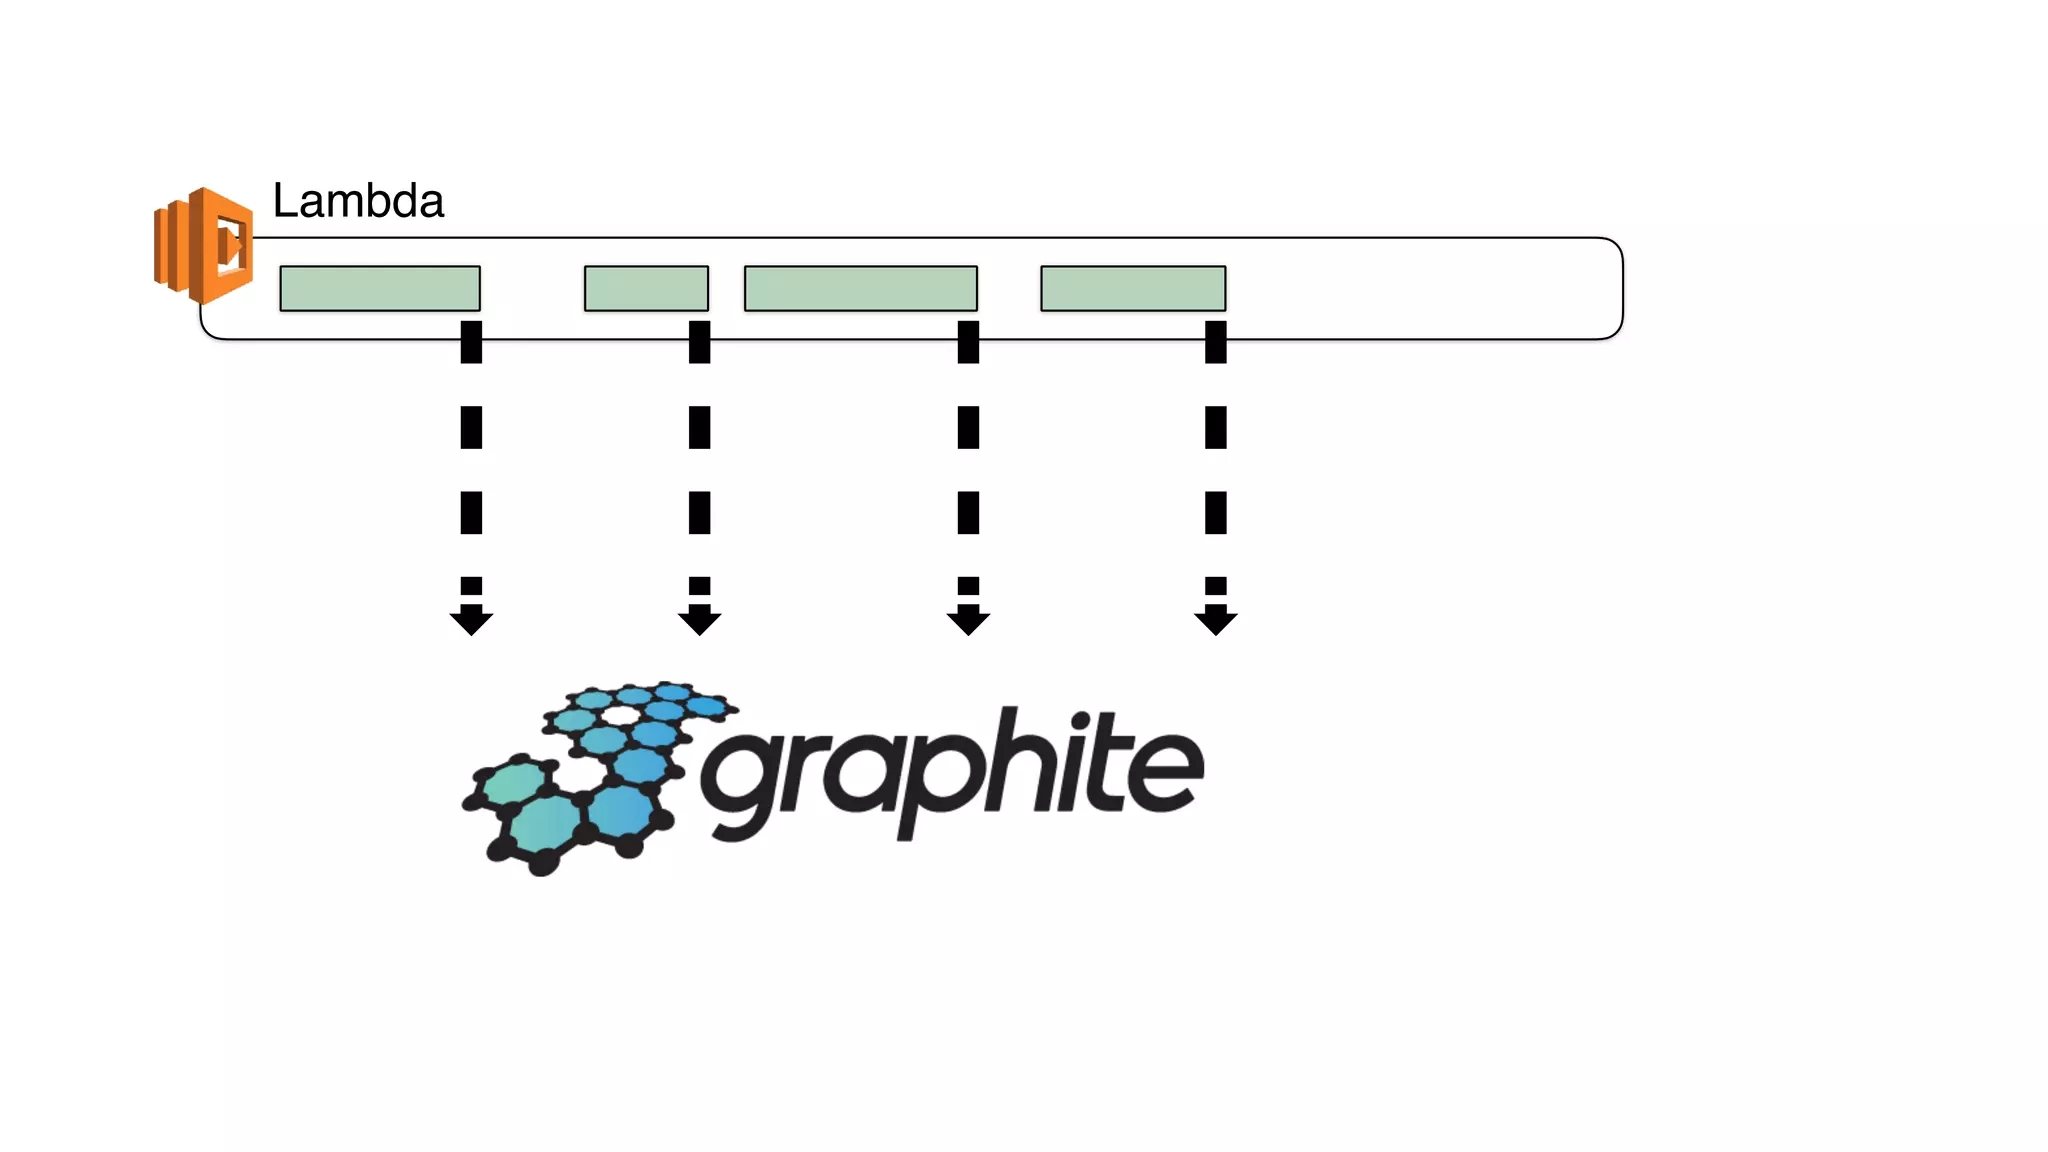
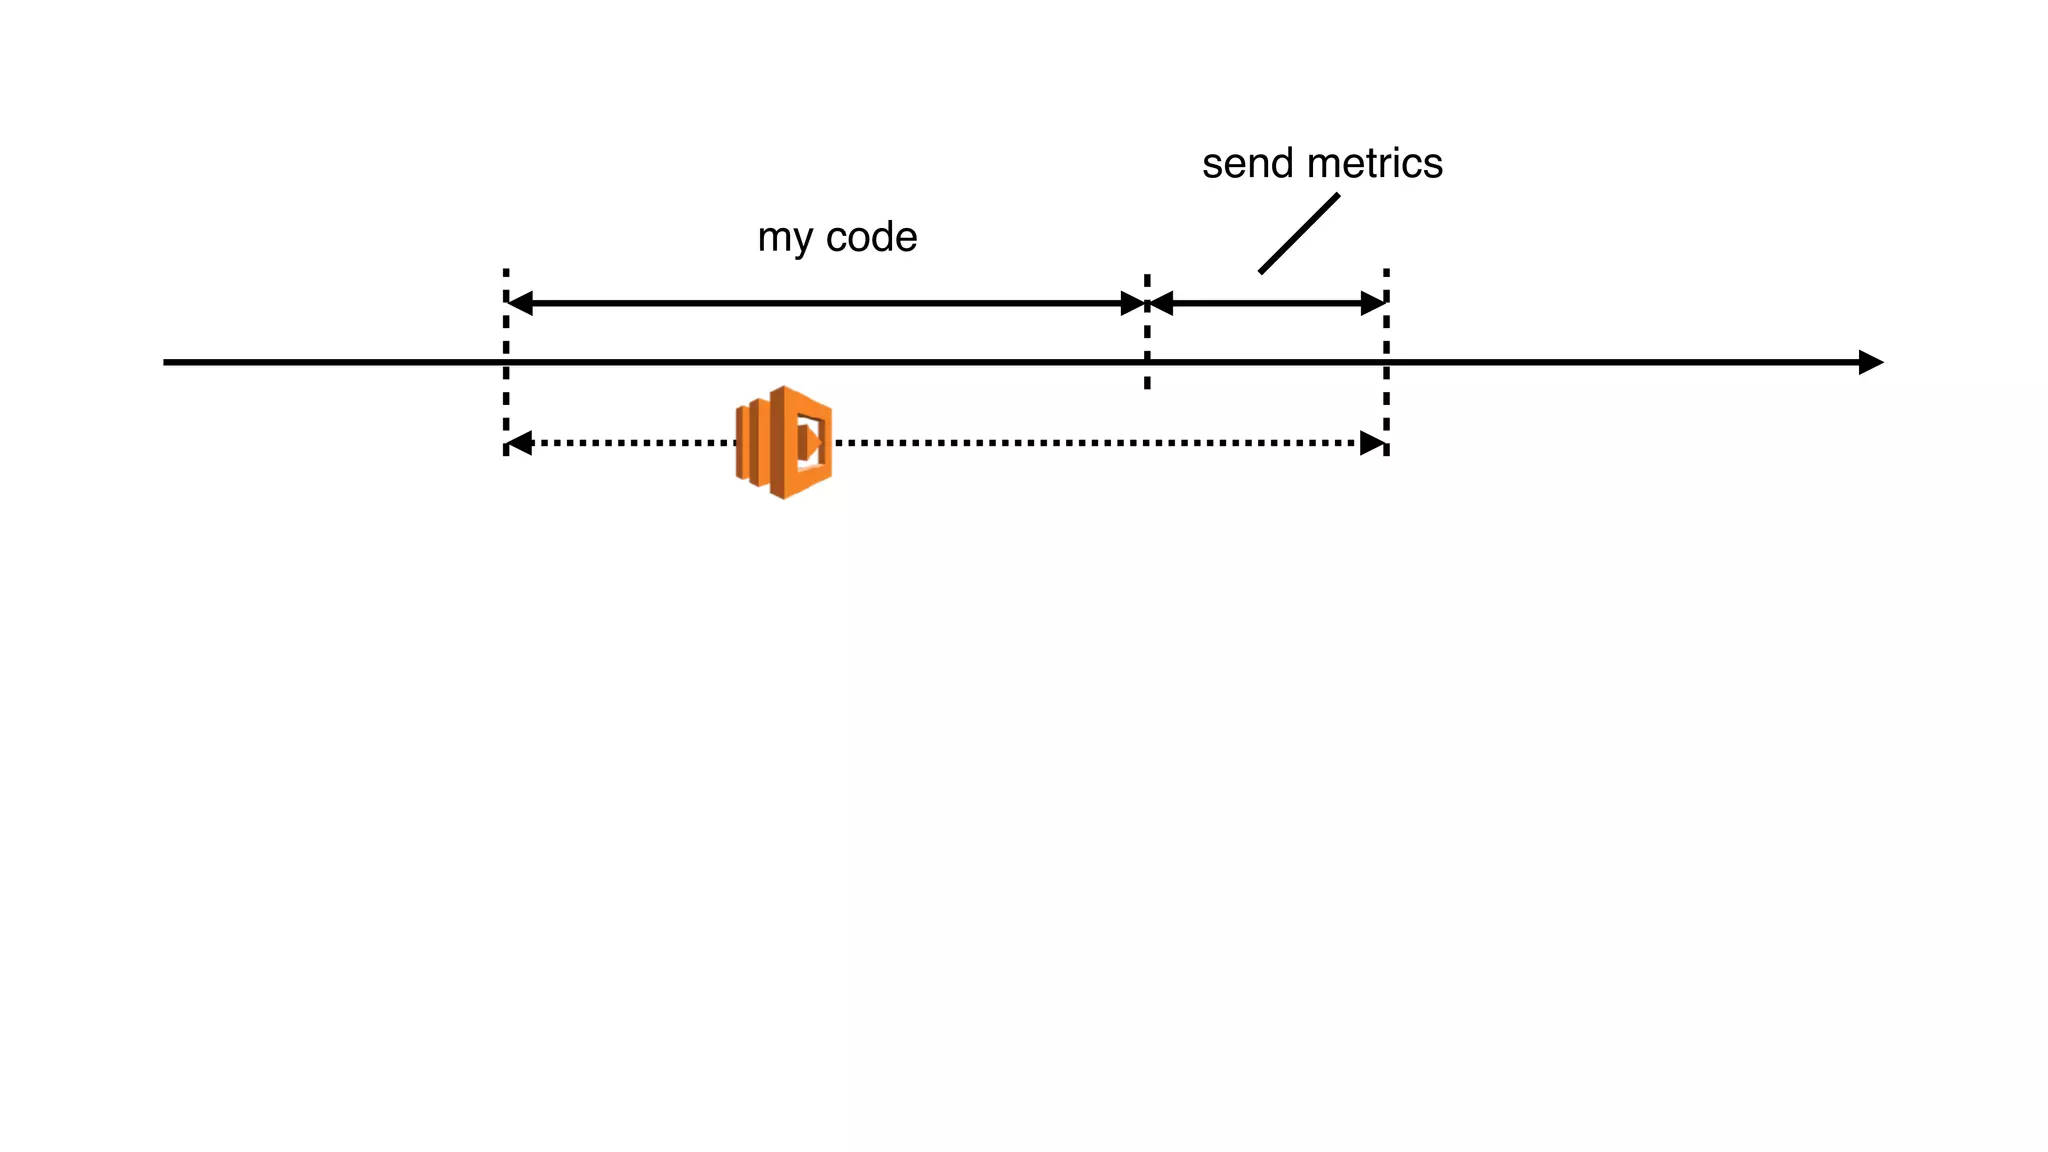
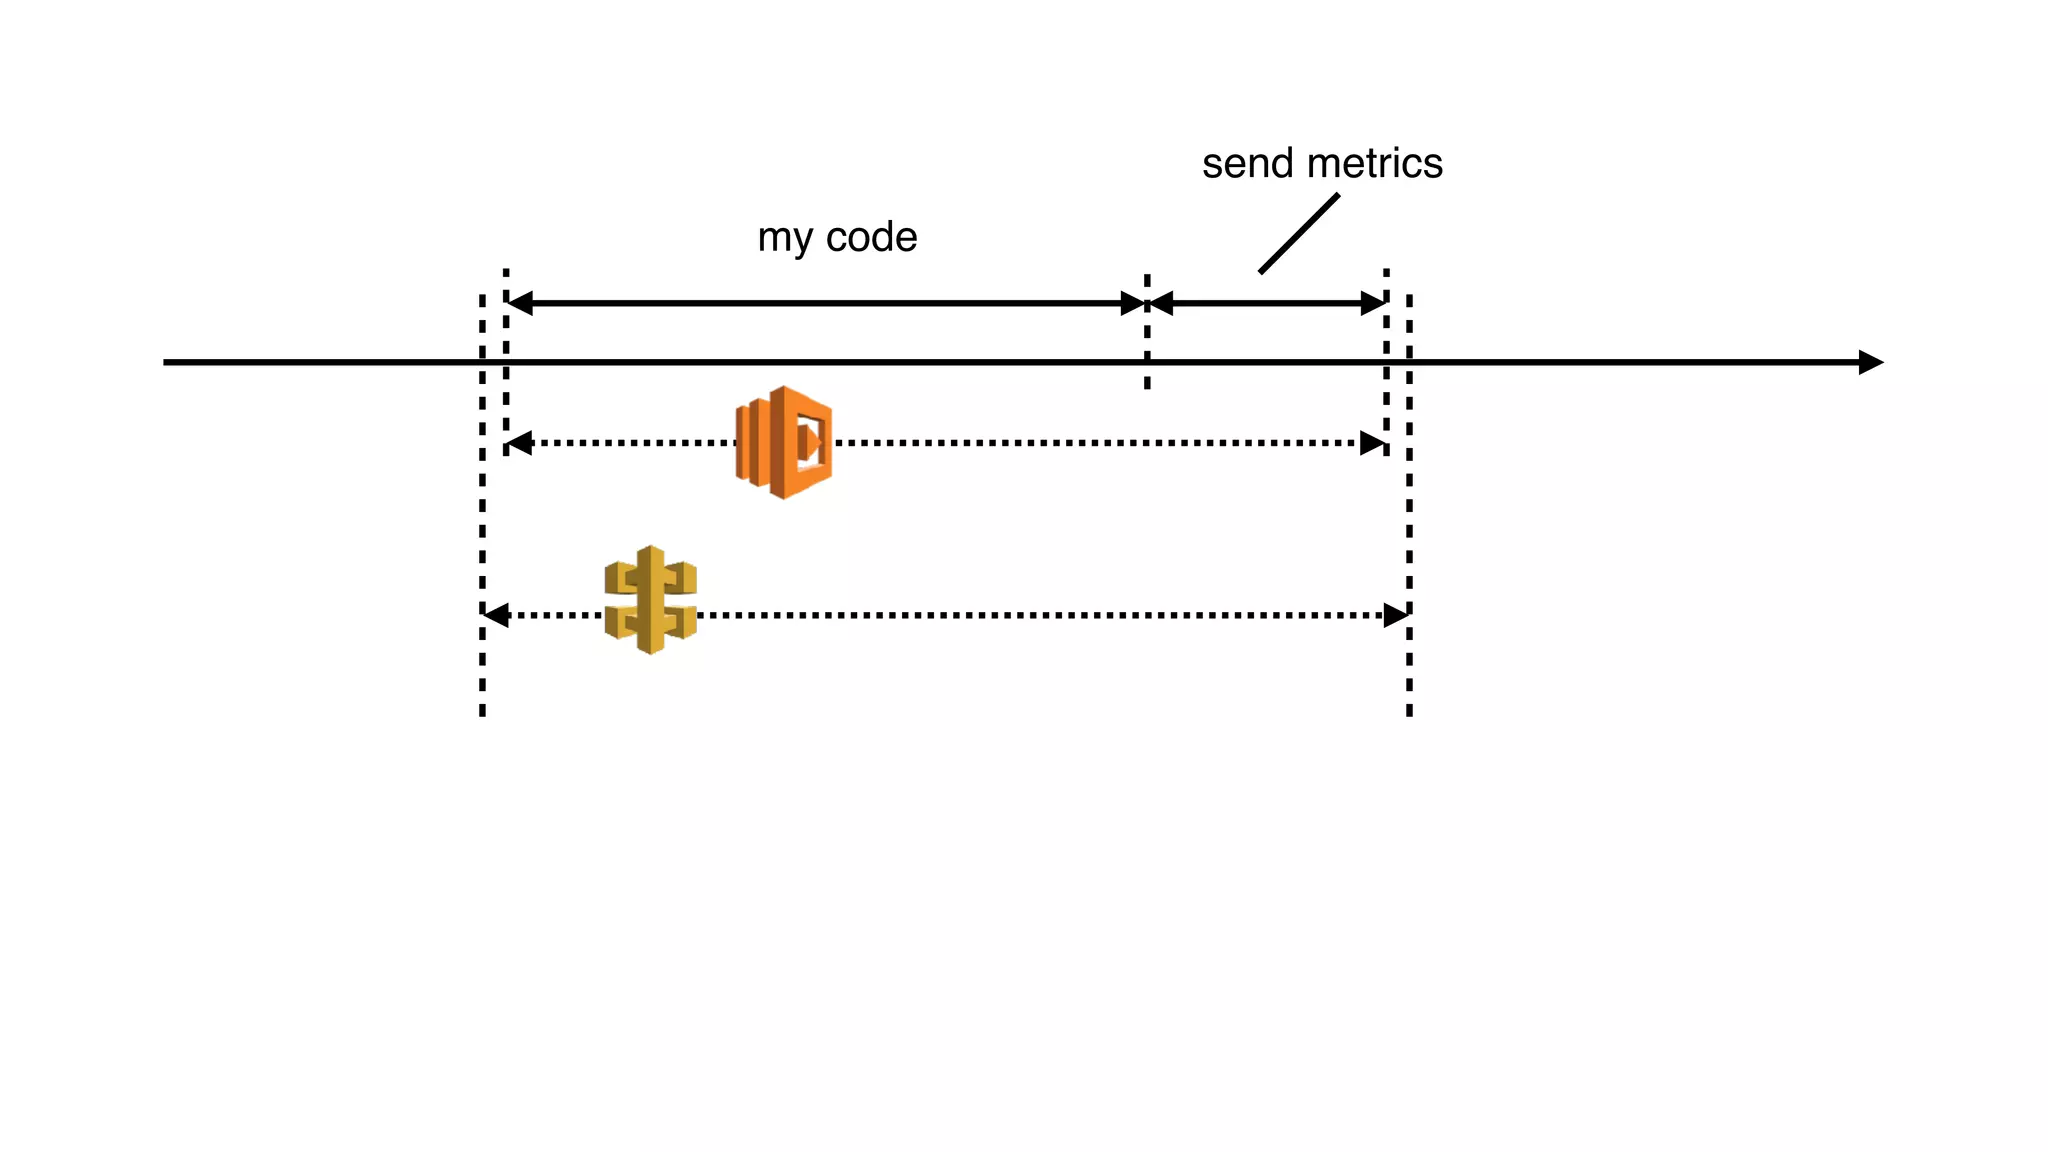
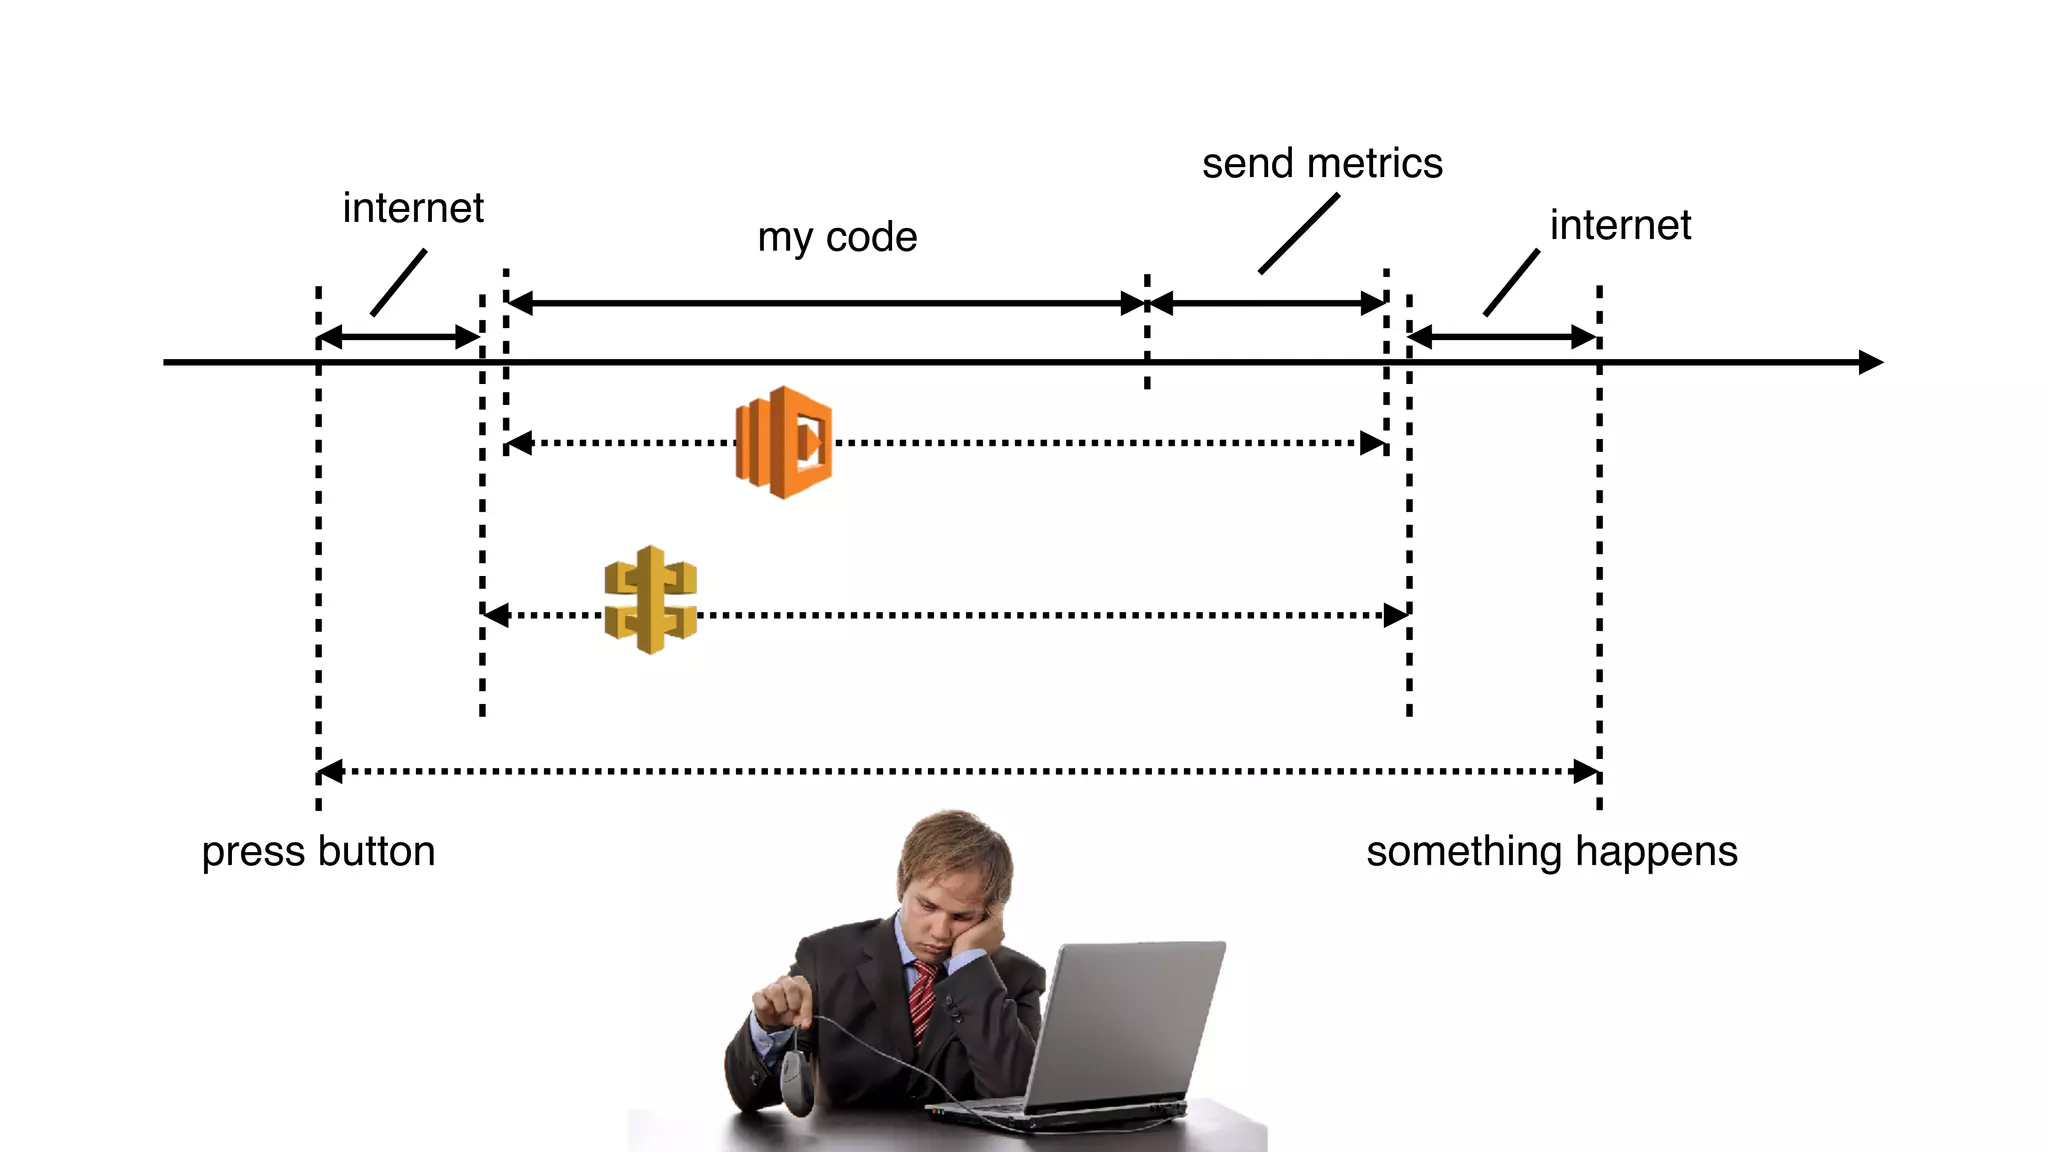
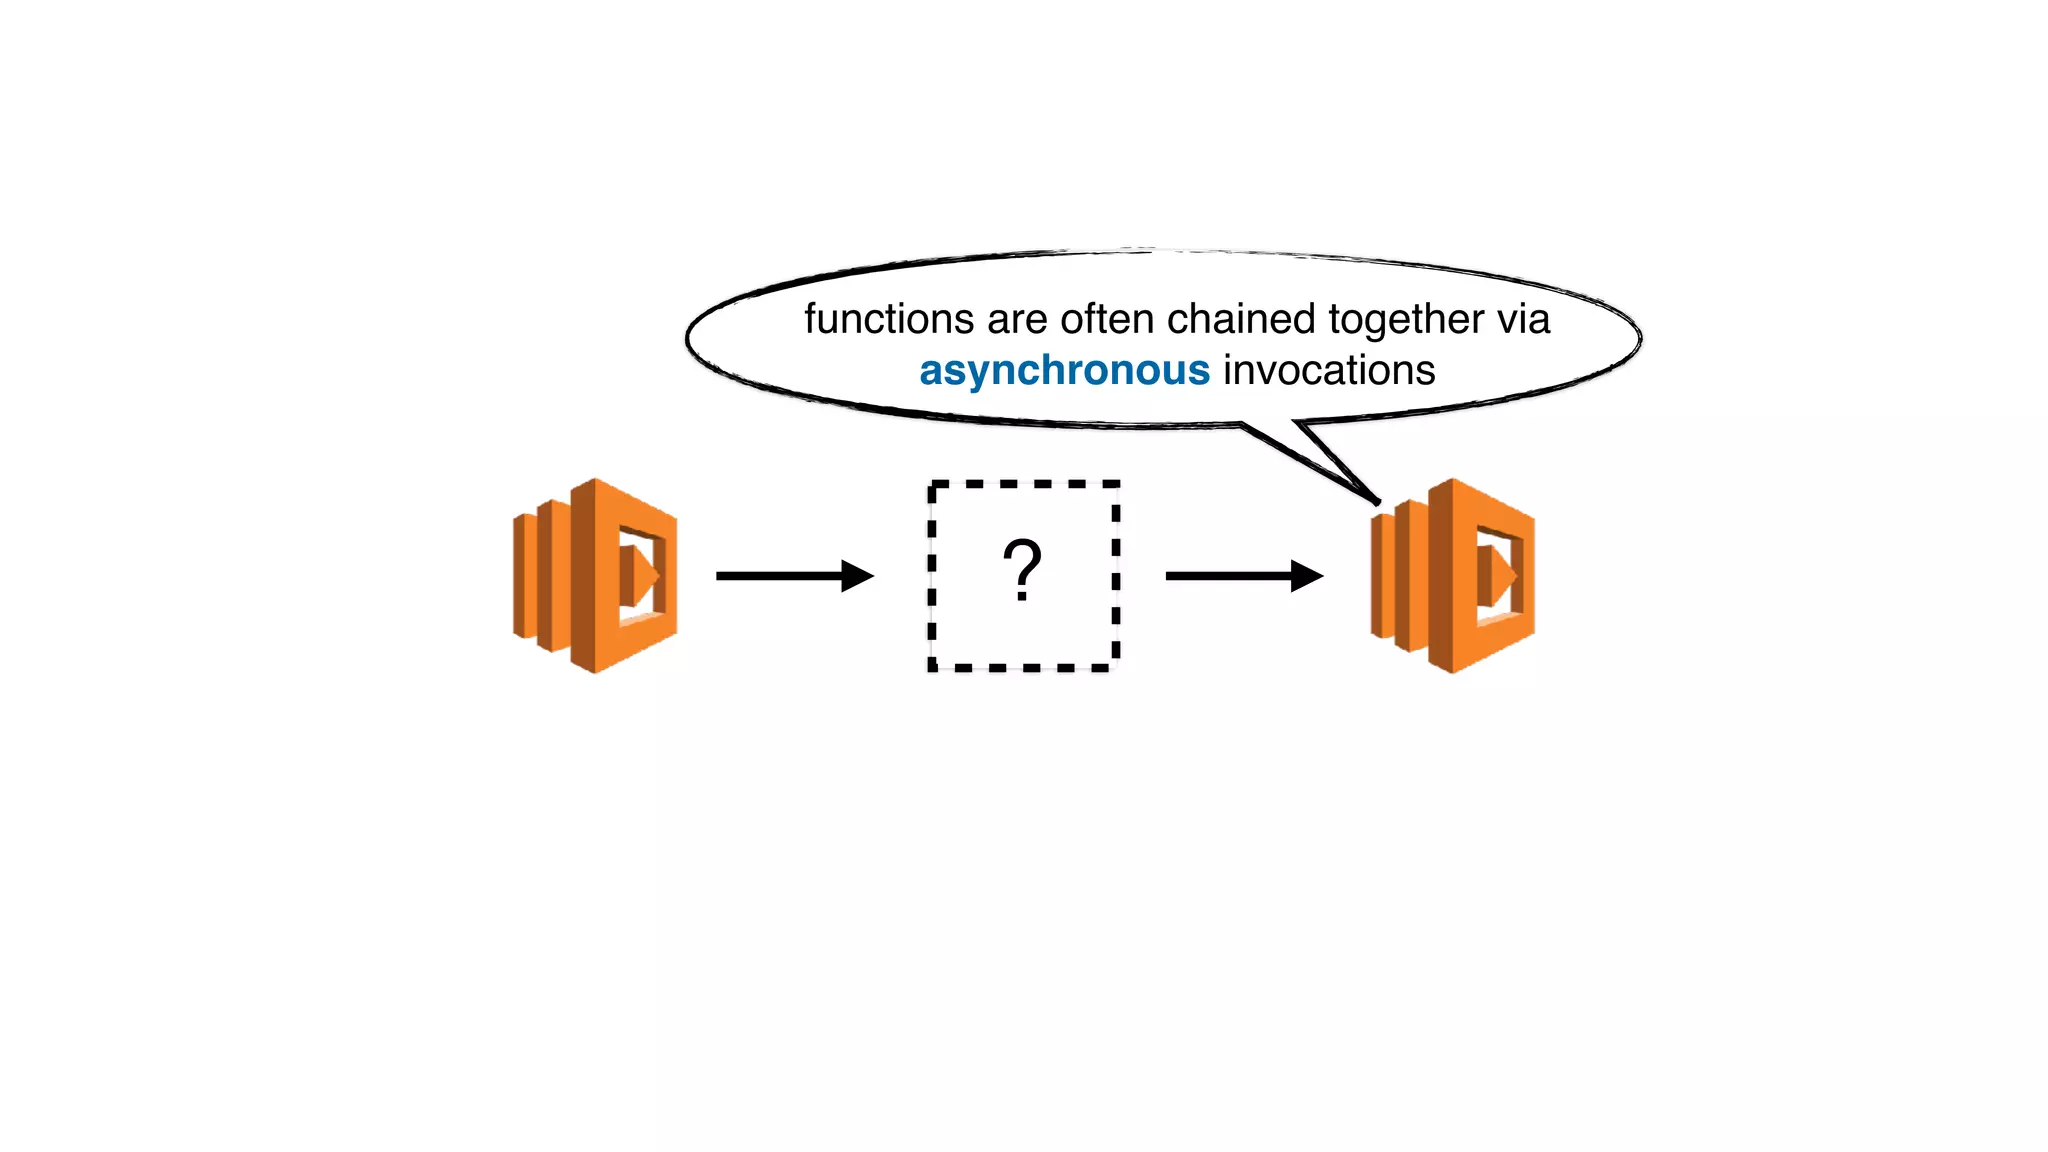
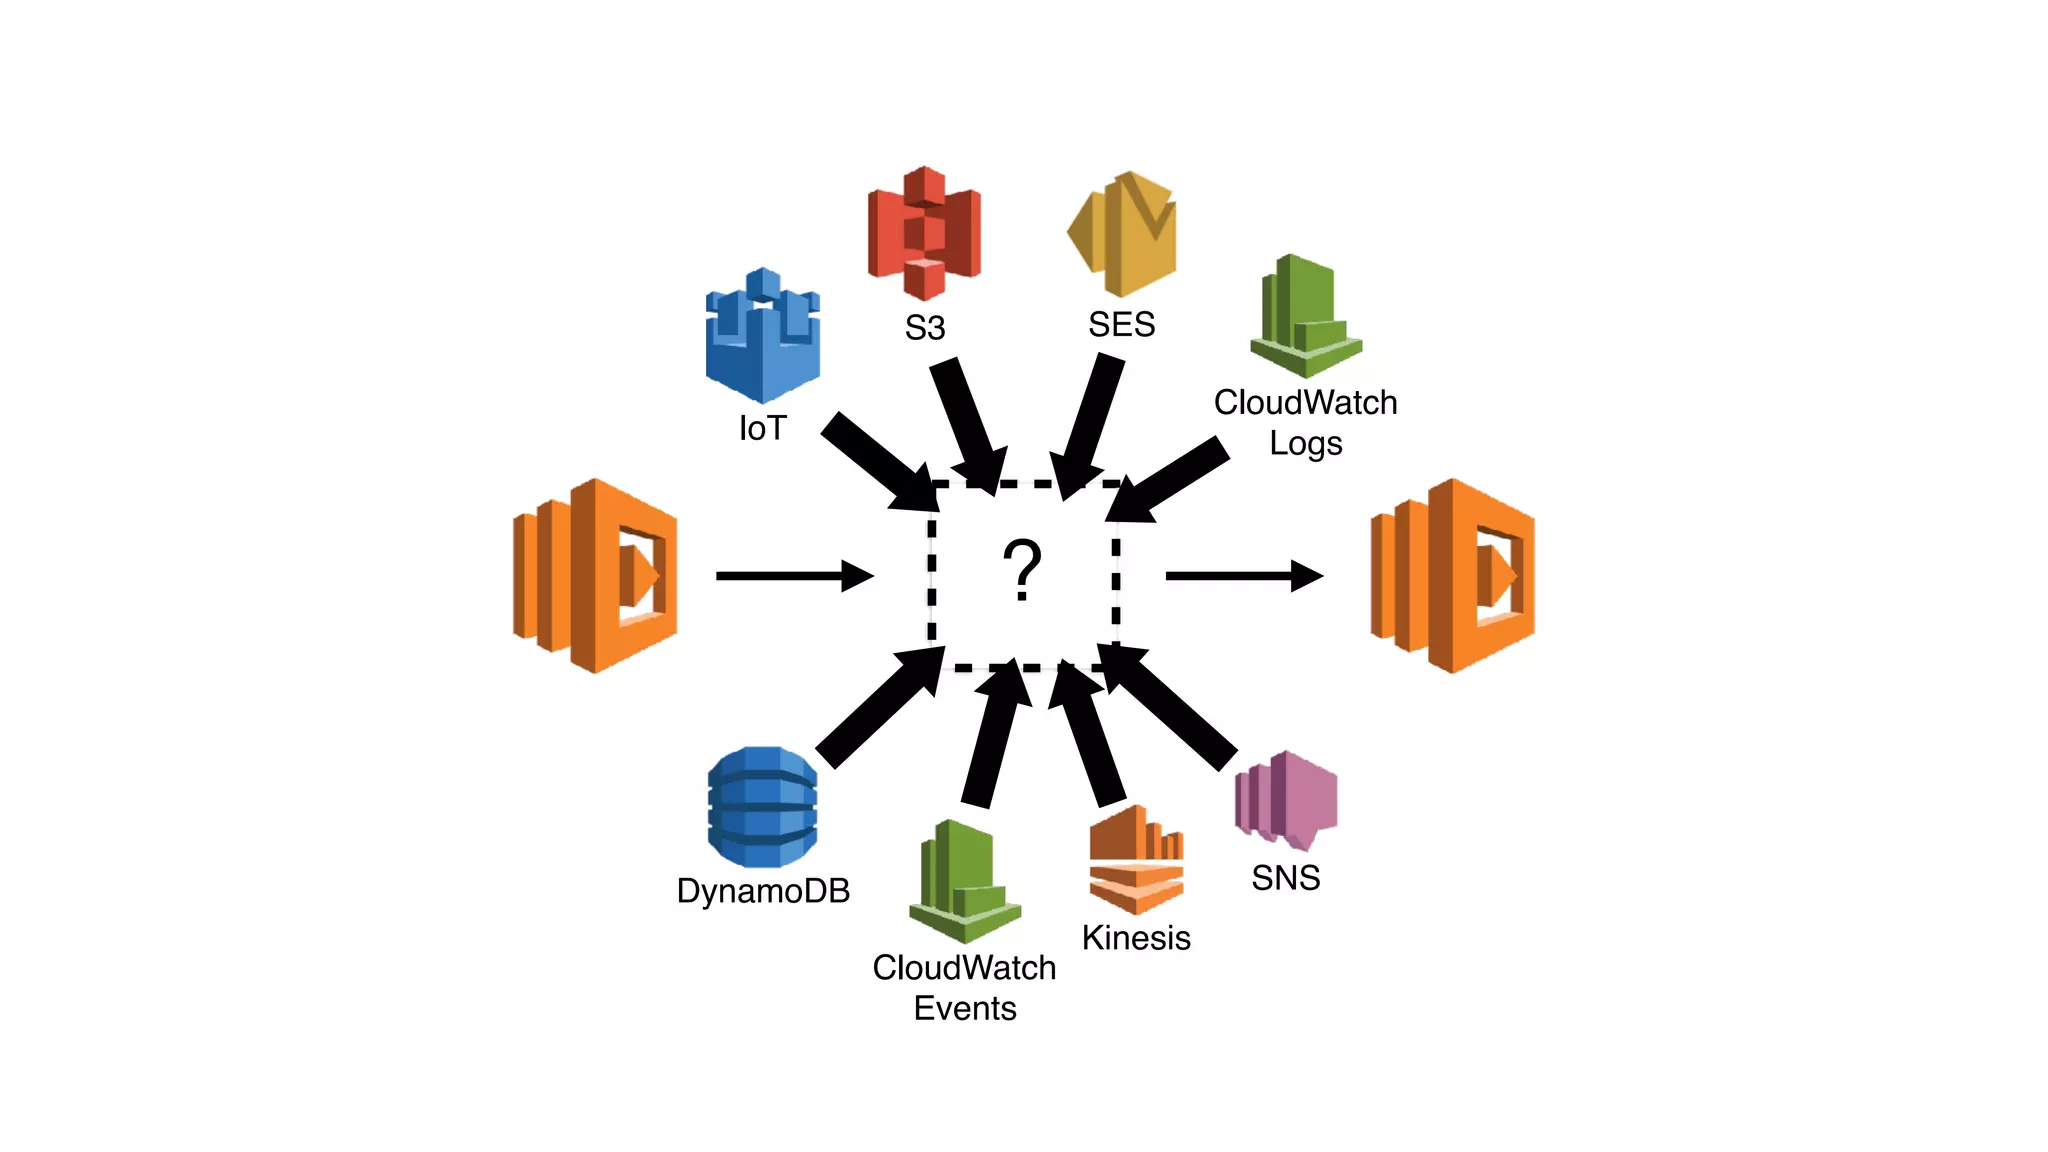
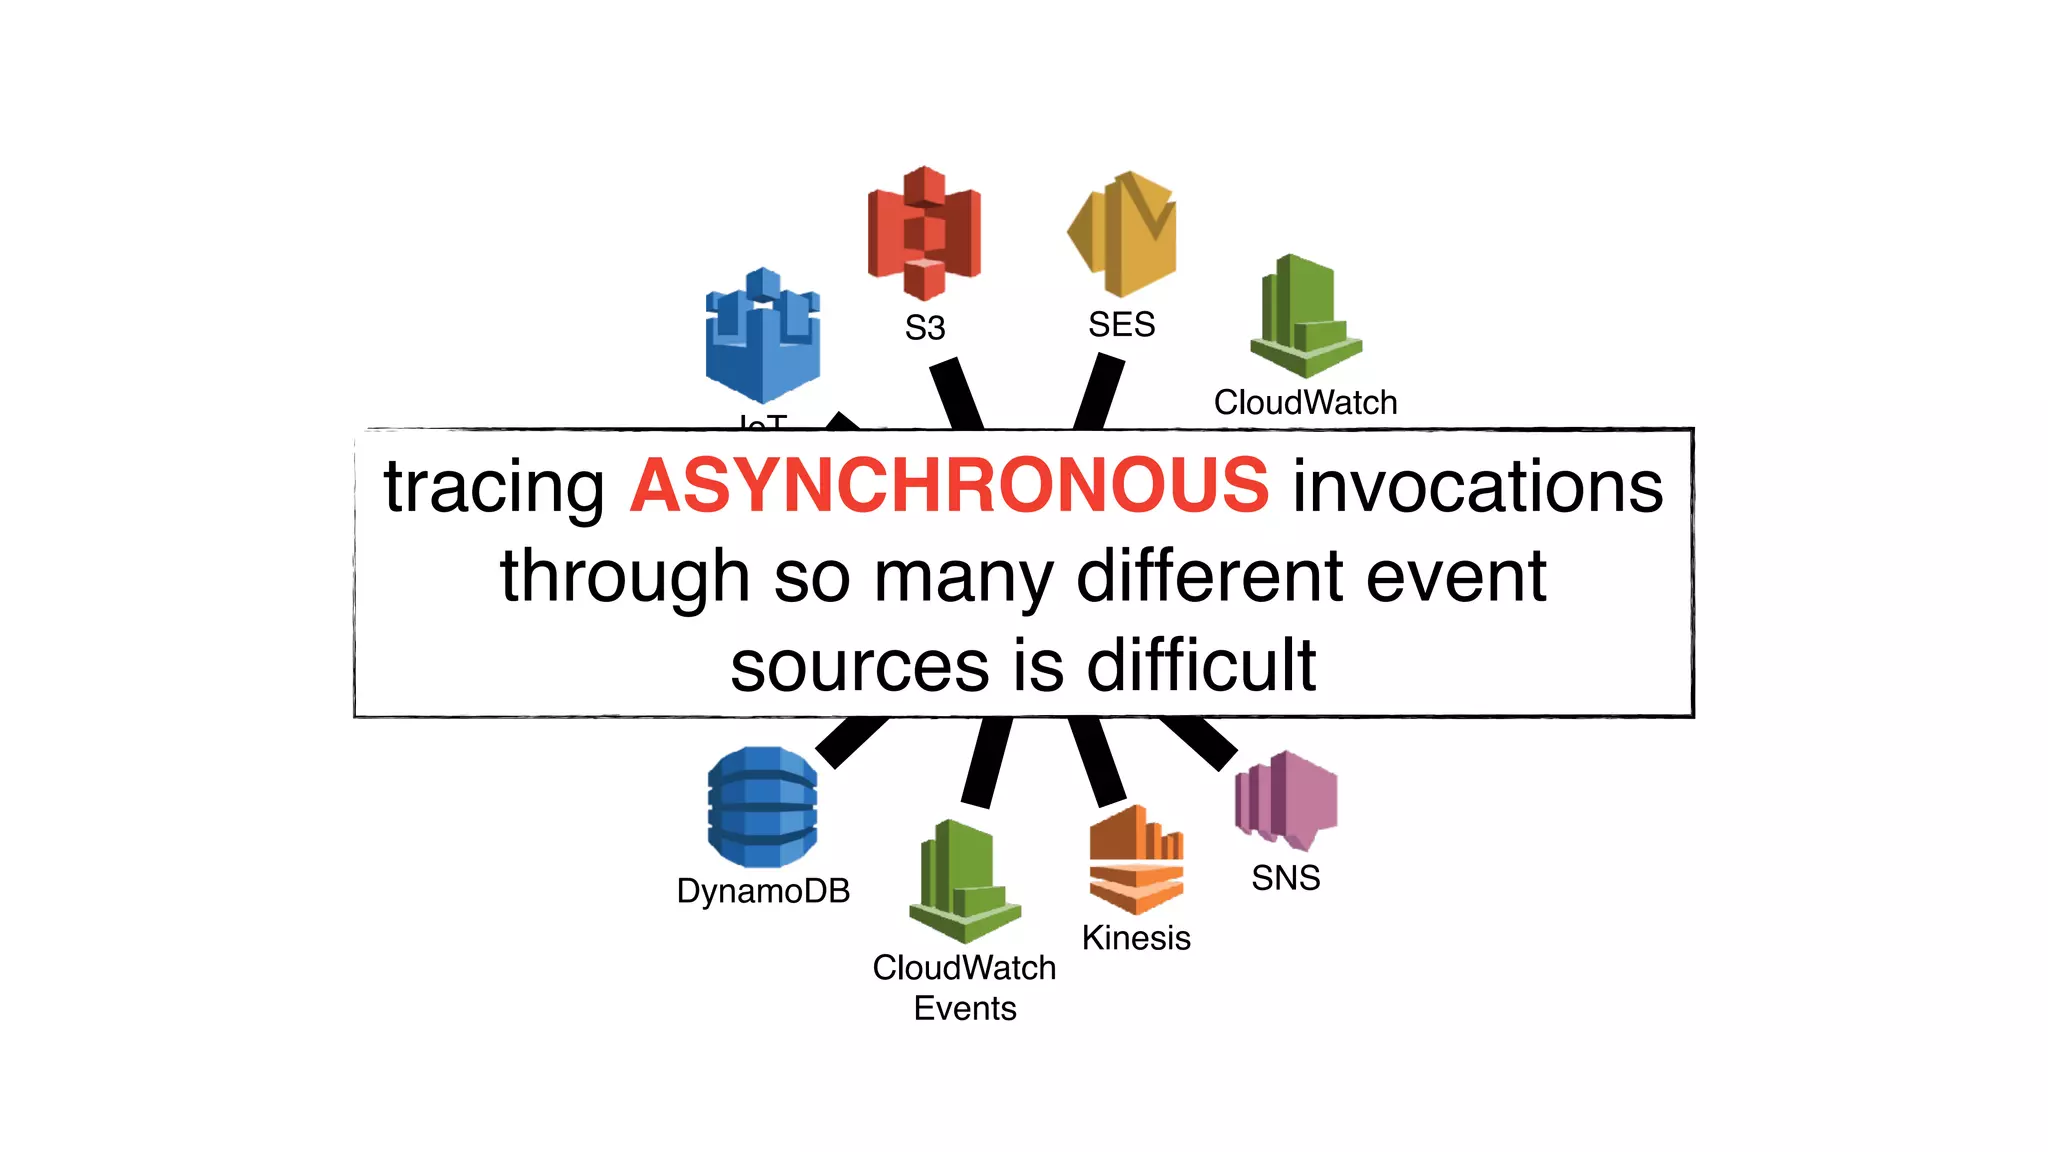
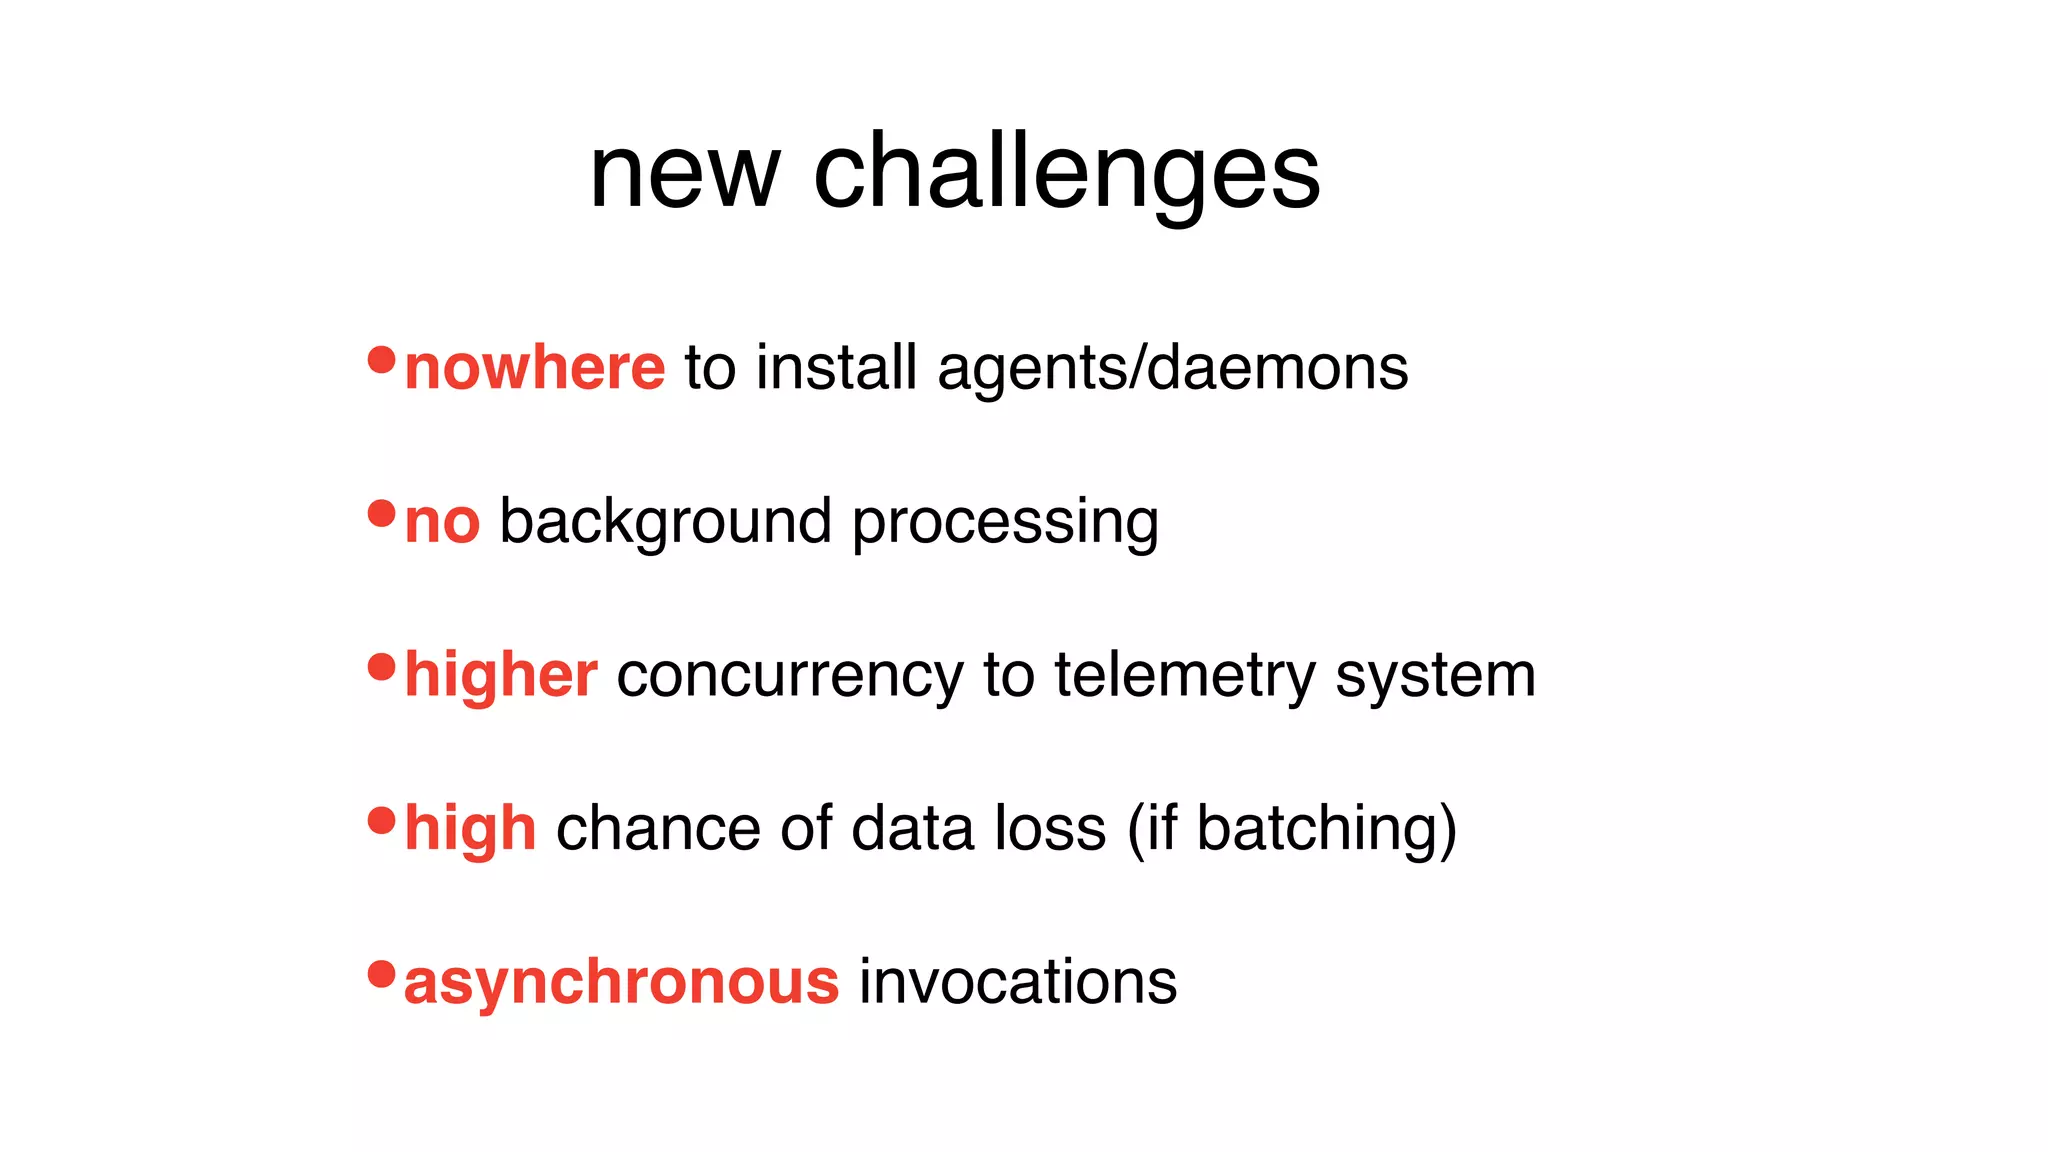
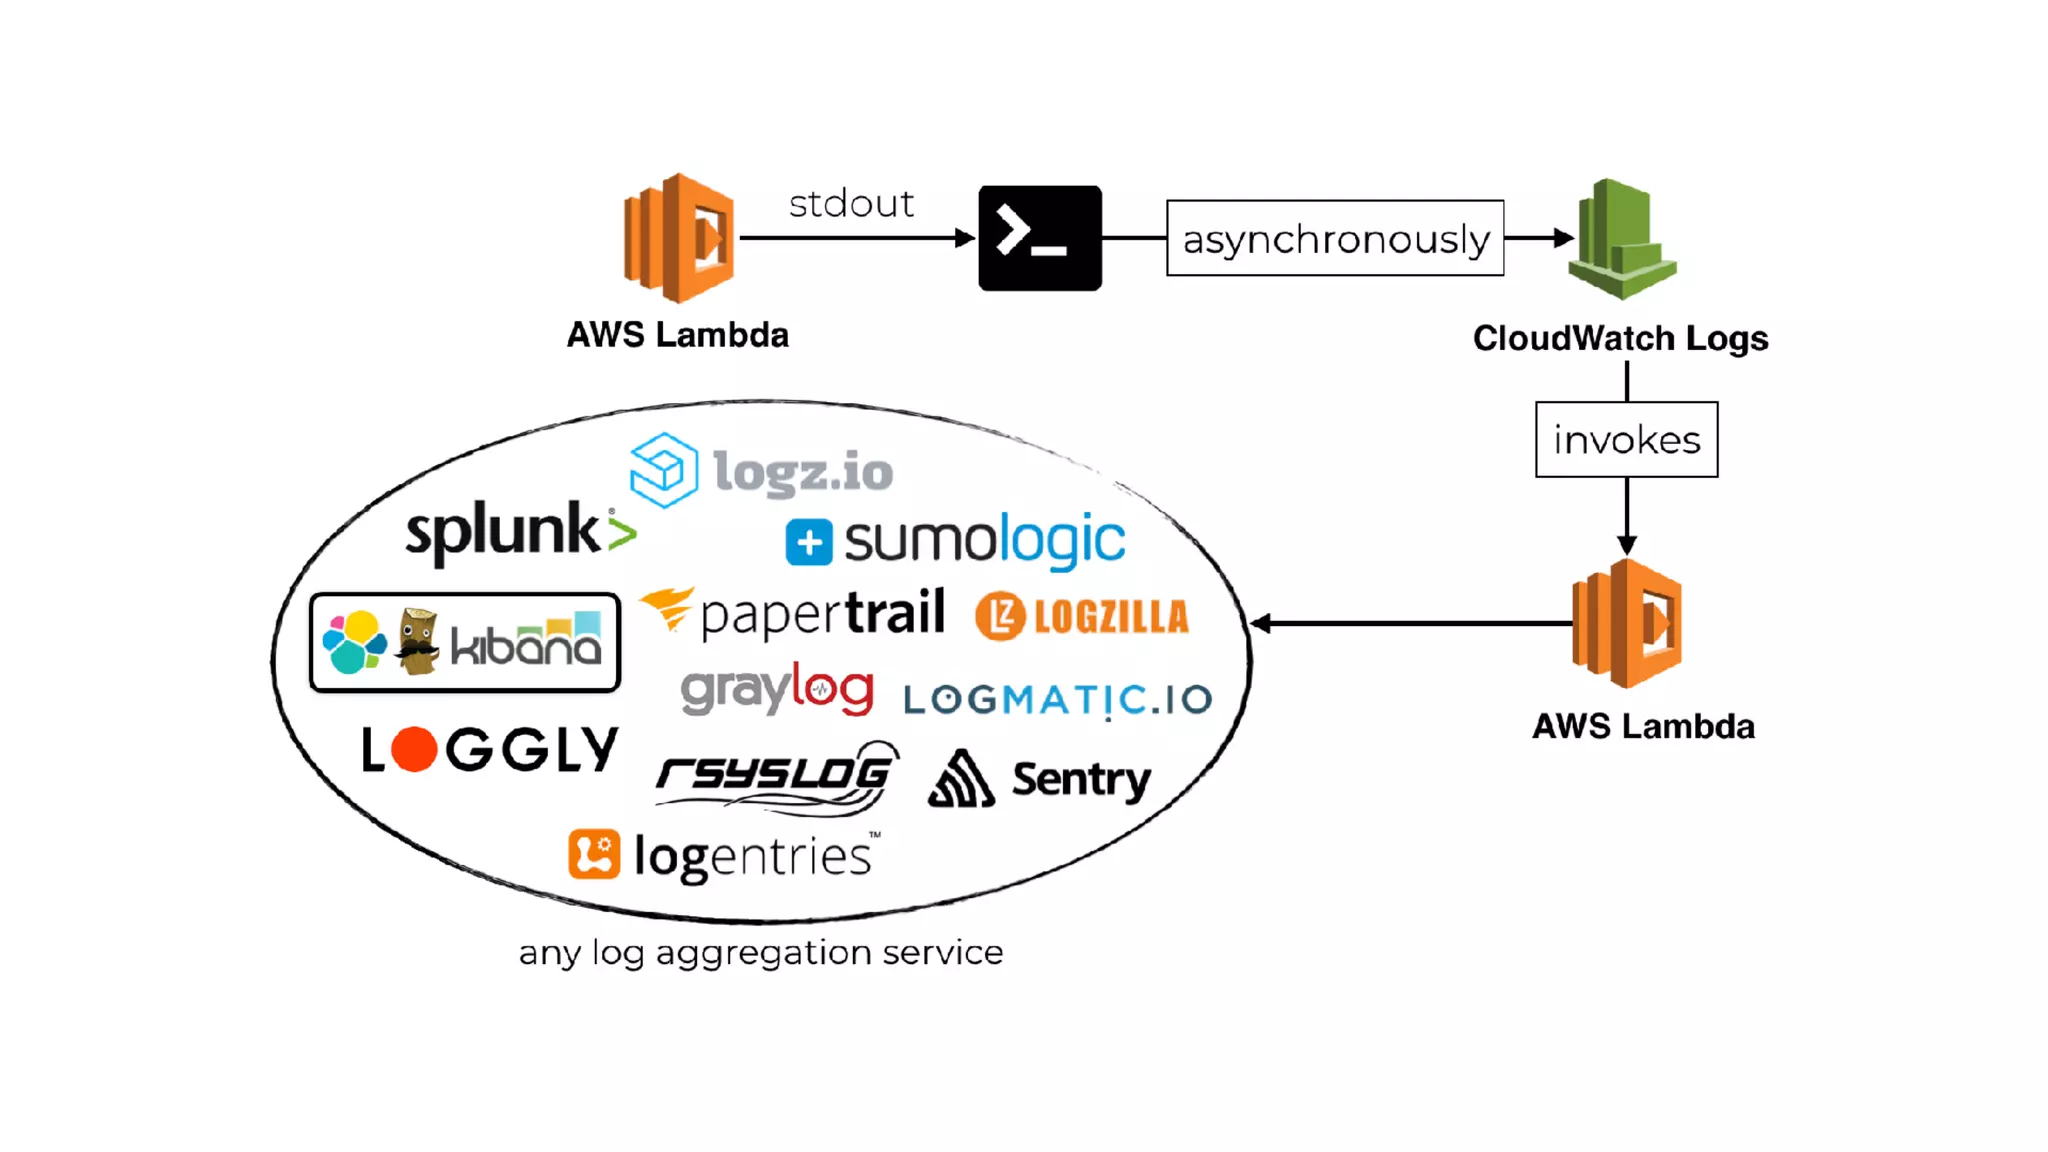
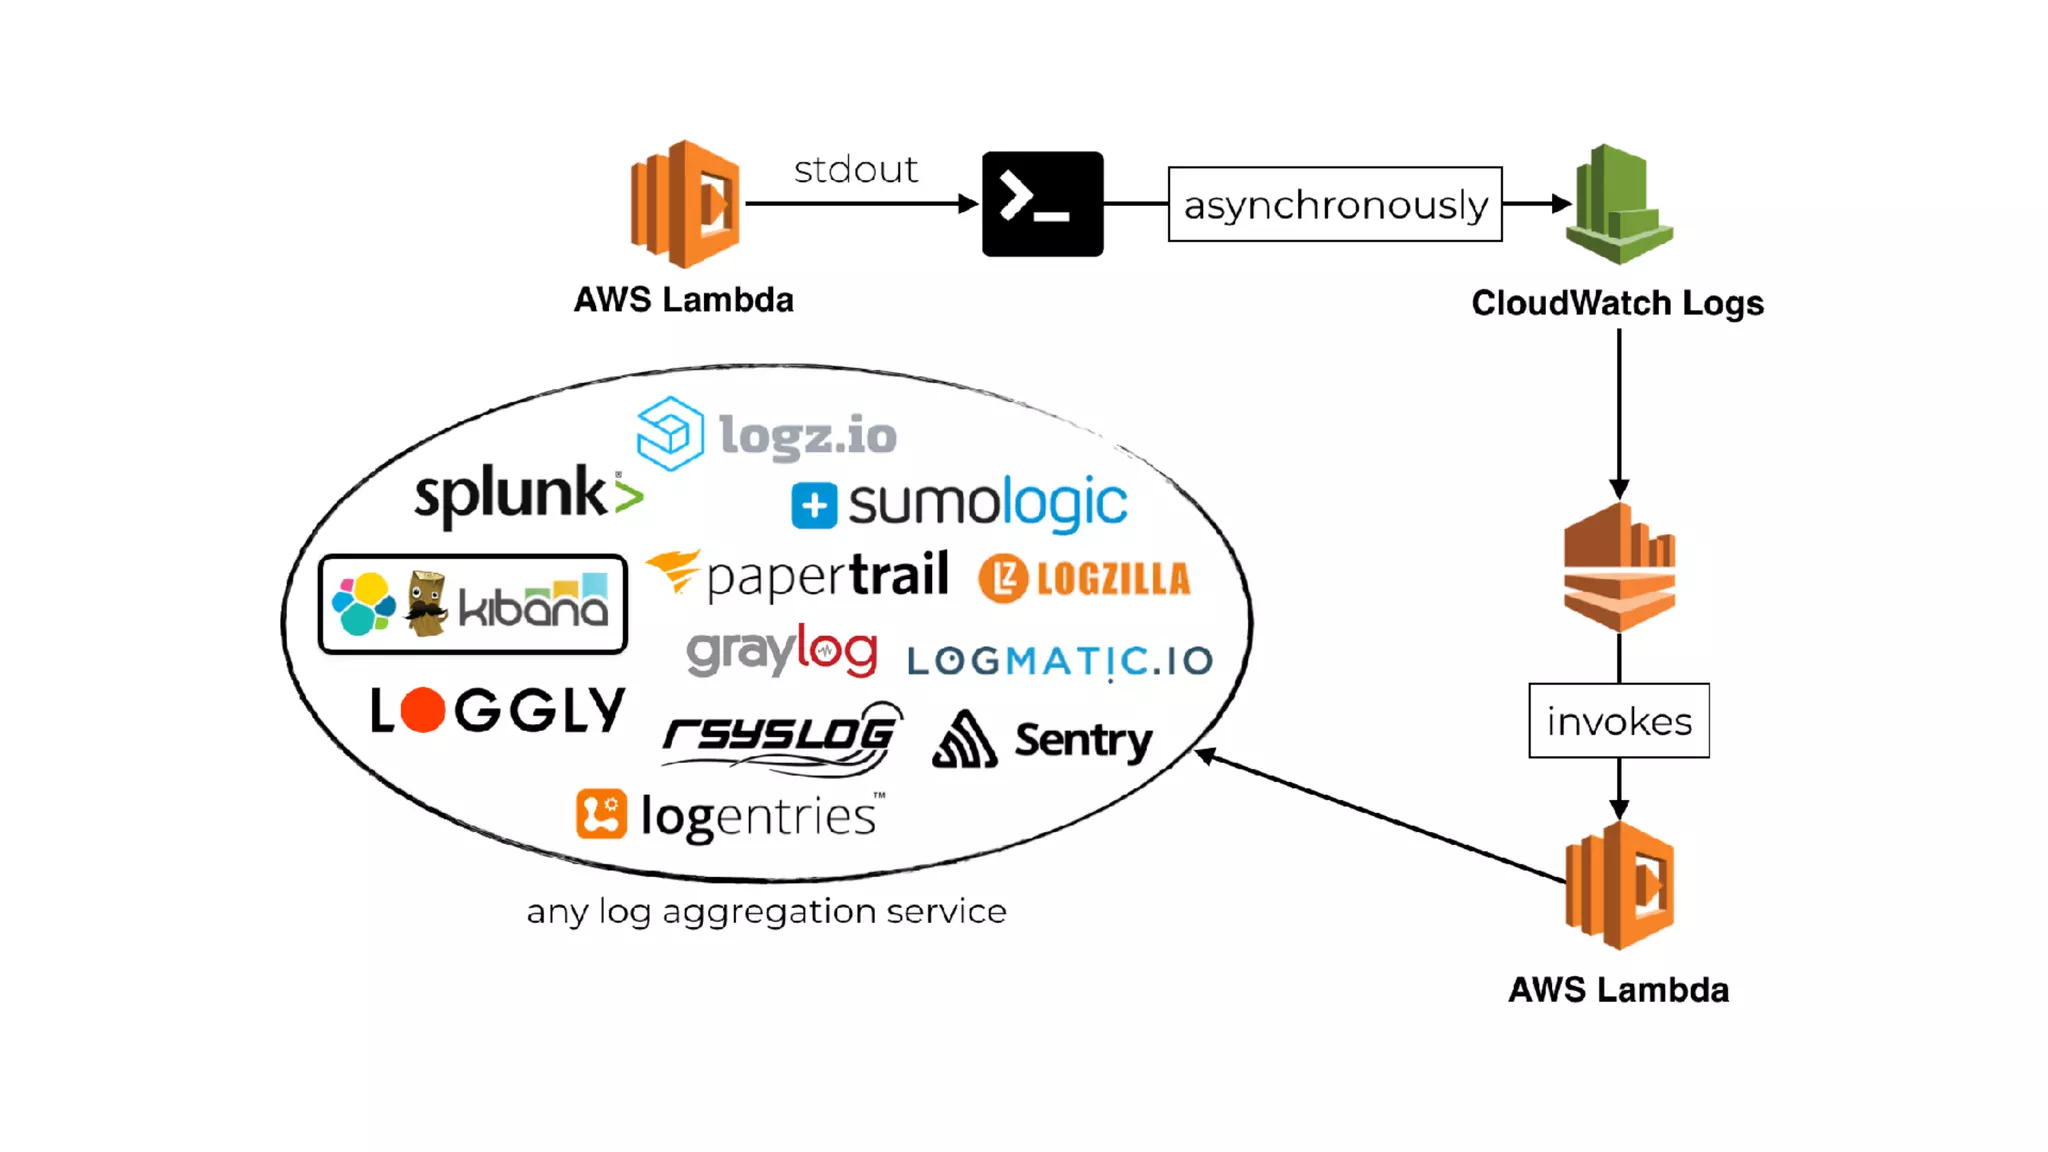
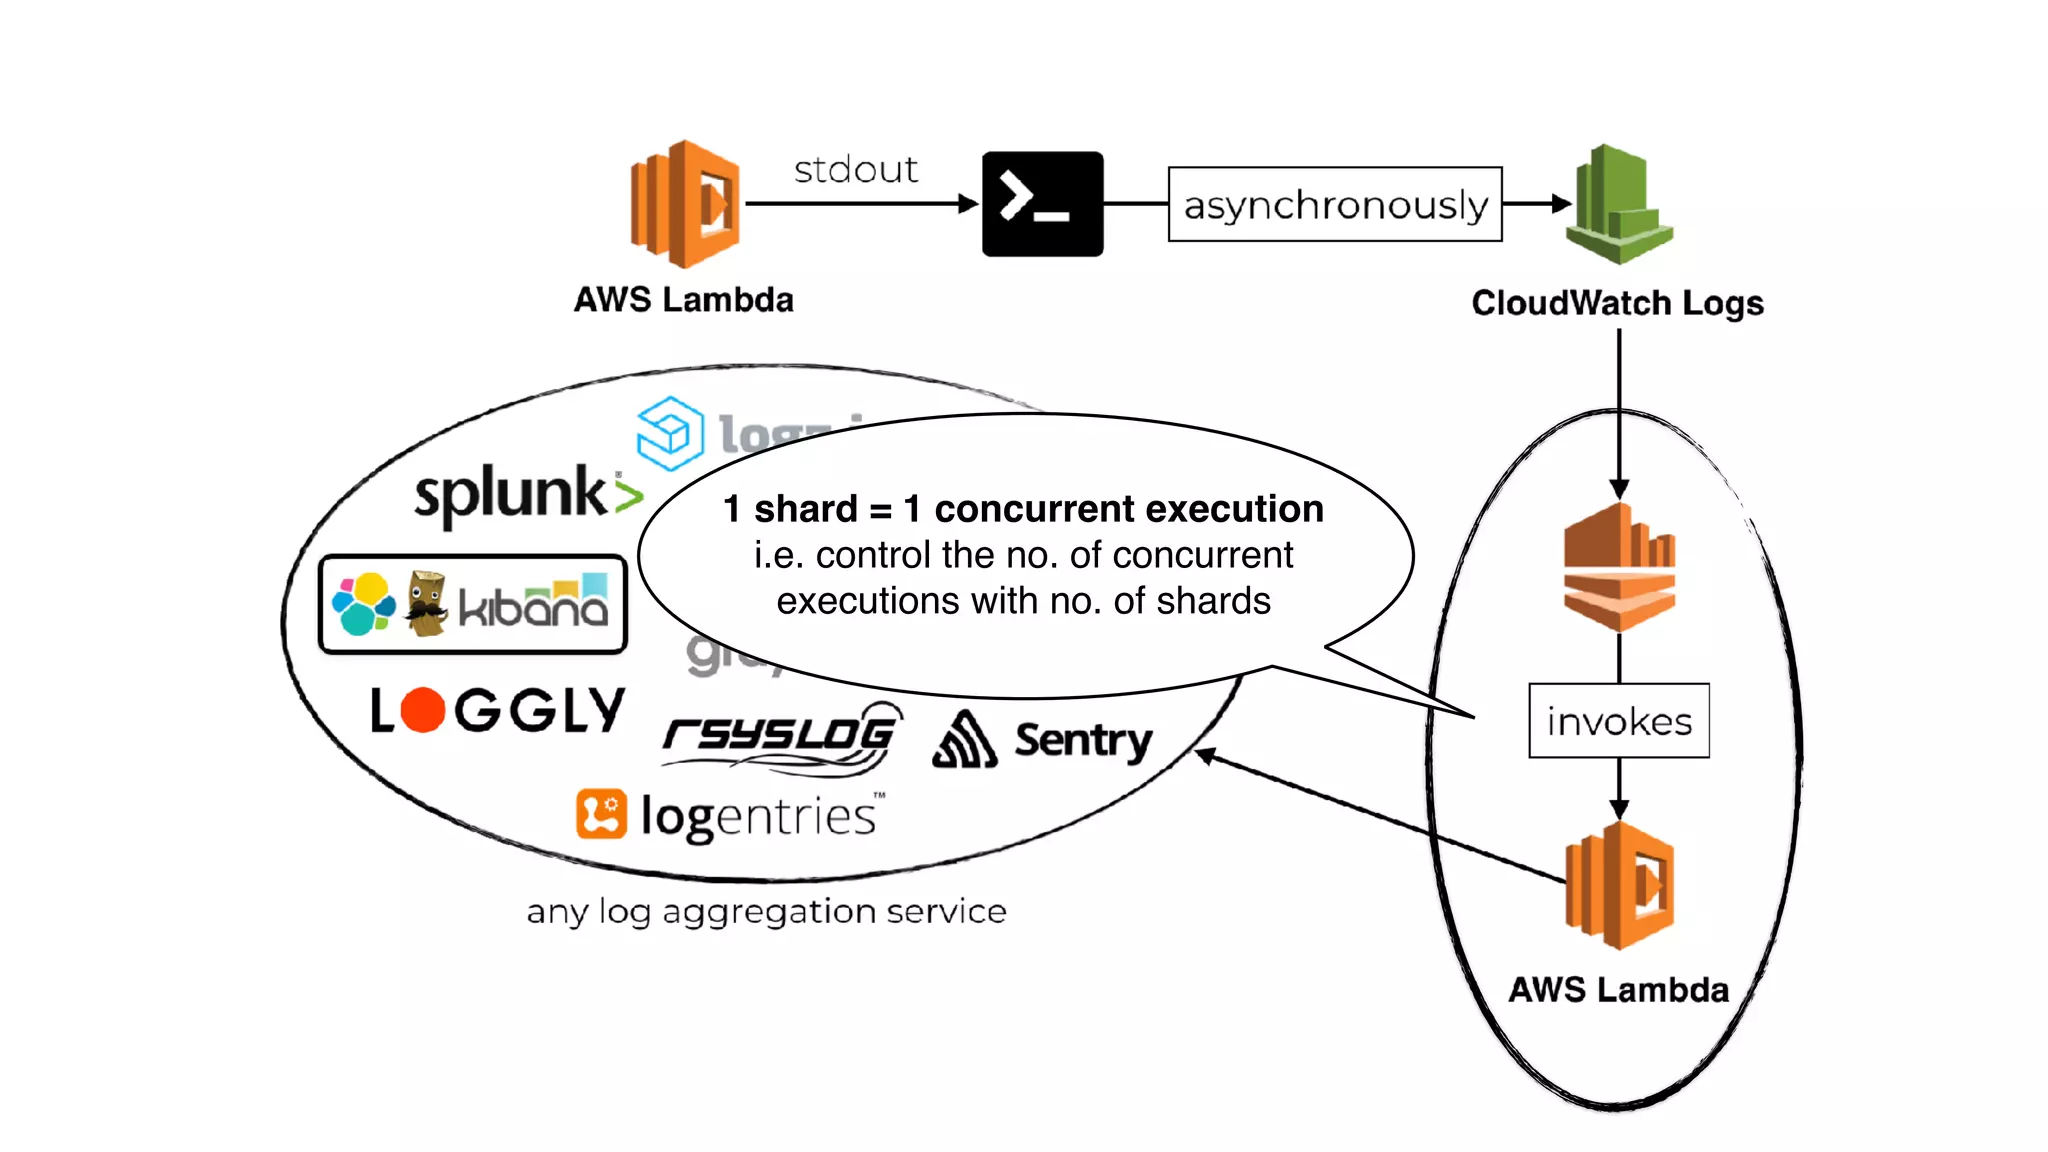
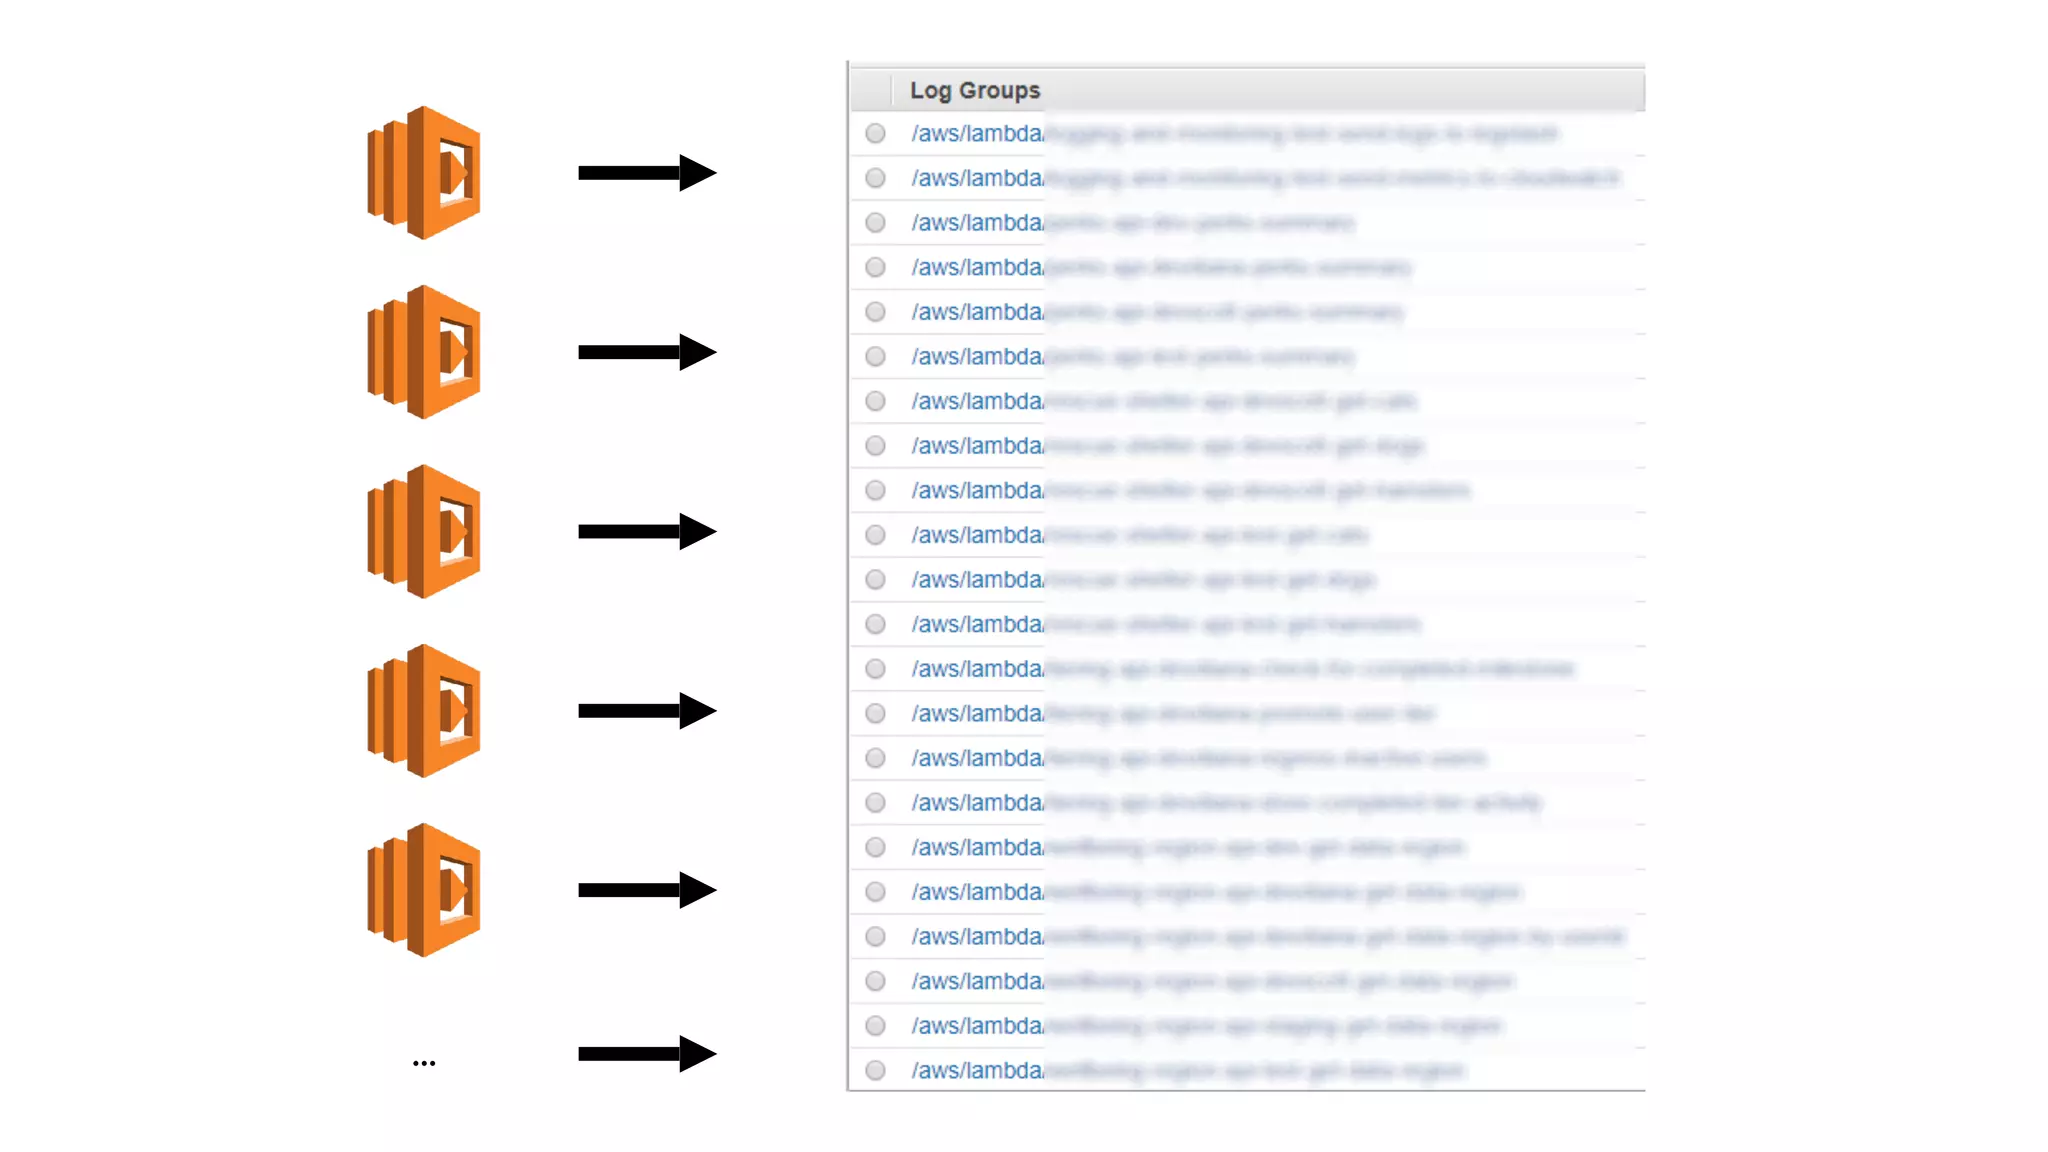
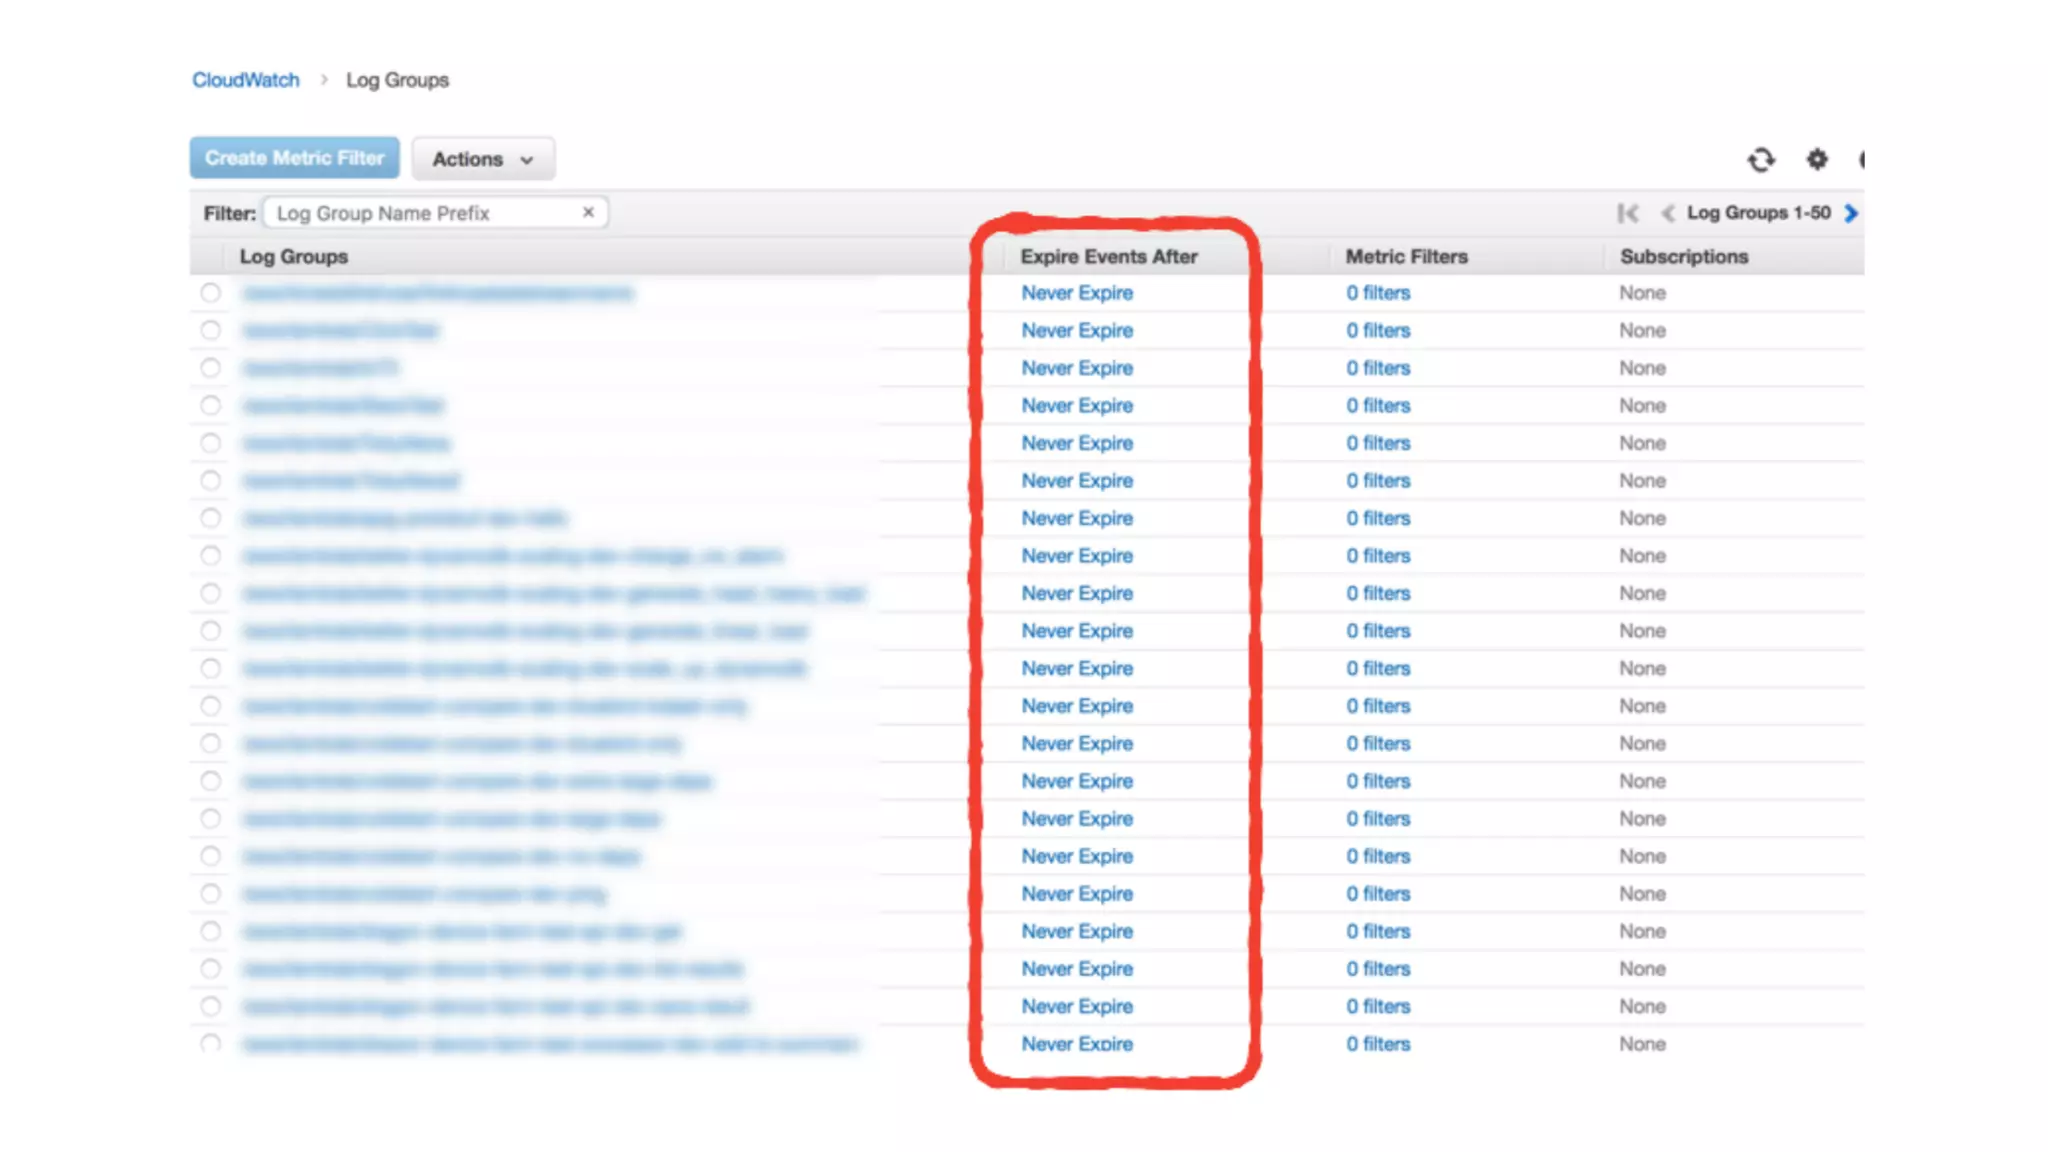
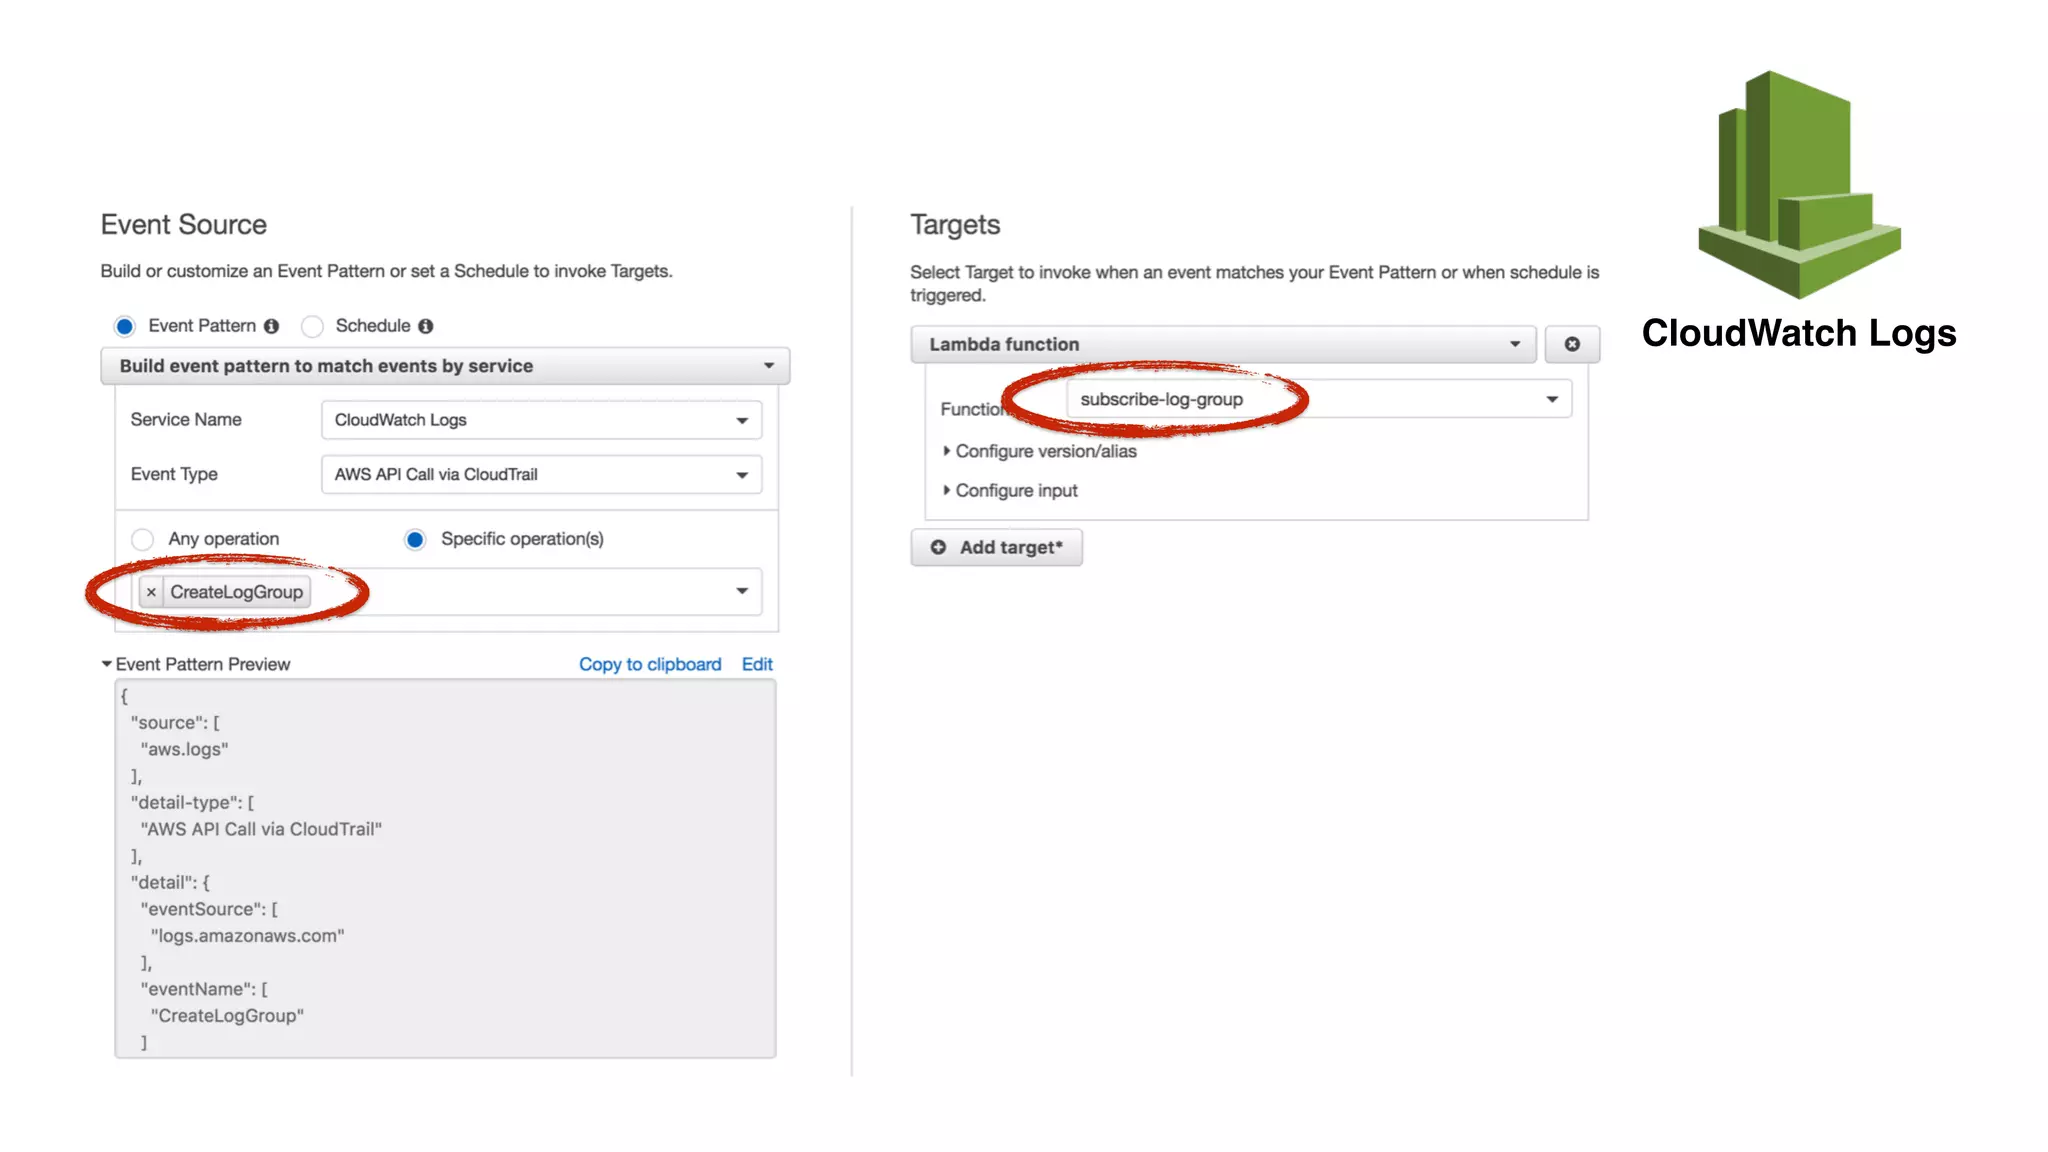
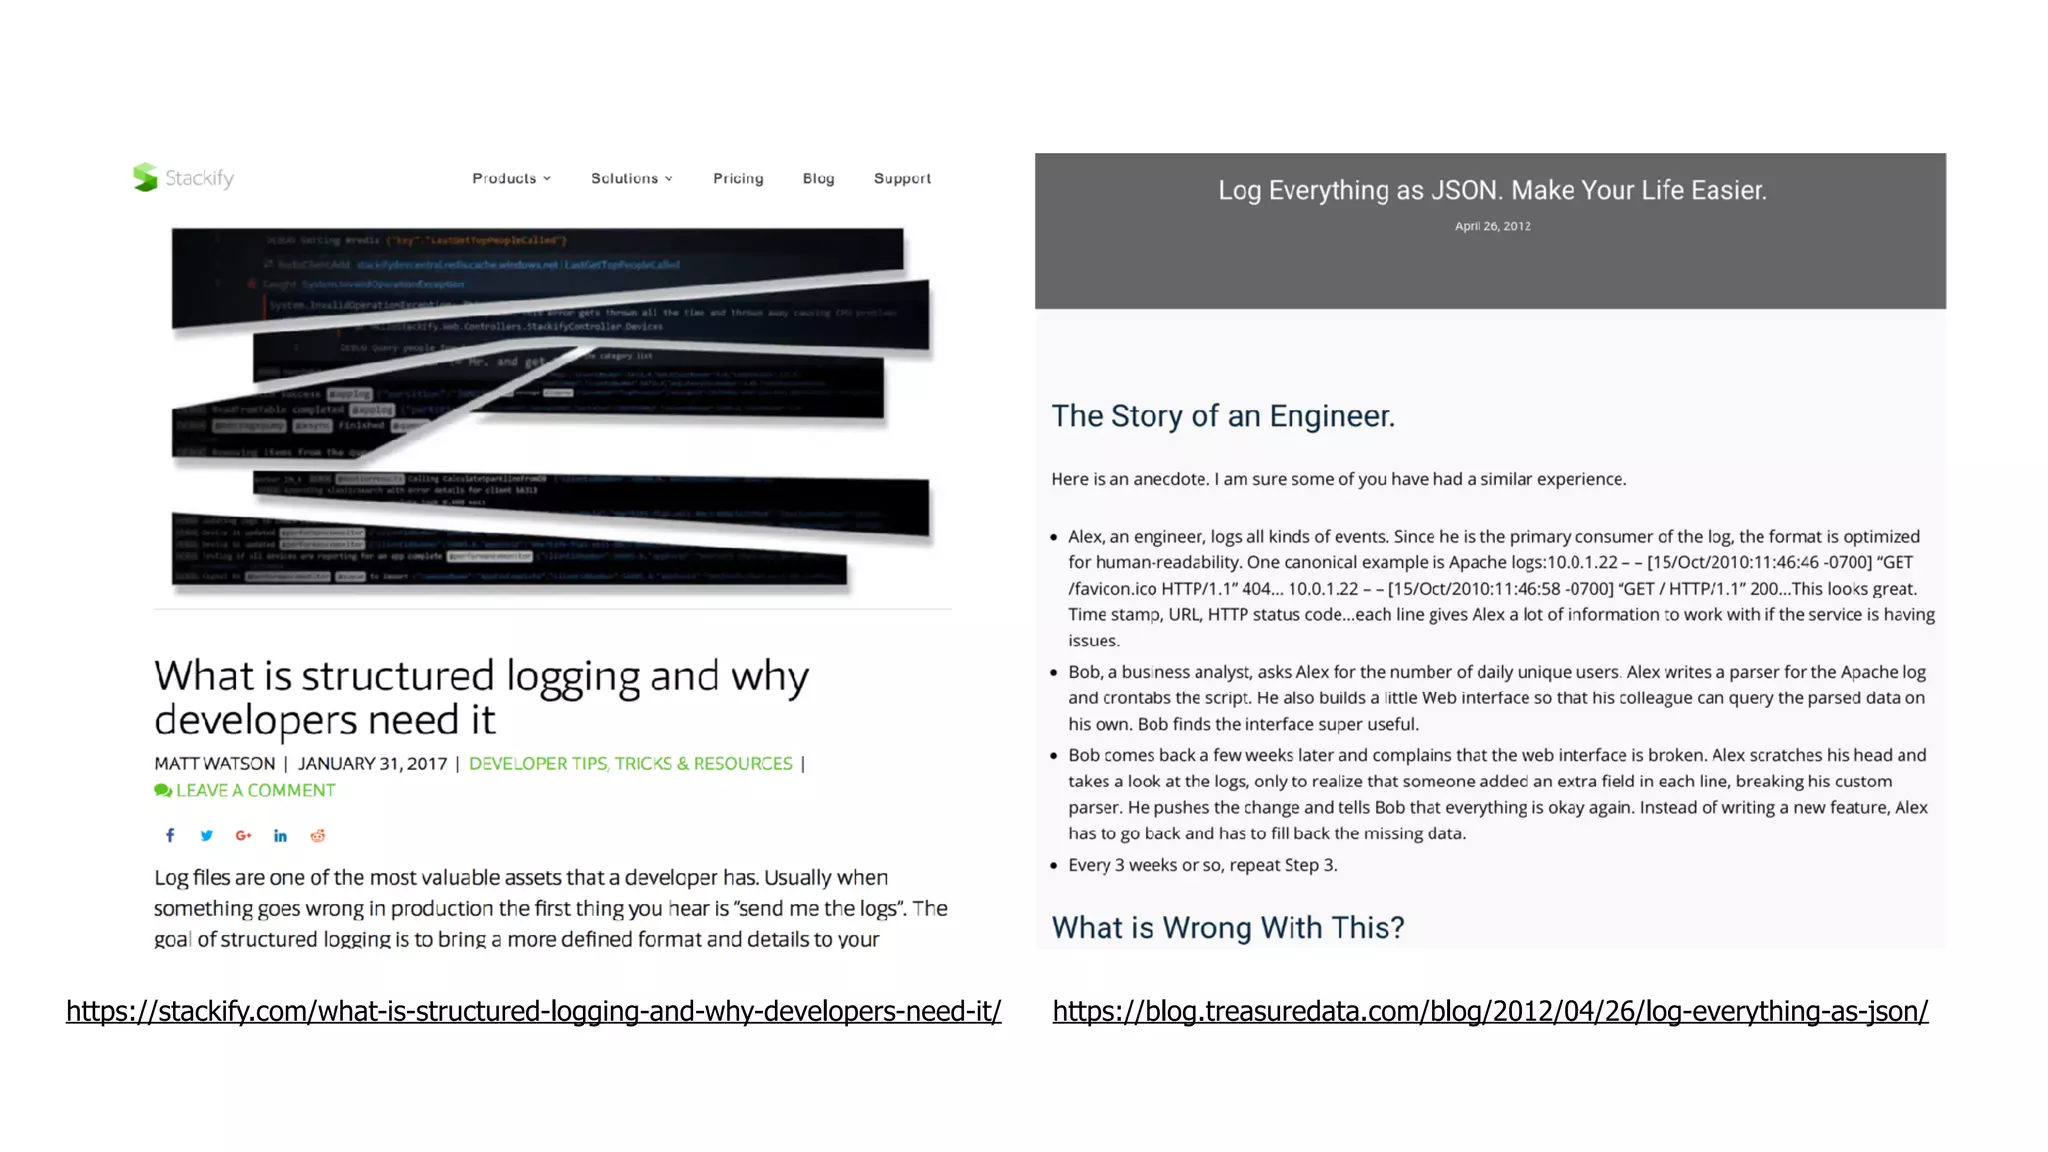
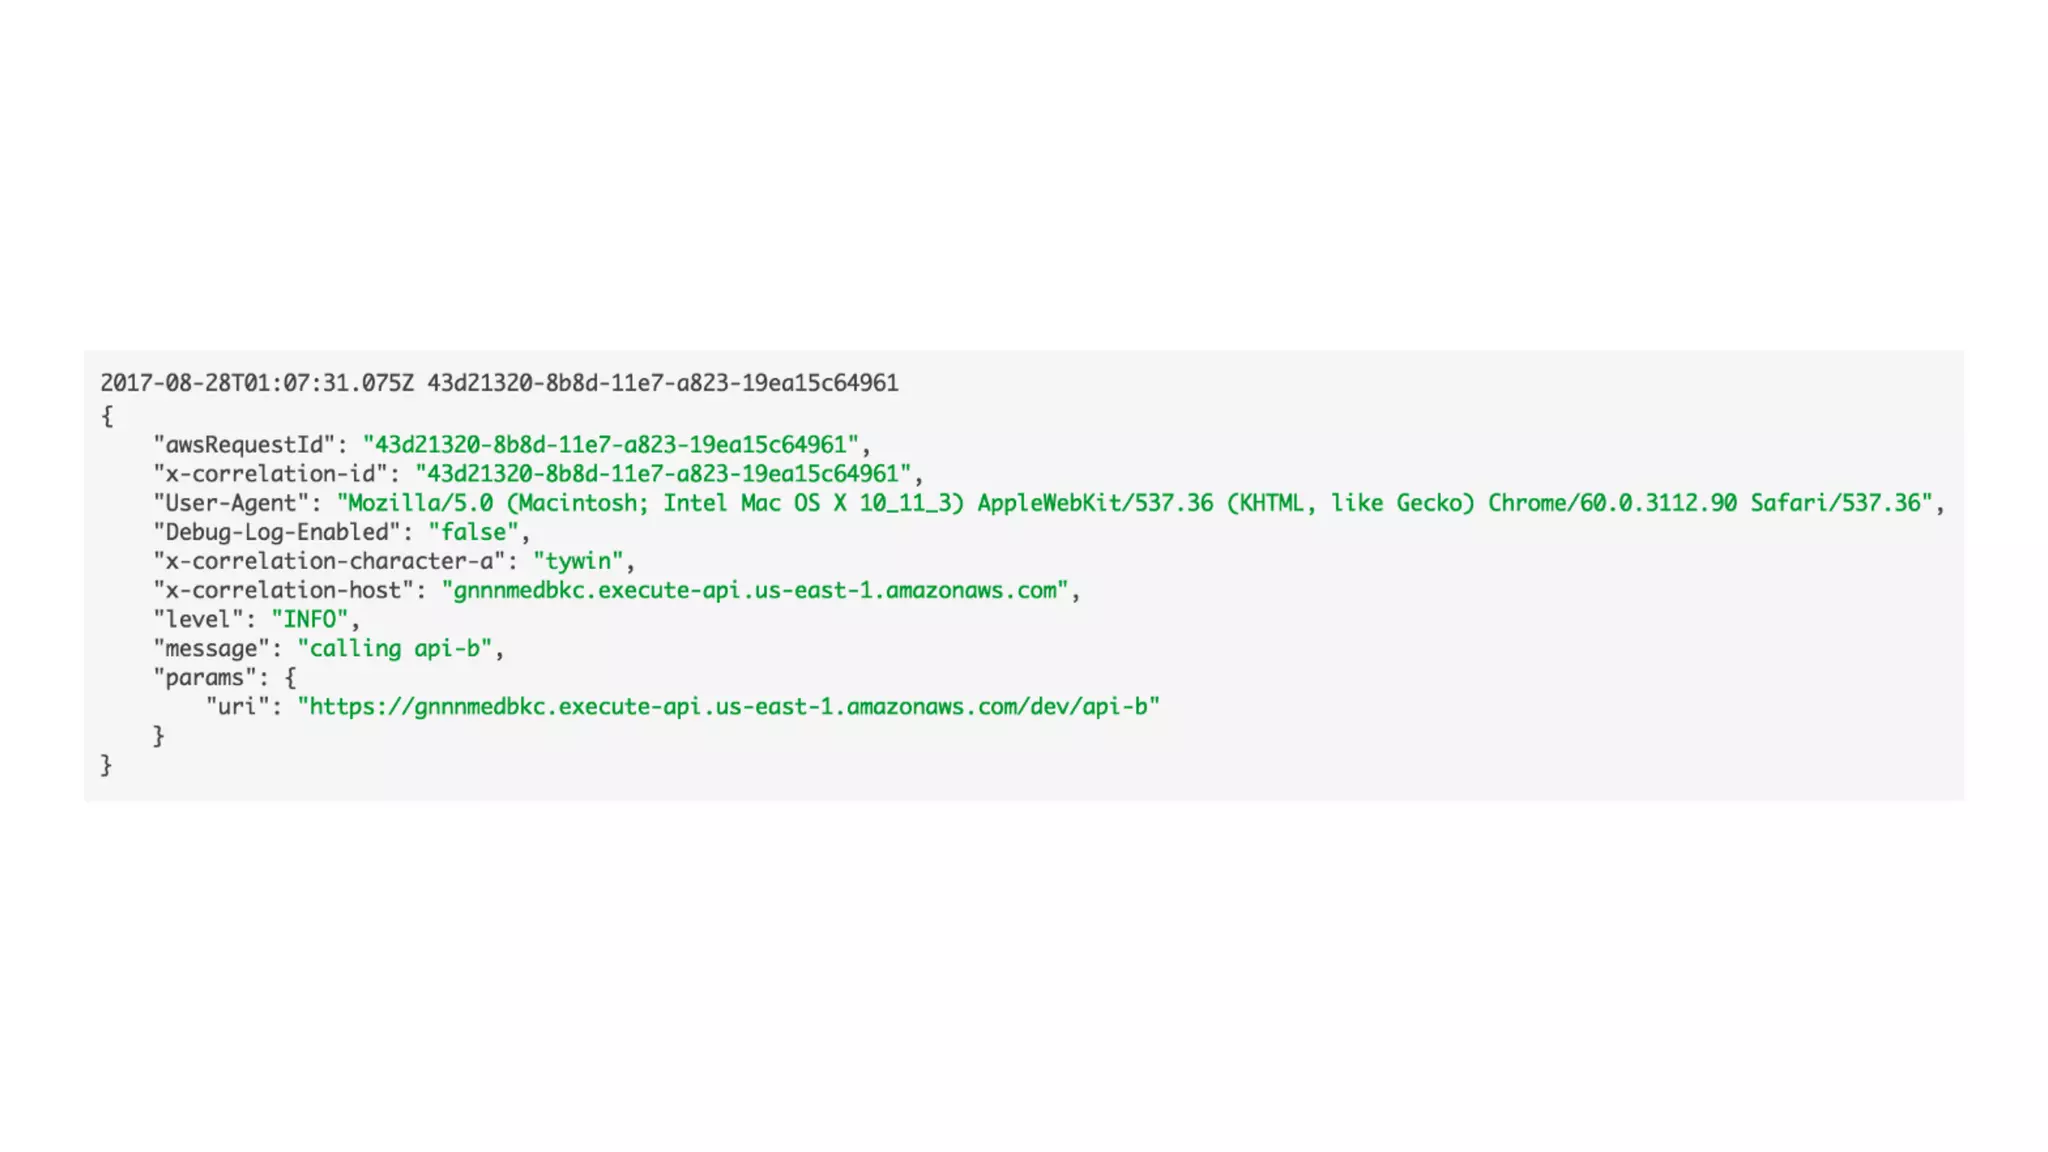
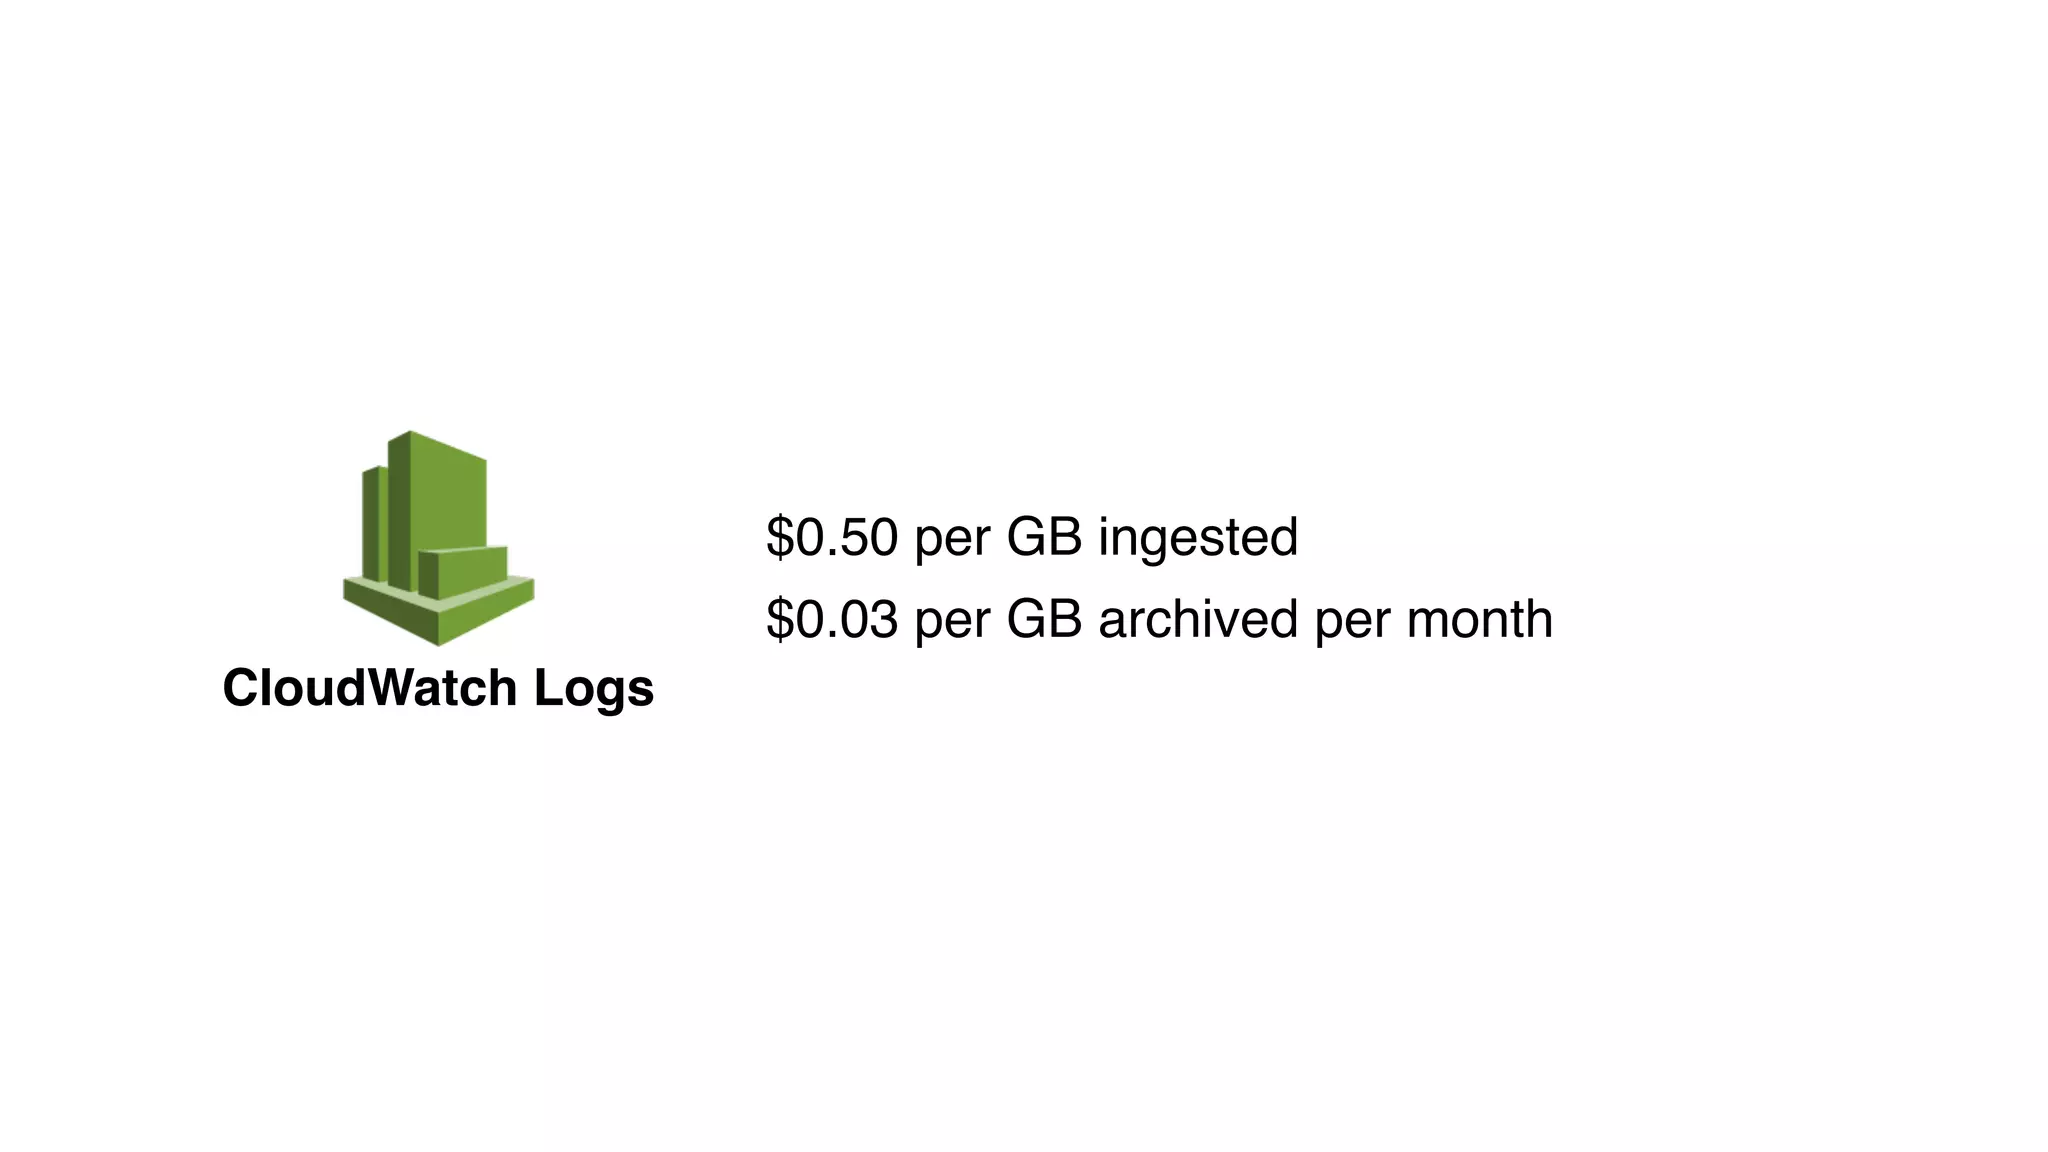
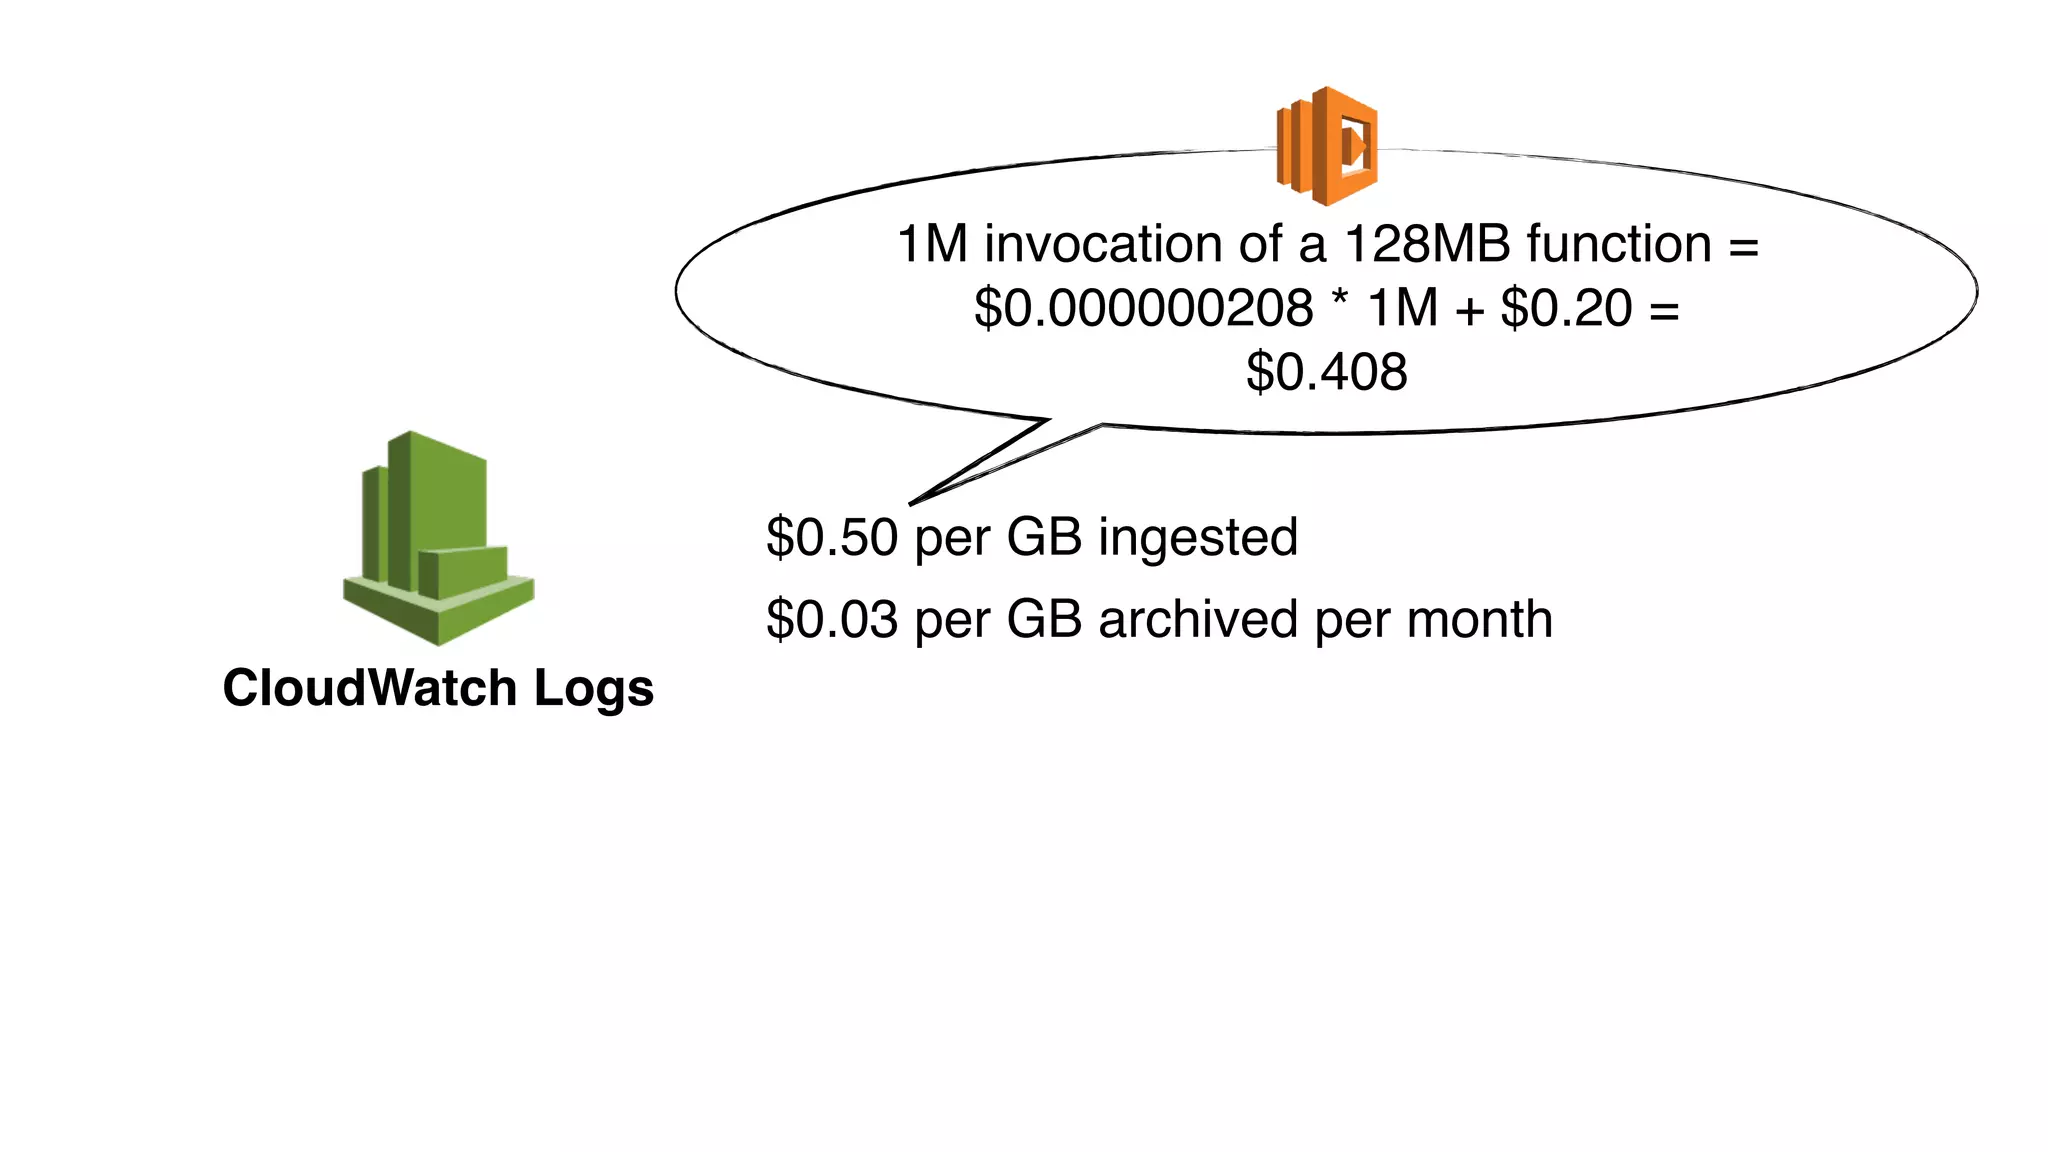
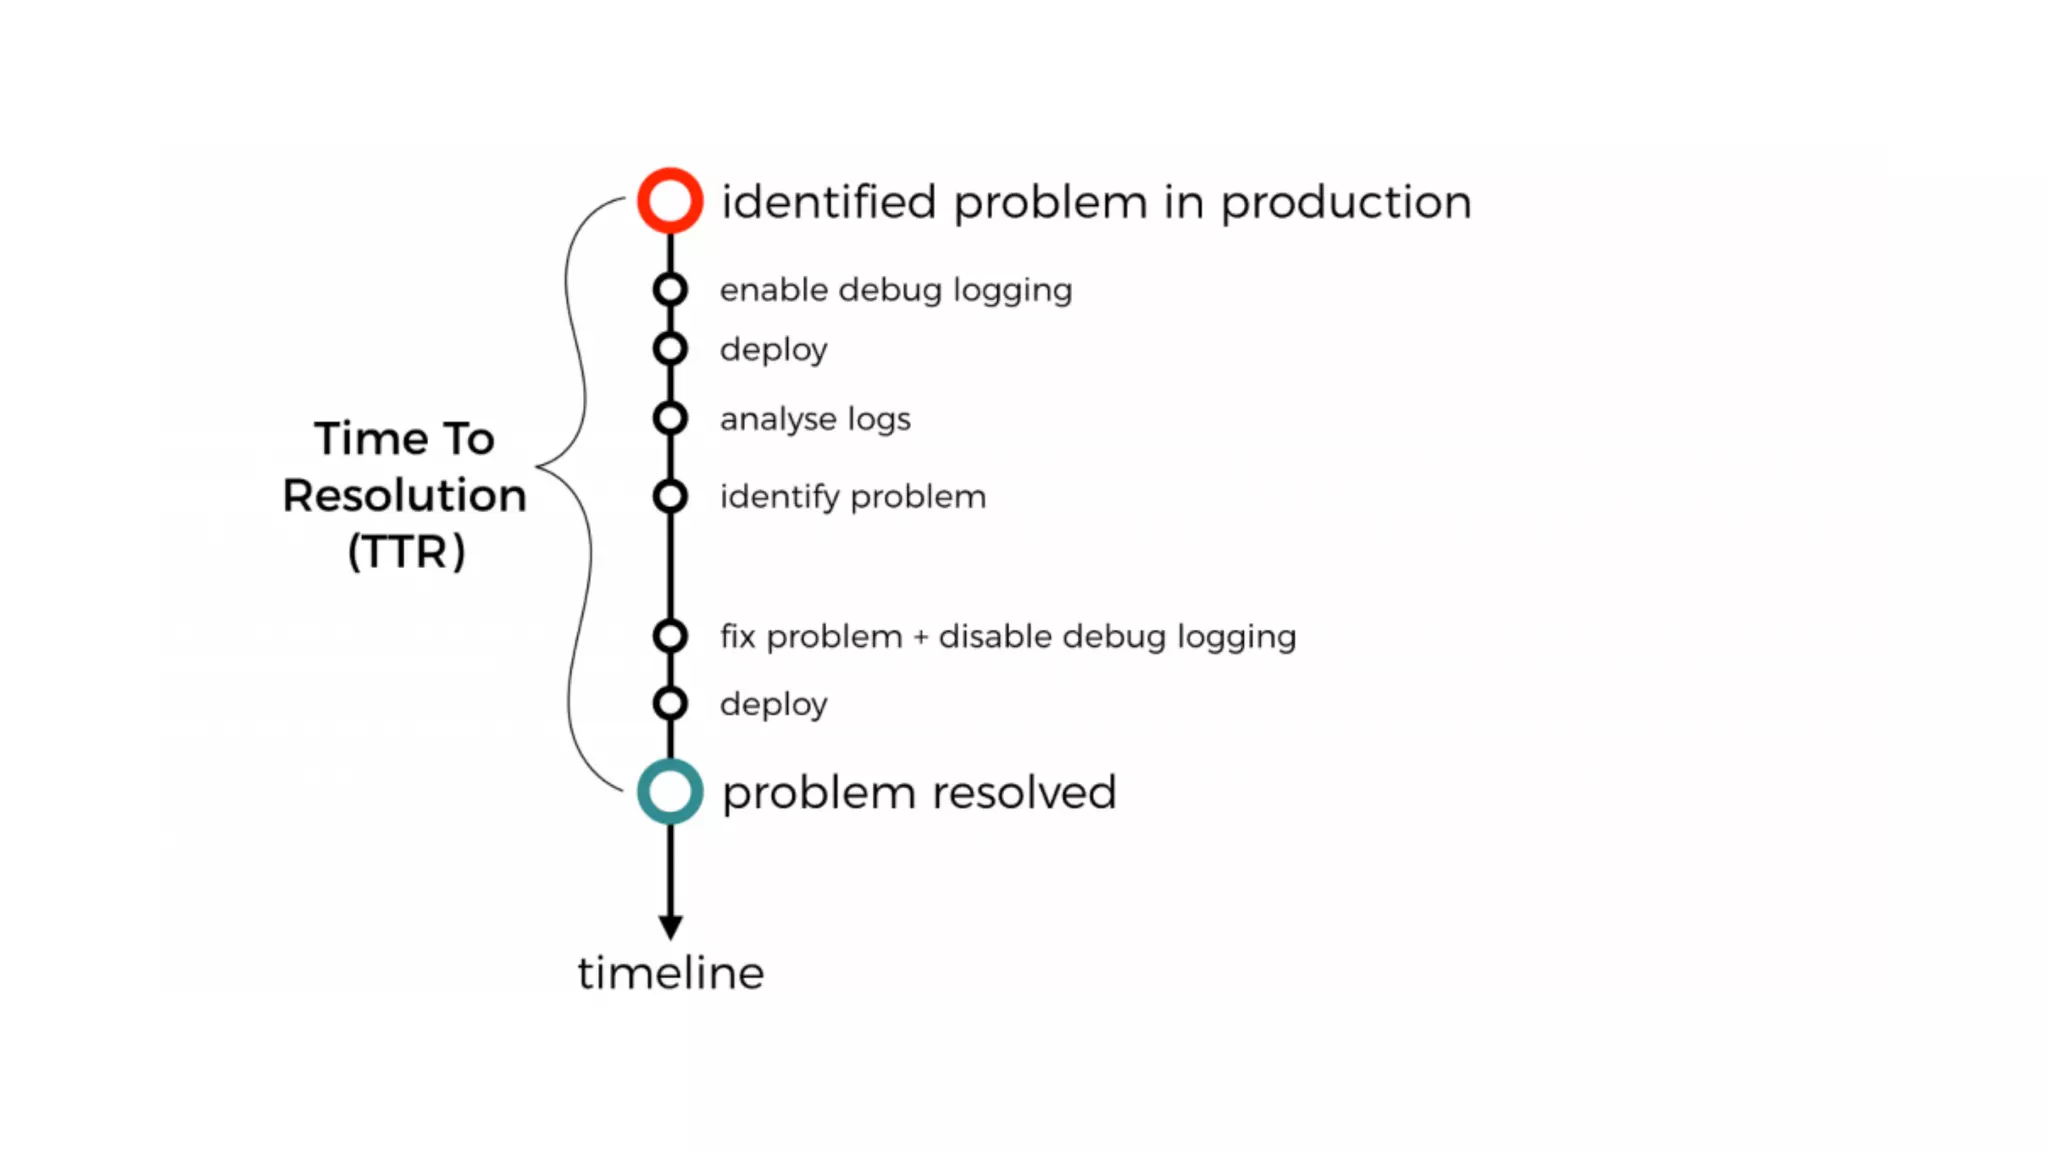
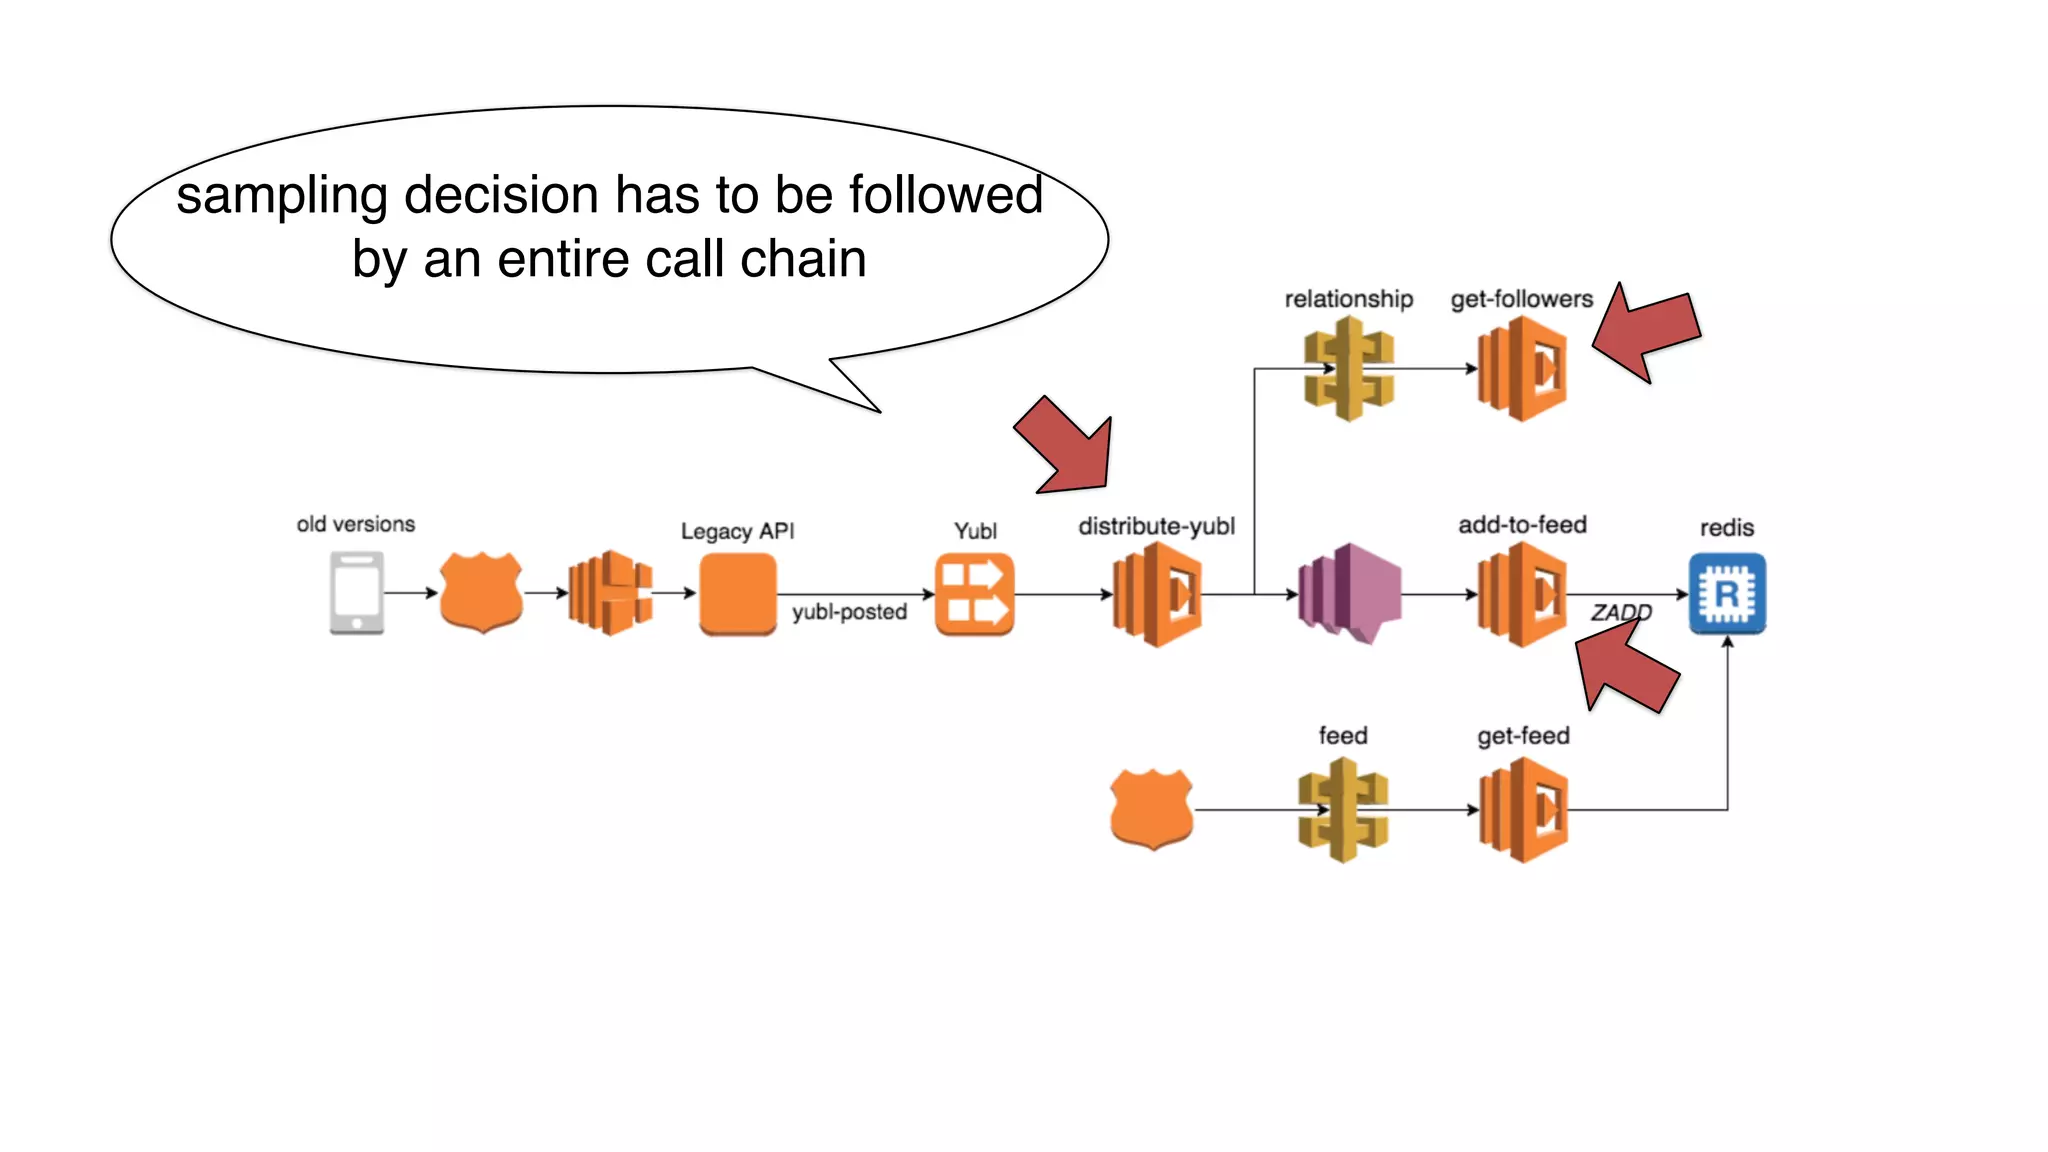
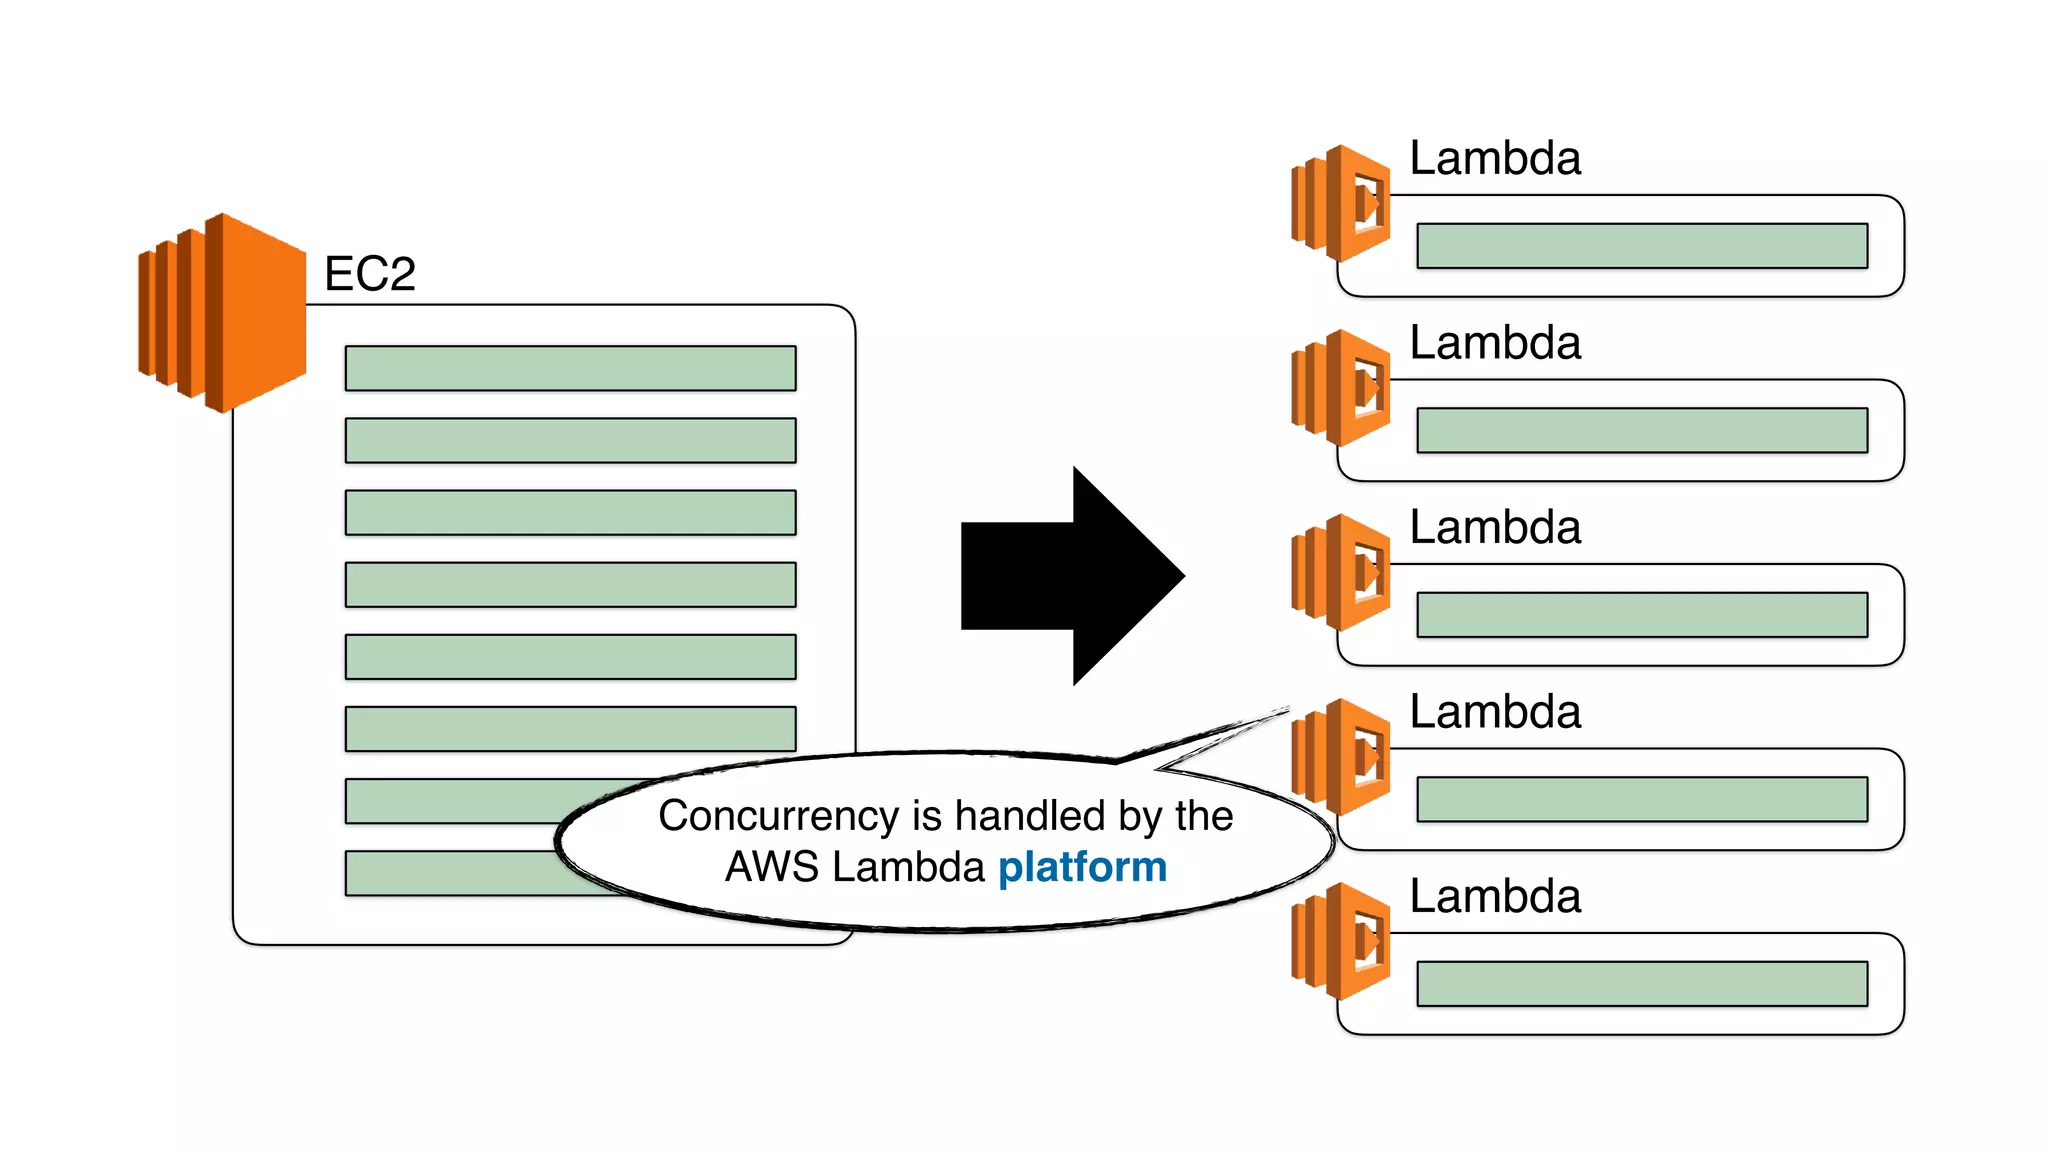
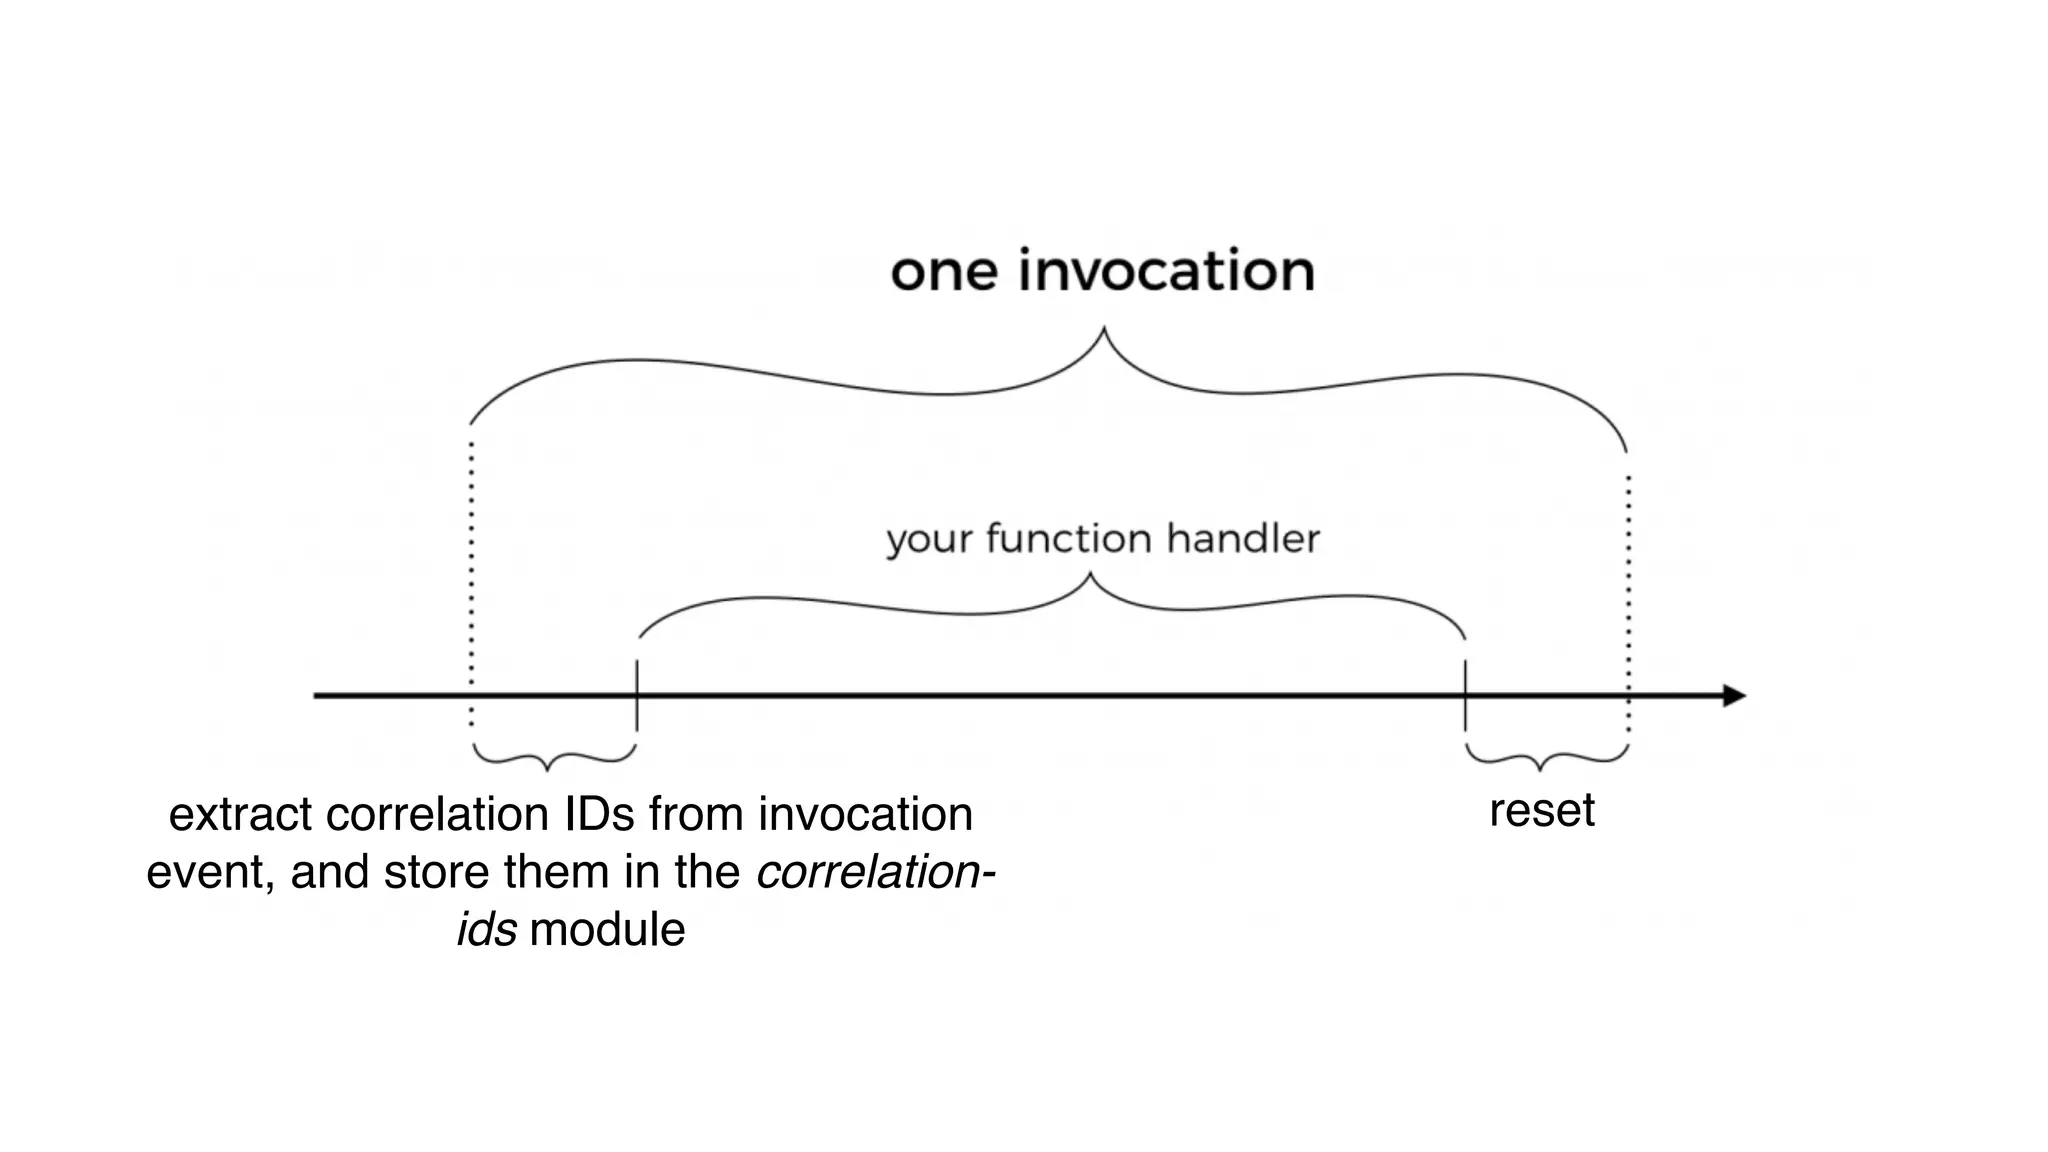
This document discusses building observability into serverless applications. It outlines challenges like not being able to install agents or do background processing in serverless functions. It then discusses approaches to implement logging, metrics, and distributed tracing in serverless using services like CloudWatch Logs, X-Ray, and structuring logs. The key is to do this with minimal overhead and in a way that works for asynchronous workflows between serverless functions.