Download to read offline


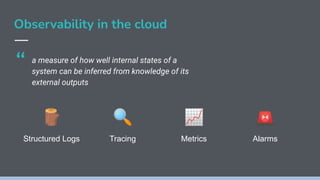


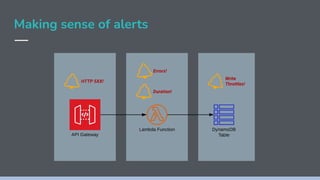


![CloudFormation for CloudWatch Alarms 😬
"Type": "AWS::CloudWatch::Alarm",
"Properties": {
"ActionsEnabled": true,
"AlarmActions": [
"arn:aws:sns:eu-west-1:665863320777:FTSLICAlarms"
],
"AlarmName": "LambdaThrottles_serverless-test-project-dev-hello",
"AlarmDescription": "Throttles % for serverless-test-project-dev-hello ..",
"EvaluationPeriods": 1,
"ComparisonOperator": "GreaterThanThreshold",
"Threshold": 0,
"TreatMissingData": "notBreaching",
"Metrics": [
{
"Id": "throttles_pc",
"Expression": "(throttles / throttles + invocations) * 100",
"Label": "% Throttles",
"ReturnData": true
},
{
"Id": "throttles",
"MetricStat": {
"Metric": {
"Namespace": "AWS/Lambda",
"MetricName": "Throttles",
"Dimensions": [
{
"Name": "FunctionName",
"Value": "serverless-test-project-dev-hello"
}
]
},
"Period": 60,
"Stat": "Sum"
},
"ReturnData": false
},
{
"Id": "invocations",
"MetricStat": {
"Metric": {
"Namespace": "AWS/Lambda",
"MetricName": "Invocations",](https://image.slidesharecdn.com/awsobservabilitymadesimplewithserverless-fourtheoerm-211112092127/85/AWS-Observability-Made-Simple-29-320.jpg)
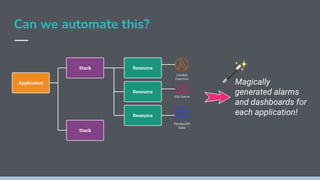
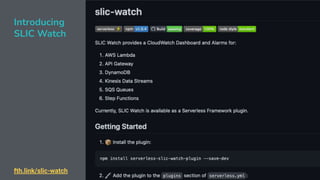
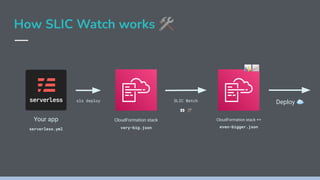


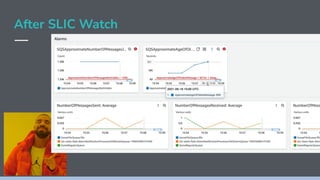


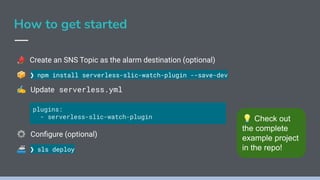


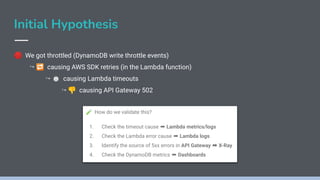
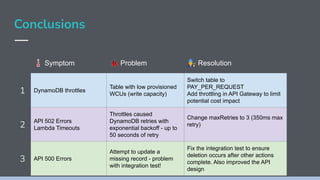
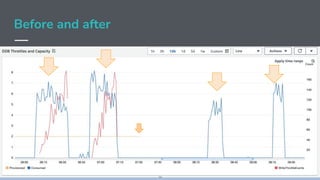
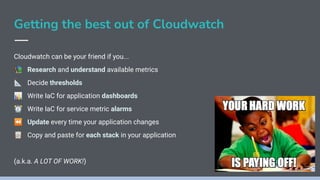
1. The document discusses observability in AWS and introduces a tool called SLIC Watch that automates the configuration of CloudWatch alarms and dashboards for serverless applications. 2. SLIC Watch generates CloudFormation templates that set up application-specific dashboards and alarms using metrics from services like Lambda, DynamoDB, and API Gateway to help operators more quickly identify issues. 3. The document provides an example of how SLIC Watch could help diagnose issues like DynamoDB throttling and Lambda timeouts by automating the creation of relevant metrics and alarms without requiring manual configuration of CloudWatch.