it is about photoelectron spectroscopy. it tells how xrays are irradiated on sample surface the secondary beam is made up of electron. the spectrum of xps consists of plot of number of electron as function of energy
X-ray Photoelectron
Spectroscopy (XPS)
Explorethe fundamentals of X-ray Photoelectron Spectroscopy
(XPS), a powerful technique used to analyze the elemental
composition and chemical states of materials.
by Javeed Akhtar
2.
Principle of XPS:
PhotoelectricEffect
XPS utilizes the photoelectric effect. When a material is irradiated
with X-rays, core-level electrons are ejected from the atom, creating
photoelectrons. The kinetic energy of these photoelectrons is
directly related to the binding energy of the electrons in the atom.
3.
Equation of X-rayPhotoelectron Spectroscopy (XPS)
XPS uses the photoelectric effect: X-ray photons eject electrons from a material's surface. The core equation is:
Ek=hν (E
− B+ϕ)
Where:
• Ek= Kinetic energy of the emitted photoelectron
• hν = Incident X-ray photon energy
• EB= Core-level electron binding energy (element-specific)
• ϕ = Spectrometer work function (constant)
Measuring Ek and knowing hν allows determination of the binding energy (EB), crucial for elemental identification
and chemical state analysis.
4.
The Photoelectric Effectin XPS
• XPS relies on the photoelectric effect: X-rays eject electrons from a material's surface.
• If a photon's energy (hν) exceeds an electron's binding energy (EB), the electron is emitted. Its kinetic energy (Ek)
is given by: Ek = hν - (EB + φ).
• Measuring Ek determines EB, identifying elements and their chemical states.
5.
Instrumentation of XPS:Key Components
X-ray Source
Generates X-rays to irradiate the
sample, which excites electrons.
Electron Analyzer
Separates the emitted electrons
based on their kinetic energy.
Detector
Measures the number of electrons
at each kinetic energy, generating
the XPS spectrum.
6.
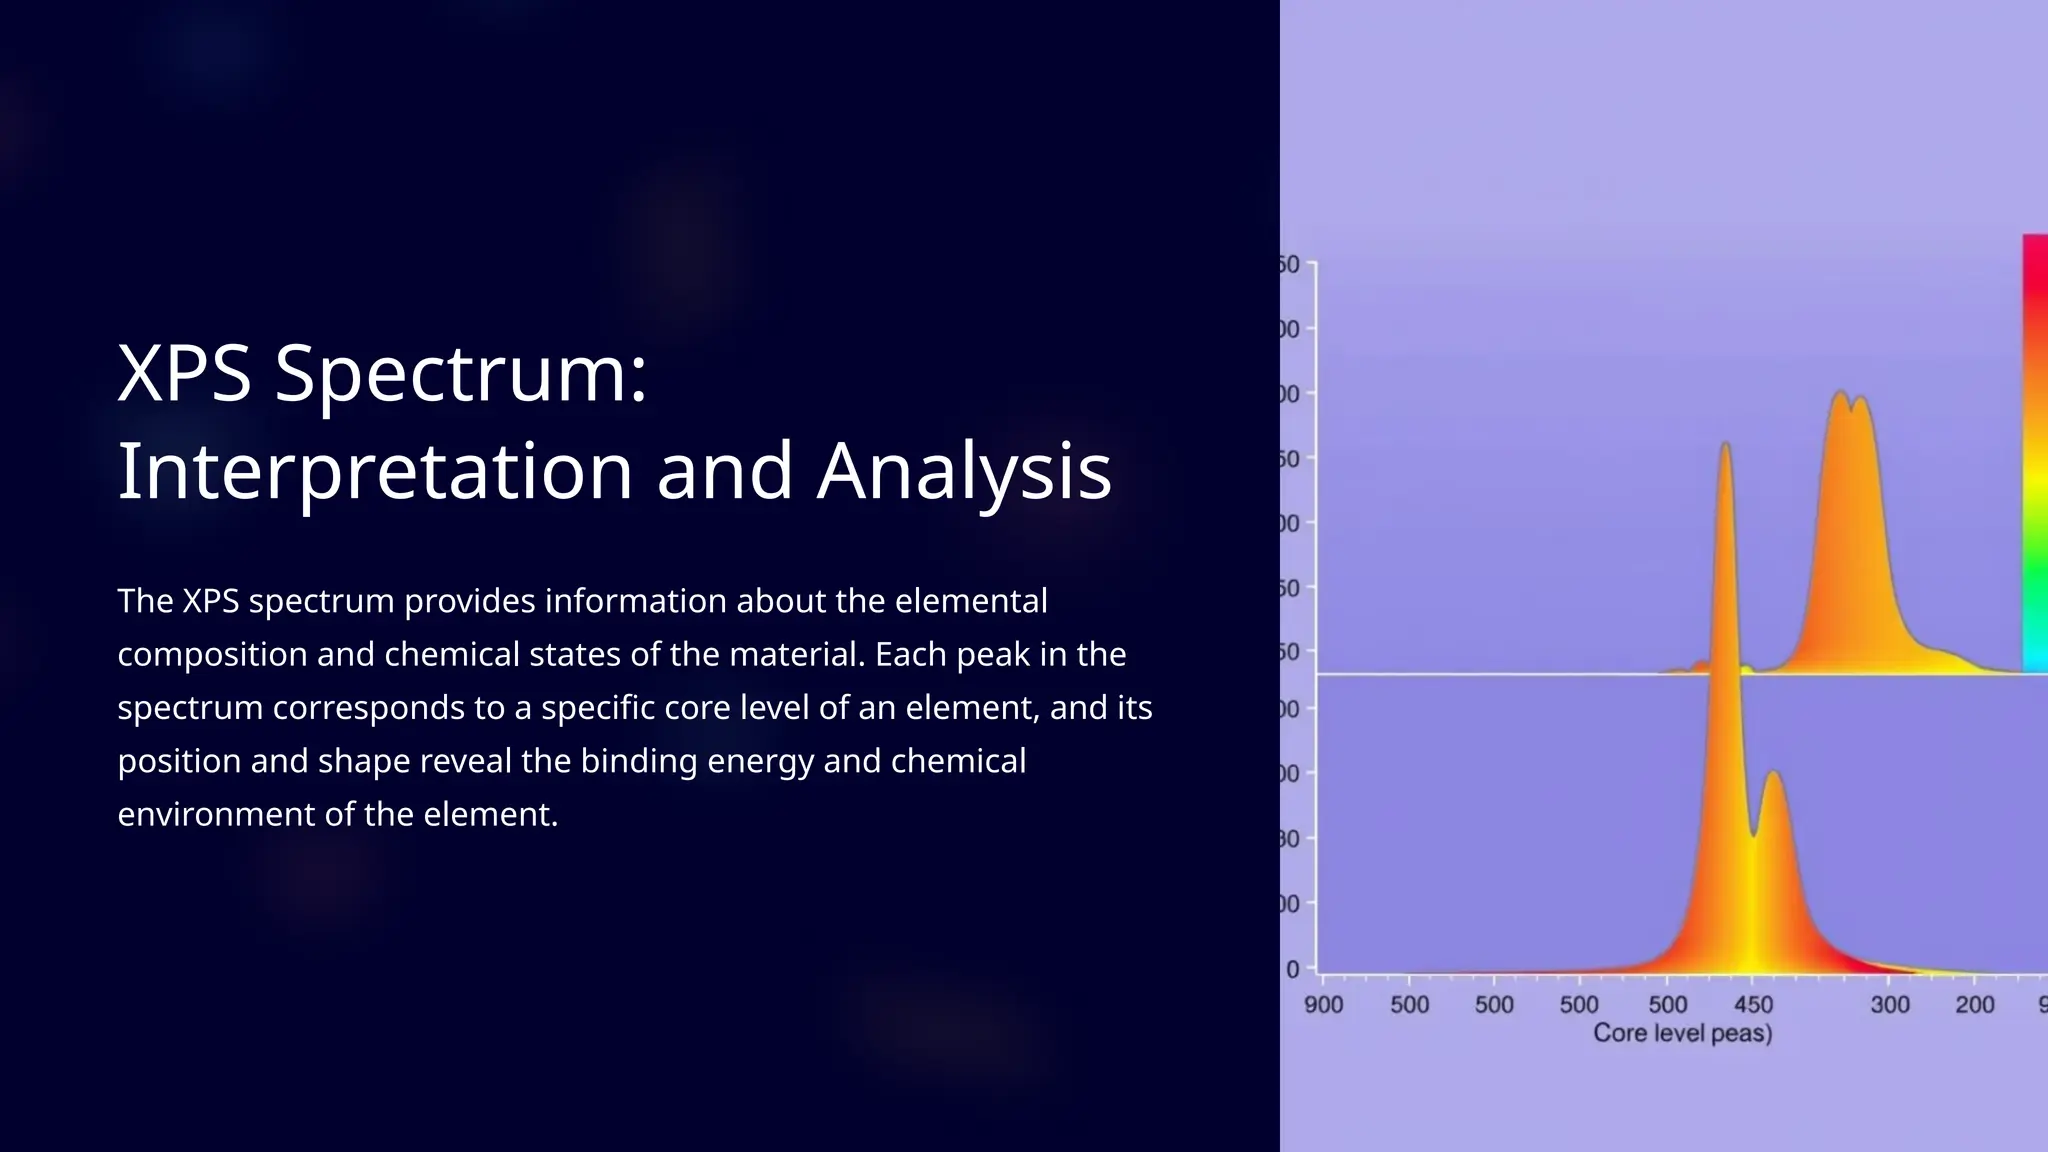
XPS Spectrum:
Interpretation andAnalysis
The XPS spectrum provides information about the elemental
composition and chemical states of the material. Each peak in the
spectrum corresponds to a specific core level of an element, and its
position and shape reveal the binding energy and chemical
environment of the element.
7.
Example 1: XPSGraph of a
Metal Surface
An XPS spectrum of a metal surface shows peaks corresponding to
the metal's core levels, indicating its elemental composition.
Chemical shifts in the peak positions can reveal the presence of
different oxidation states, providing information about the surface
chemistry of the metal.
8.
Example 2: XPSGraph of a
Semiconductor Material
The XPS spectrum of a semiconductor material reveals the
elemental composition, chemical states, and bonding environment
within the material. Analyzing the peak positions and shapes allows
for the identification of different elements and their bonding
configurations, crucial information for understanding the
semiconductor's properties.
9.
Applications of XPSin
Materials Science
XPS is widely used in materials science to study the surface
properties of various materials, including metals, ceramics,
polymers, and composites. It provides information about elemental
composition, chemical states, and bonding environments, aiding in
the development of new materials and understanding their
behavior.
10.
Limitations and FutureDirections of XPS
XPS is limited to surface analysis and is not ideal for deep-depth profiling. Future advancements are focusing on
improving sensitivity, spatial resolution, and depth profiling capabilities to further expand the application of XPS in
material characterization.
11.
XPS Data Plottingand Analysis
XPS data is typically plotted as a spectrum showing binding energy (x-axis) versus intensity (y-axis). The intensity represents the number of electrons detected at a specific
binding energy. Each peak in the spectrum corresponds to a specific core-level electron from a particular element. The peak position is directly related to the element's
binding energy, while the peak area is proportional to the concentration of that element in the sample. Peak shape and position can also reveal information about chemical
states and bonding environments.
Example 1: XPS Spectrum of a Metal Oxide
Consider an XPS spectrum of a metal oxide, such as iron oxide (Fe2O3). We would expect to observe peaks corresponding to Fe 2p, O 1s, and possibly other core levels
depending on the sample's purity. The Fe 2p peak would likely be split into multiple peaks (Fe 2p3/2 and Fe 2p1/2) due to spin-orbit coupling. The position of these peaks
would indicate the oxidation state of iron (e.g., Fe3+ in Fe2O3). The relative intensities of the Fe 2p and O 1s peaks would reflect the stoichiometry of the oxide (2:3 ratio in
Fe2O3).
Further analysis might involve curve fitting to resolve overlapping peaks and accurately determine the peak areas. This allows a quantitative determination of the elemental
composition of the sample.
Example 2: XPS Spectrum of a Polymer
A polymer sample, such as polyethylene terephthalate (PET), would exhibit a different XPS spectrum. Here we would anticipate seeing peaks corresponding to C 1s, O 1s, and
possibly other elements if additives or impurities are present. The C 1s peak might be quite broad and show multiple components due to different carbon environments
within the polymer (e.g., carbons bonded to oxygen, carbons bonded only to other carbons). The peak positions and their respective intensities can provide information about
the chemical structure and functional groups in the polymer.
Peak fitting and analysis will again be crucial for determining the relative proportions of various carbon environments and gaining information on the polymer's composition
and chemical bonding.