Writing Research Methodology
Methods:The Method tells your Research readers how you plan to
tackle your research problem. It provide your work plan and describe
the activities necessary for the completion of your project. Method
section should contain sufficient information for the reader to
determine whether methodology is sound. A good proposal should
contain sufficient details for another qualified researcher to implement
the study.
2.
RESEARCH DESIGN
• Definitionof research design
• Kerlinger, N.F (1986) defines research design as
“ The plan and structure of investigation so conceived as to obtain answers
to research questions.
It includes an outline of what the investigator will do from writing
hypotheses and their operational implications to the final analysis of data….
3.
Research Design Continue
Aresearch design expresses both the structure of
the research problem and the plan of
investigation used to obtain empirical evidence on
relations of the problem”
• Research design is the strategy and the plan for
study. It specifies the methods and procedures
for the collection, measurement, and analysis of
data.
4.
ESSENTIALS OF RESEARCHDESIGN
Research design:
• Is an activity and time-based plan
• Is always based on the research question
• Guides the selection of sources and types of
information
• Is a framework for specifying the relationships
among the study’s variables
• Outlines procedures for every research activity.
5.
MAJOR TYPES OFRESEARCH DESIGN
1. Exploratory studies
Exploration is useful when researchers lack a clear idea
of the problems they will meet during the study.
Through exploration researchers develop concepts
more clearly, establish priorities, develop operational
definitions and improve the final research design.
6.
factors of explorationstudies
• To save time and money
• If the area of investigation is new
• Important variables may not be known or thoroughly
defined
• Hypothesis for the research may be needed
• A researcher can explore to be sure if it is practical to do a
formal study in the area.
7.
2. Descriptive Studies
•It is the process of collecting data in order to test
hypotheses or to answer questions concerning the current
status of the subjects in the study. It determines and
reports the way things are. Provides answers to questions
like Who? What? When? Where? How? It attempts to
describe such things as possible behaviour, attitudes,
values and characteristics.
8.
3. Causal Research
CausalResearch : It is used to explore relationships between variables. It
determines reasons or causes for the current status of the phenomenon under
study. The variables of interest cannot be manipulated unlike in experimental
research.
• Advantages of causal study
• Allows a comparison of groups without having to manipulate the independent
variables
• It can be done solely to identify variables worthy of experimental investigation
• They are relatively cheap.
9.
Disadvantages of causalstudy
• Interpretations are limited because the researcher does not
know whether a particular variable is a cause or result of a
behaviour being studied.
• There may be a third variable which could be affecting the
established relationship but which may not be established in
the study.
10.
4. Correlation Methods
•It describes in quantitative terms the degree to which variables are related. It
explores relationships between variables and also tries to predict a subject’s
score on one variable given his or her score on another variable.
Advantages of the correlational method
• Permits one to analyse inter-relationships among a large number of variables in
a single study.
• Allows one to analyse how several variables either singly or in combination might
affect a particular phenomenon being studied.
• The method provides information concerning the degree of relationship between
variables being studied.
11.
Disadvantages of thecorrelational method
• Correlation between two variables does not necessarily
imply causation although researchers often tend to
interpret such a relationship to mean causation.
• Since the correlation coefficient is an index, any two
variables will always show a relationship even when
commonsense dictates that such variables are not
related.
• The correlation coefficient is very sensitive to the size
of the sample.
12.
THE SAMPLE DESIGN
•It refers to the techniques of the procedure the researcher would adopt in selecting
items for the sample.
Factors to consider in developing a sample design
• Type of universe; finite or infinite
• Sampling unit; geographic: state, district or village, construction unit: house, flat.
Social unit: family, club, school or individual.
• Source list: sampling frame- contains all the names of all items of a universe. The
list should be comprehensive, correct, reliable and appropriate.
• The size of the sample. Should be efficient, representative, reliable and flexible.
• Parameters of interest
• Budgetary constraint
• Sampling procedure.
13.
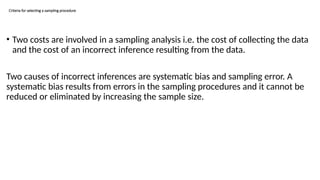
Criteria for selectinga sampling procedure
• Two costs are involved in a sampling analysis i.e. the cost of collecting the data
and the cost of an incorrect inference resulting from the data.
Two causes of incorrect inferences are systematic bias and sampling error. A
systematic bias results from errors in the sampling procedures and it cannot be
reduced or eliminated by increasing the sample size.
14.
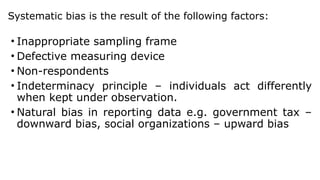
Systematic bias isthe result of the following factors:
• Inappropriate sampling frame
• Defective measuring device
• Non-respondents
• Indeterminacy principle – individuals act differently
when kept under observation.
• Natural bias in reporting data e.g. government tax –
downward bias, social organizations – upward bias
15.
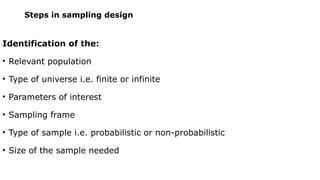
Steps in samplingdesign
Identification of the:
• Relevant population
• Type of universe i.e. finite or infinite
• Parameters of interest
• Sampling frame
• Type of sample i.e. probabilistic or non-probabilistic
• Size of the sample needed
16.
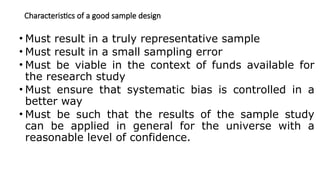
Characteristics of agood sample design
• Must result in a truly representative sample
• Must result in a small sampling error
• Must be viable in the context of funds available for
the research study
• Must ensure that systematic bias is controlled in a
better way
• Must be such that the results of the sample study
can be applied in general for the universe with a
reasonable level of confidence.
17.
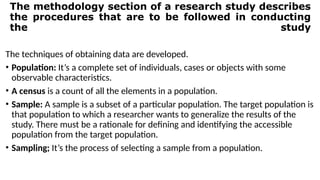
The methodology sectionof a research study describes
the procedures that are to be followed in conducting
the study
The techniques of obtaining data are developed.
• Population: It’s a complete set of individuals, cases or objects with some
observable characteristics.
• A census is a count of all the elements in a population.
• Sample: A sample is a subset of a particular population. The target population is
that population to which a researcher wants to generalize the results of the
study. There must be a rationale for defining and identifying the accessible
population from the target population.
• Sampling; It’s the process of selecting a sample from a population.
18.
Reasons for sampling
•Cost
•Time:Greater speed of data collection
•Destructive nature of certain tests
•Greater accuracy of results
•Physical impossibility of checking all items in the
population.
•Availability of population elements.
19.
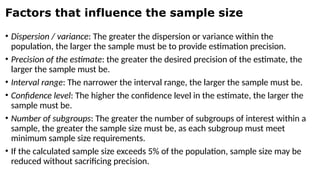
Factors that influencethe sample size
• Dispersion / variance: The greater the dispersion or variance within the
population, the larger the sample must be to provide estimation precision.
• Precision of the estimate: the greater the desired precision of the estimate, the
larger the sample must be.
• Interval range: The narrower the interval range, the larger the sample must be.
• Confidence level: The higher the confidence level in the estimate, the larger the
sample must be.
• Number of subgroups: The greater the number of subgroups of interest within a
sample, the greater the sample size must be, as each subgroup must meet
minimum sample size requirements.
• If the calculated sample size exceeds 5% of the population, sample size may be
reduced without sacrificing precision.
20.
Sampling procedures:
There aretwo major ways of selecting
samples
•Probability sampling methods
•Non - Probability sampling methods
21.
Probability Sampling Methods
Samplesare selected in such a way that
each item or person in the population
has a known (Nonzero) likelihood of
being included in the sample.
22.
Types of Probabilitysampling methods
1. Simple Random Sampling:
• A sample is selected so that each item or person in the population has the
same chance of being included.
• Advantages
• Easy to implement with automatic dialling and with computerized voice
response systems
• Disadvantages
• Requires a listing of population elements.
• Takes more time to implement
• Uses larger sample sizes
• Produces larger errors
• Expensive
23.
2. Systematic RandomSampling
• The items or individuals of the population are arranged in some manner. A
random starting point is selected and then every kth
member of the
population is selected for the sample.
• Advantages
• Simple to design
• Easier to use than the simple random.
• Easy to determine sampling distribution of mean or proportion.
• Less expensive than simple random.
• Disadvantages
• Periodicity within the population may skew the sample and results.
• If the population list has a monotonic trend, a biased estimate will result
based on the start point.
24.
3. Stratified RandomSampling:
• A population is divided into subgroups called strata and a sample is selected
from each stratum. After the population is divided into strata, either a
proportional or a non-proportional sample can be selected. In a proportional
sample, the number of items in each stratum is in the same proportion as in
the population while in a non-proportional sample, the number of items chosen
in each stratum is disproportionate to the respective numbers in the population.
• Advantages
• Researcher controls sample size in strata
• Increased statistical efficiency
• Provides data to represent and analyse subgroups.
• Enables use of different methods in strata.
•
• Disadvantages
• Increased error will result if subgroups are selected at different rates
• Expensive especially if strata on the population have to be created.
25.
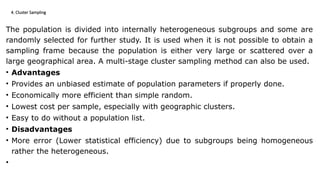
4. Cluster Sampling
Thepopulation is divided into internally heterogeneous subgroups and some are
randomly selected for further study. It is used when it is not possible to obtain a
sampling frame because the population is either very large or scattered over a
large geographical area. A multi-stage cluster sampling method can also be used.
• Advantages
• Provides an unbiased estimate of population parameters if properly done.
• Economically more efficient than simple random.
• Lowest cost per sample, especially with geographic clusters.
• Easy to do without a population list.
• Disadvantages
• More error (Lower statistical efficiency) due to subgroups being homogeneous
rather the heterogeneous.
•
26.
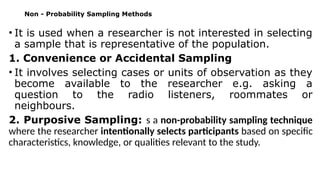
Non - ProbabilitySampling Methods
• It is used when a researcher is not interested in selecting
a sample that is representative of the population.
1. Convenience or Accidental Sampling
• It involves selecting cases or units of observation as they
become available to the researcher e.g. asking a
question to the radio listeners, roommates or
neighbours.
2. Purposive Sampling: s a non-probability sampling technique
where the researcher intentionally selects participants based on specific
characteristics, knowledge, or qualities relevant to the study.
27.
Example of Purposive
•A researcher studying the challenges of female school
principals may purposively select:
• Female principals
• With at least 5 years of experience
• In urban and rural schools
• These participants can provide deep insight relevant
to the research.
28.
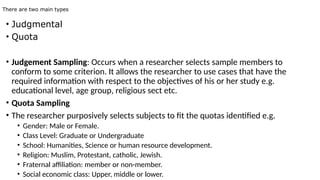
There are twomain types
• Judgmental
• Quota
• Judgement Sampling: Occurs when a researcher selects sample members to
conform to some criterion. It allows the researcher to use cases that have the
required information with respect to the objectives of his or her study e.g.
educational level, age group, religious sect etc.
• Quota Sampling
• The researcher purposively selects subjects to fit the quotas identified e.g.
• Gender: Male or Female.
• Class Level: Graduate or Undergraduate
• School: Humanities, Science or human resource development.
• Religion: Muslim, Protestant, catholic, Jewish.
• Fraternal affiliation: member or non-member.
• Social economic class: Upper, middle or lower.
29.
3. Snow ballsampling
• It is used when the population that possesses
the characteristics under study is not well
known and can be best located through referral
networks. Initial subjects are identified who in
turn identify others. Commonly used in drug
cultures, teenage gang activities, Mungiki sect,
insider trading, Mau Mau etc.
30.
Sampling error
•It’s thedifference between a sample
statistic and its corresponding population
parameter. The sampling distribution of the
sample means is a probability distribution of
possible sample means of a given sample
size.
31.
• Sample sizeis the number of units, individuals, or observations selected from a
population for a study. It determines the accuracy, reliability, and
generalizability of your research findings.
A larger sample usually → more accurate estimates
A smaller sample → less accuracy, more sampling error. This mean that when
you take a small sample size, the information you collect represents only a small
portion of the population. Because of this, the sample results are more likely to
differ from the true population value.
• This difference between the sample result and the true population value is
called sampling error.
Sample Size
32.
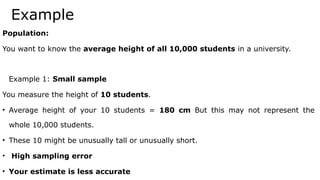
Example
Population:
You want toknow the average height of all 10,000 students in a university.
Example 1: Small sample
You measure the height of 10 students.
• Average height of your 10 students = 180 cm But this may not represent the
whole 10,000 students.
• These 10 might be unusually tall or unusually short.
• High sampling error
• Your estimate is less accurate
33.
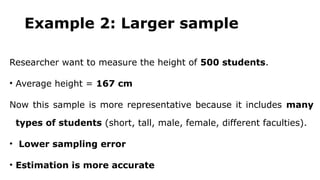
Example 2: Largersample
Researcher want to measure the height of 500 students.
• Average height = 167 cm
Now this sample is more representative because it includes many
types of students (short, tall, male, female, different faculties).
• Lower sampling error
• Estimation is more accurate
34.
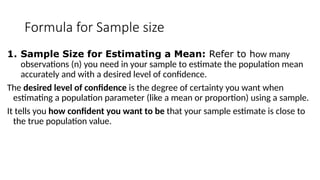
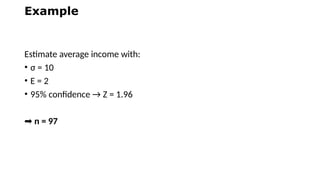
Formula for Samplesize
1. Sample Size for Estimating a Mean: Refer to how many
observations (n) you need in your sample to estimate the population mean
accurately and with a desired level of confidence.
The desired level of confidence is the degree of certainty you want when
estimating a population parameter (like a mean or proportion) using a sample.
It tells you how confident you want to be that your sample estimate is close to
the true population value.
35.
Formula
• Where:
• =Z-value for confidence level (1.96 for 95%)
• = standard deviation
• = margin of error
36.
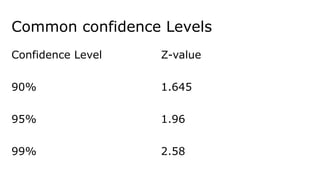
Example
• If aresearch took 100 different samples, about 95 of those
samples would give an estimate close to the true population
value.
• If you choose 99% confidence, it means:
• Researcher want to be even more certain (99 out of 100
times) that your estimate is correct.
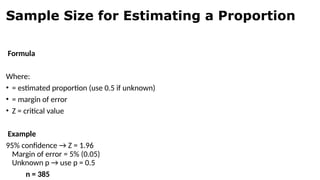
Sample Size forEstimating a Proportion
Formula
Where:
• = estimated proportion (use 0.5 if unknown)
• = margin of error
• Z = critical value
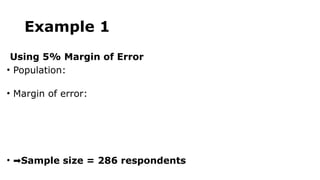
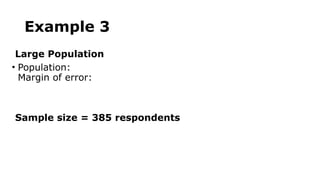
Example
95% confidence → Z = 1.96
Margin of error = 5% (0.05)
Unknown p → use p = 0.5
n = 385
40.
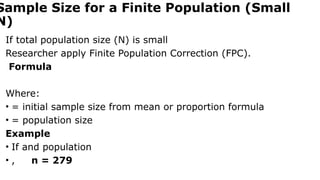
Sample Size fora Finite Population (Small
N)
If total population size (N) is small
Researcher apply Finite Population Correction (FPC).
Formula
Where:
• = initial sample size from mean or proportion formula
• = population size
Example
• If and population
• , n = 279
41.
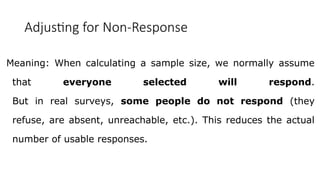
Adjusting for Non-Response
Meaning:When calculating a sample size, we normally assume
that everyone selected will respond.
But in real surveys, some people do not respond (they
refuse, are absent, unreachable, etc.). This reduces the actual
number of usable responses.
42.
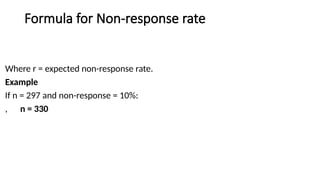
Formula for Non-responserate
Where r = expected non-response rate.
Example
If n = 297 and non-response = 10%:
, n = 330
43.
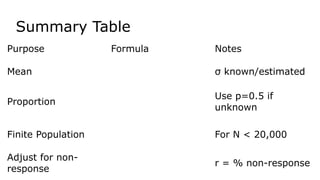
Summary Table
Purpose FormulaNotes
Mean σ known/estimated
Proportion
Use p=0.5 if
unknown
Finite Population For N < 20,000
Adjust for non-
response
r = % non-response
44.
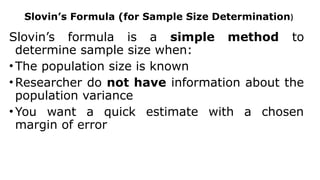
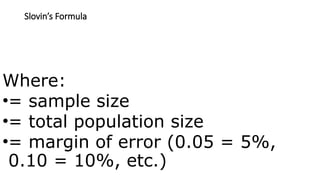
Slovin’s Formula (forSample Size Determination)
Slovin’s formula is a simple method to
determine sample size when:
• The population size is known
• Researcher do not have information about the
population variance
• You want a quick estimate with a chosen
margin of error
Data Collection Toolsand Techniques
DATA COLLECTION TOOLS AND TECHNIQUES
Data collection is the process of gathering information for research.
The tools and techniques you choose depend on the research objectives,
type of data, and study design.
50.
Types of Data
•Primary Data – collected first-hand by the researcher
Examples: survey responses, interviews, observations
• Secondary Data – collected from existing sources
Examples: books, journals, reports, official statistics
51.
Data Collection Tools
•These are instruments used to gather data:
A. Questionnaires
• A structured set of questions
• Can be open-ended (qualitative) or closed-ended (quantitative)
• Can be self-administered or distributed online
• Advantages: Easy to administer, cost-effective, can reach many
respondents
Disadvantages: May have low response rates, misinterpretation of
questions
52.
B. Interview Guides
•Structured, semi-structured, or unstructured
• Conducted face-to-face, by phone, or online
• Useful for in-depth understanding
• Advantages: Detailed responses, clarifications possible
• Disadvantages: Time-consuming, requires skilled interviewer
53.
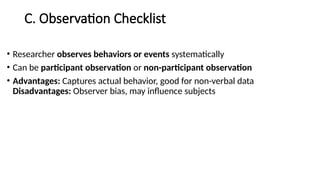
C. Observation Checklist
•Researcher observes behaviors or events systematically
• Can be participant observation or non-participant observation
• Advantages: Captures actual behavior, good for non-verbal data
Disadvantages: Observer bias, may influence subjects
54.
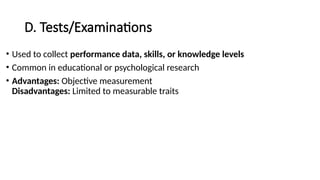
D. Tests/Examinations
• Usedto collect performance data, skills, or knowledge levels
• Common in educational or psychological research
• Advantages: Objective measurement
Disadvantages: Limited to measurable traits
55.
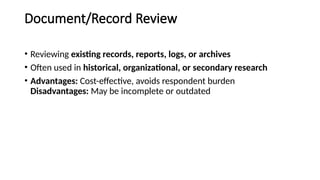
Document/Record Review
• Reviewingexisting records, reports, logs, or archives
• Often used in historical, organizational, or secondary research
• Advantages: Cost-effective, avoids respondent burden
Disadvantages: May be incomplete or outdated
56.
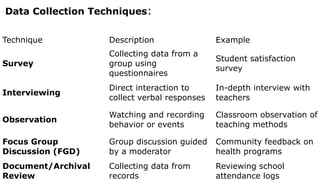
Data Collection Techniques:
TechniqueDescription Example
Survey
Collecting data from a
group using
questionnaires
Student satisfaction
survey
Interviewing
Direct interaction to
collect verbal responses
In-depth interview with
teachers
Observation
Watching and recording
behavior or events
Classroom observation of
teaching methods
Focus Group
Discussion (FGD)
Group discussion guided
by a moderator
Community feedback on
health programs
Document/Archival
Review
Collecting data from
records
Reviewing school
attendance logs
57.
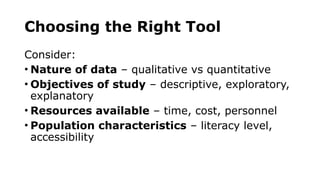
Choosing the RightTool
Consider:
• Nature of data – qualitative vs quantitative
• Objectives of study – descriptive, exploratory,
explanatory
• Resources available – time, cost, personnel
• Population characteristics – literacy level,
accessibility
58.
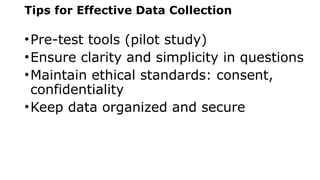
Tips for EffectiveData Collection
•Pre-test tools (pilot study)
•Ensure clarity and simplicity in questions
•Maintain ethical standards: consent,
confidentiality
•Keep data organized and secure
59.
DATA ANALYSIS ANDFINDINGS
This chapter presents the analysis of collected data and
the results/findings of your study. It demonstrates how
your research objectives or questions are answered.
60.
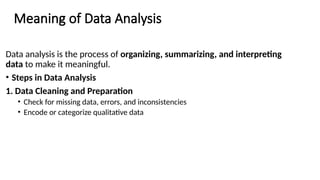
Meaning of DataAnalysis
Data analysis is the process of organizing, summarizing, and interpreting
data to make it meaningful.
• Steps in Data Analysis
1. Data Cleaning and Preparation
• Check for missing data, errors, and inconsistencies
• Encode or categorize qualitative data
61.
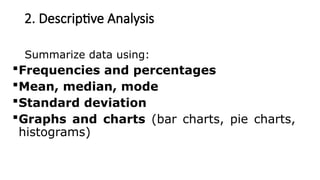
2. Descriptive Analysis
Summarizedata using:
Frequencies and percentages
Mean, median, mode
Standard deviation
Graphs and charts (bar charts, pie charts,
histograms)
62.
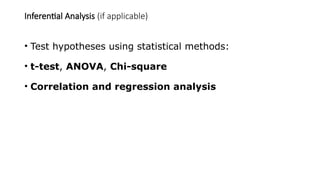
Inferential Analysis (ifapplicable)
• Test hypotheses using statistical methods:
• t-test, ANOVA, Chi-square
• Correlation and regression analysis
63.
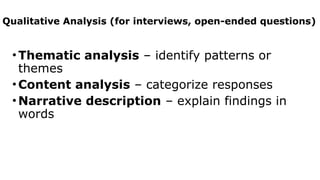
Qualitative Analysis (forinterviews, open-ended questions)
•Thematic analysis – identify patterns or
themes
•Content analysis – categorize responses
•Narrative description – explain findings in
words
64.
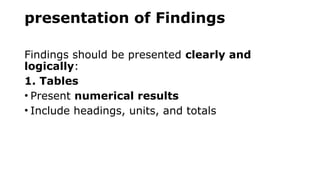
presentation of Findings
Findingsshould be presented clearly and
logically:
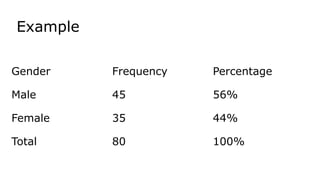
1. Tables
• Present numerical results
• Include headings, units, and totals
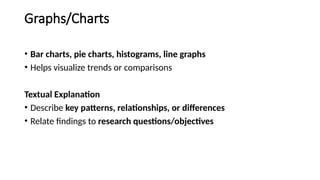
Graphs/Charts
• Bar charts,pie charts, histograms, line graphs
• Helps visualize trends or comparisons
Textual Explanation
• Describe key patterns, relationships, or differences
• Relate findings to research questions/objectives
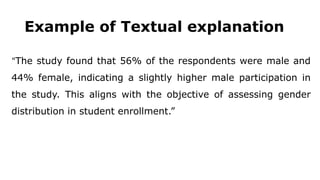
Example of Textualexplanation
“The study found that 56% of the respondents were male and
44% female, indicating a slightly higher male participation in
the study. This aligns with the objective of assessing gender
distribution in student enrollment.”
69.
Interpretation
• Go beyondnumbers; explain what the results mean in
the context of your study.
• Compare with literature or previous studies.
70.
Example Finding datainterpretation
“The majority of students prefer online learning
platforms, which confirms previous research by Smith
(2020) that technology integration improves
engagement.”
71.
Tips for ReportingFindings
•Use clear headings and subheadings
•Present data objectively without bias
•Use tables/figures for clarity but interpret
them in text
•Separate results from discussion (if your
report has a discussion section)
72.
Referencing
What is Referencing?
Referencingis the process of acknowledging the sources you used in your
research. It shows where your information came from and gives credit to the
original authors.
73.
Why is ReferencingImportant?
• Avoids plagiarism
• Shows the credibility of your work
• Helps readers trace your sources
• Demonstrates academic honesty
74.
Component of reference
Referencinghas 2 major components:
• 1. In-text Citation
• A short reference inside your paragraph.
It appears immediately after you use someone else's idea.
• Format (Harvard):
• (Author, Year)
or
Author (Year)
75.
Examples
• According toBenson (2016), marketing strategy focuses on customer value.
• Marketing strategy focuses on creating value for customers (Benson, 2016).
• For direct quotes: A direct quote is when you copy the exact words from an author
or source without changing anything.
• You put the words inside quotation marks and include an in-text
citation with a page number.
Example
• Include page number:
(Bryman, 2012, p. 45)
76.
Example of aDirect Quote (Harvard Style)
• Short direct quote (less than 40 words):
• “Education is the most powerful weapon which you can use to change the
world”
(Mandela, 1994, p. 53).
• Integrated into a sentence:
• According to Mandela (1994, p. 53), “education is the most powerful weapon
which you can use to change the world.”
77.
Long direct quote(more than 40 words):
• You do not use quotation marks.
You indent the entire quote as a block.
• Example:
Mandela (1994, p. 53) states that: Education is the most powerful weapon
which you can use to change the world. It gives individuals the capacity to
improve themselves and influence society positively.
78.
When to UseDirect Quotes
Use direct quotes only when:
• The original wording is powerful
• You cannot summaries it better
• You want to emphasize a key statement
79.
When NOT toUse Direct Quotes
• Avoid too many direct quotes; instead, paraphrase.
Excessive quoting makes your work look like copy-and-paste.
80.
2. Reference List
•A detailed list of all sources cited in your work.
It appears at the end of your assignment.
• Arranged alphabetically by author surname.
81.
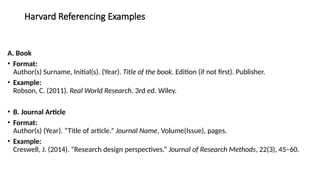
Harvard Referencing Examples
A.Book
• Format:
Author(s) Surname, Initial(s). (Year). Title of the book. Edition (if not first). Publisher.
• Example:
Robson, C. (2011). Real World Research. 3rd ed. Wiley.
• B. Journal Article
• Format:
Author(s) (Year). “Title of article.” Journal Name, Volume(Issue), pages.
• Example:
Creswell, J. (2014). “Research design perspectives.” Journal of Research Methods, 22(3), 45–60.
82.
C. Website
• Format:
Author/Organization(Year). Title of the page. Available at: URL (Accessed:
Date).
• Example:
World Bank (2023). Poverty Overview. Available at: https://www.worldbank.org
(Accessed: 3 December 2025).
83.
D. Report
• Format:
Organization(Year). Report title. Publisher.
• Example:
UNESCO (2022). Global Education Monitoring Report. UNESCO Publishing.
84.
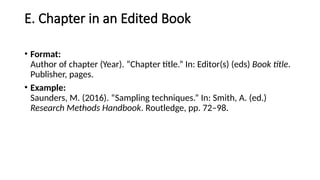
E. Chapter inan Edited Book
• Format:
Author of chapter (Year). “Chapter title.” In: Editor(s) (eds) Book title.
Publisher, pages.
• Example:
Saunders, M. (2016). “Sampling techniques.” In: Smith, A. (ed.)
Research Methods Handbook. Routledge, pp. 72–98.
85.
How to CiteDifferent Situations
Multiple authors
• 2 authors:
• (Brown and Green, 2020)
• 3 or more authors:
(Williams et al., 2019)
• No author
• Use organization name:
(WHO, 2021)
• No year
• Use n.d.
(FAO, n.d.)
86.
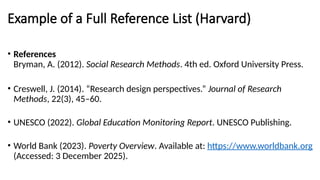
Example of aFull Reference List (Harvard)
• References
Bryman, A. (2012). Social Research Methods. 4th ed. Oxford University Press.
• Creswell, J. (2014). “Research design perspectives.” Journal of Research
Methods, 22(3), 45–60.
• UNESCO (2022). Global Education Monitoring Report. UNESCO Publishing.
• World Bank (2023). Poverty Overview. Available at: https://www.worldbank.org
(Accessed: 3 December 2025).