Download to read offline


![World Happiness Report 2023
73
66
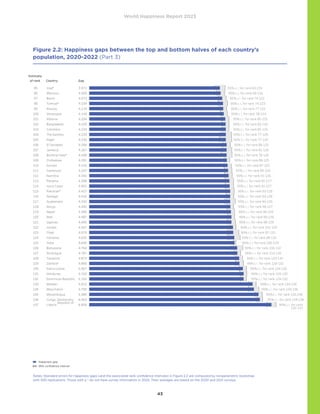
This group, sometimes referred to as WEIRD, for Western,
Educated, Industrial, Rich, and Democratic, is represented
in our data by regions 0 and 7. Region 0 is Western Europe,
and region 7 includes the United States, Canada, Australia,
and New Zealand.
67
See Dolan et al.(2021), for UK experimental evidence from
a large-scale volunteering programme.
68
See, for example, Aknin et al (2011) and Chapter 4 of this
report.
69
The Ukrainian data were collected mainly during September
2022. See also the earlier analysis of the Gallup data in Ray
(2022). For Ukrainian attitudes towards the Crimean
annexation and its implications see Ray and Esipova (2014)
and O’Loughlin et al. (2017).
70
Osiichuk Shepotylo (2021) examined health and financial
well-being during the post-2014 period, and found negative
effects to be much greater for those living closer to the
zones of conflict.
71
This includes the data for eight oblasts: Dnipropetrovsk,
Donetsk, Zaporizhzhya, Luhansk, Kharkiv, Kherson,
Mykolayiv, and Odessa.
72 See Kiev International Institute of Sociology (2022).
73
Ukrainian survey research in 2015 found that the happiness
reductions were concentrated in the Donbas Oblasts of
Donetsk and Luhansk. See Coupe Obrizon (2016).
74
Tamilina (2022) finds that the war with Russia, but not war
worries, predicted higher social trust in Ukraine using data
from two rounds of the World Values Survey.
75
See Gallup/Meta (2022). The State of Social Connections
study, by Gallup Meta (Meta-commissioned study of at
least 2,000 people ages 15+ in Brazil, Egypt, France, India,
Indonesia, Mexico, and the United States), April-June 2022.
76
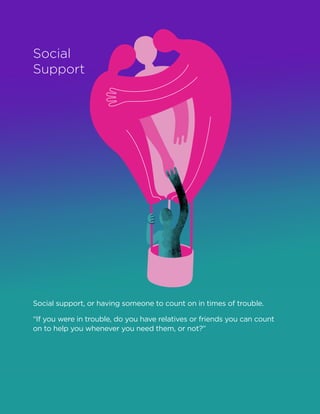
The three social connection questions included measures of
support (“In general, how supported do you feel by people?
By supported, I mean how much you feel cared for by
people.”), connection (“In general, how connected do you
feel to people? By connected, I mean how close you feel to
people emotionally.”), and loneliness (“In general, how
lonely do you feel? By lonely, I mean how much you feel
emotionally isolated from people.”). All response options
were on a 4-point scale that ranged from “Not at all
[supported/connected/lonely]” to “Very [supported/
connected/lonely]. The social domain satisfaction question
available in the 7-country poll is “In general, how satisfied
are you with your relationships with people”. The four
answers offered are very satisfied, somewhat satisfied,
somewhat dissatisfied and very dissatisfied. The Gallup
World Poll subset does not include this social domain
satisfaction variable, but the Cantril ladder is asked
elsewhere of all respondents, on a scale from 0 to 10, and
provides a more general umbrella measure with which to
value different aspects of social relations.
77
For social connections, the seven-country average was 3.04
with the significant departures being Brazil and Mexico
lower (by 0.33 and 0.15, respectively), Egypt higher by 0.28,
and France and India above the average by smaller amounts
(0.07 and 0.11 respectively). For social support, the
seven-country mean was 3.09 with significant departures
being Egypt and the US higher (by 0.10 and 0.17 respectively)
and Brazil and France lower (by 0.15 and 0.14 respectively).
For loneliness the seven-country average was 1.68, with
Egypt and India being higher (by 0.17 and 0.38 respectively)
and Brazil, France, Indonesia and Mexico lower, (by 0.05,
0.13, 0.26, and 0.08 respectively).
78
For the umbrella measure of social domain satisfaction, the
countries fell in a fairly narrow band, with the only significant
departures being Brazil and Egypt higher by 0.07 and 0.09,
respectively, and France lower by 0.15.
79
For example, as reviewed by Holt-Lunstad et al. (2015) and
Leigh-Hunt et al (2017).
80 See Folk et al. (2023).
81
These are coefficients drawn from an equation using the
combined social support variable and loneliness to predict
satisfaction with social connections. See Folk et al. (2023)
for details.
82
In both the 7-country and Gallup World Poll surveys, there
are four answer options for each of three social connections
questions in the seven countries appearing in both surveys.
If we treat the deep dive survey’s share of responses in
each of these 84 country-question-response bins as
observations of one random variable, and the Gallup World
Poll shares as a second random variable observed for the
same 84 bins, the Pearson correlation of the two survey
variables is 0.983. Within individual countries, the correla-
tion of the 12 observations is consistently greater than .975,
from a low of 0.976 in Egypt to a high of 0.995 in Indonesia.
83
We found that none of the three variables added significant
explanatory power, whether or not we included our existing
social support variable. This may reflect the relatively small
sample size (104 countries) and no doubt also reflects the
fact that the international share of total variance is much
greater for life evaluations than for social context variables,
as shown in Figure 2.1 of World Happiness Report 2013.](https://image.slidesharecdn.com/whr23-230320082439-416810b5/85/World-Happiness-Report-2023-75-320.jpg)


![World Happiness Report 2023
143
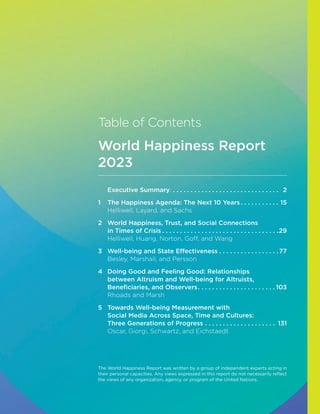
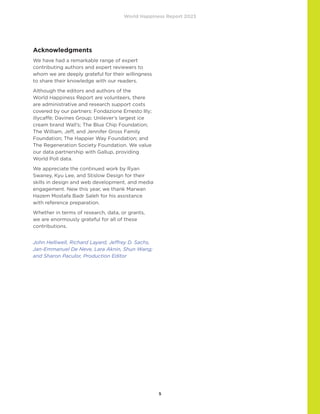
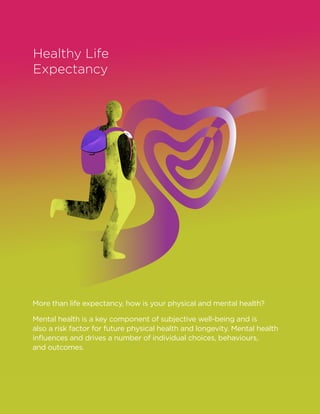
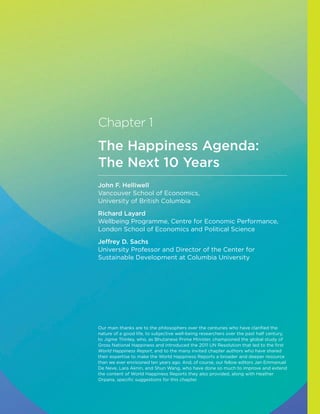
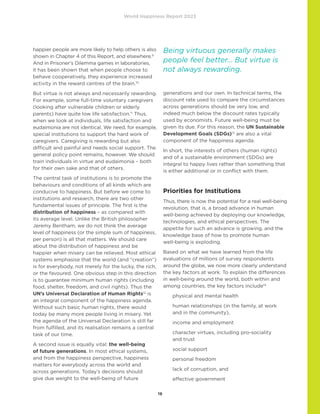
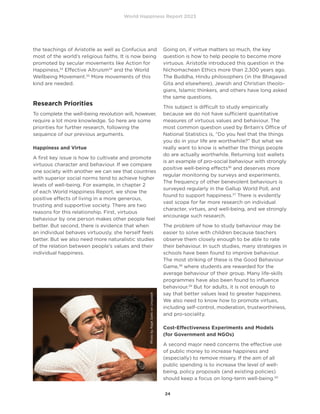
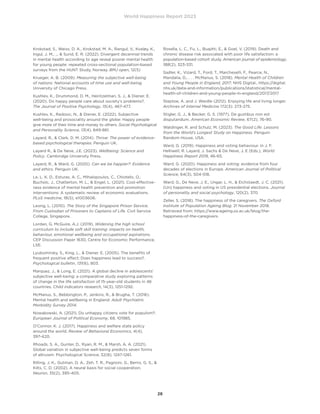
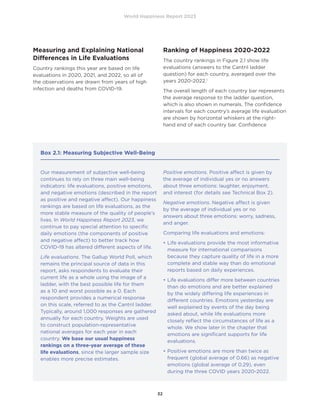
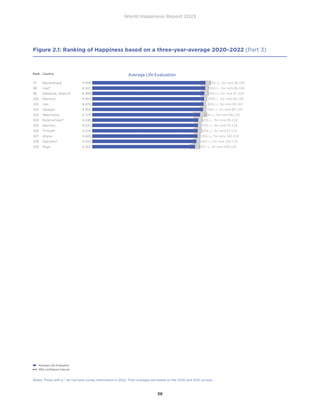
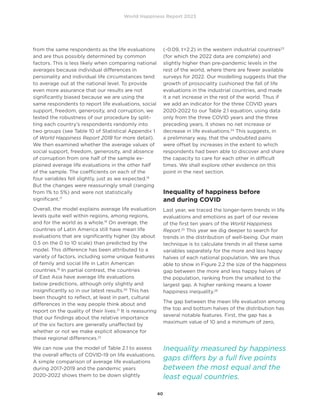
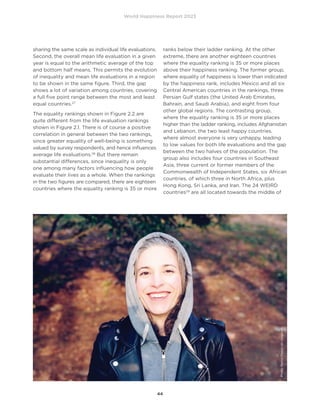
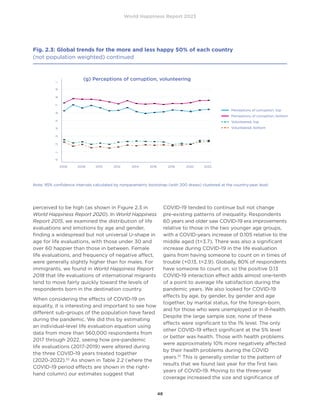
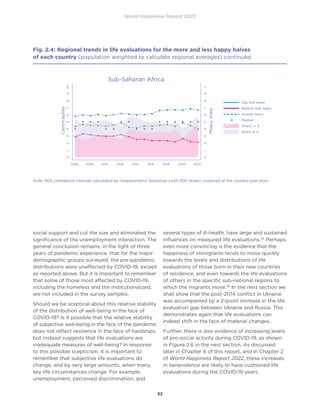
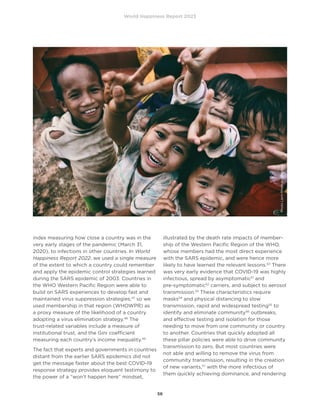
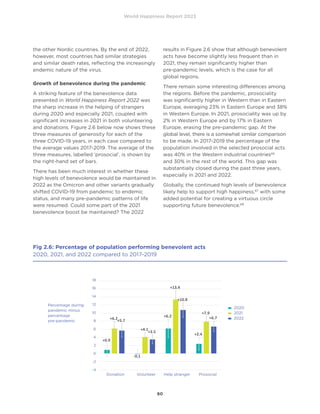
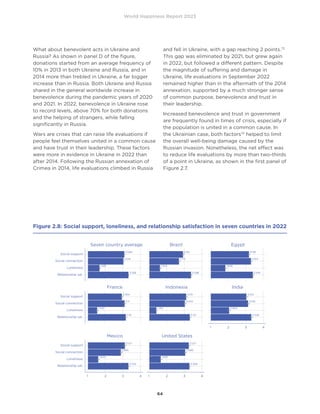
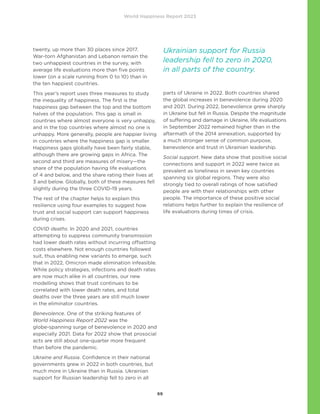
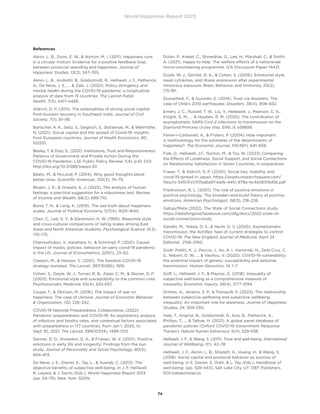
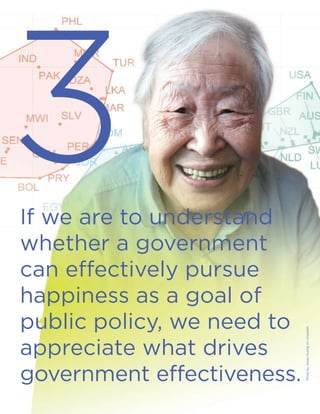
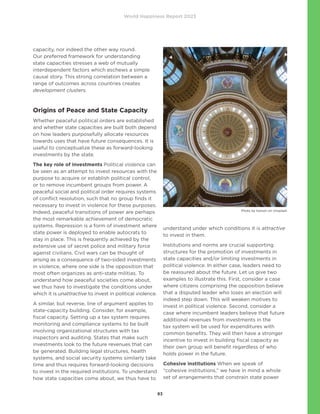
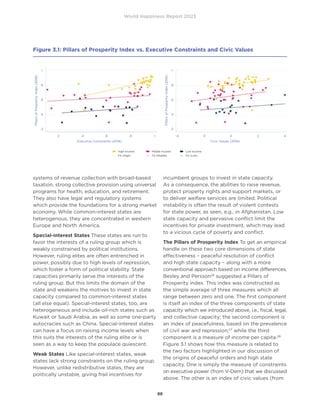
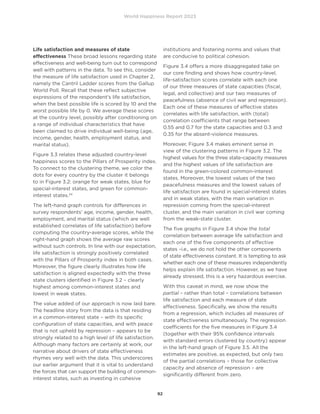
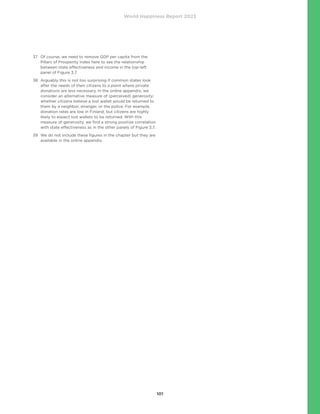
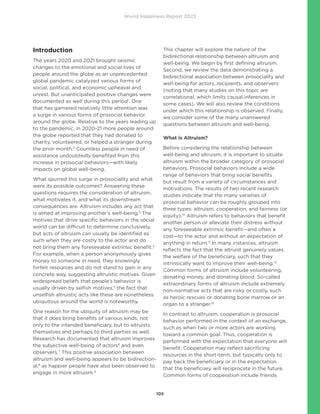
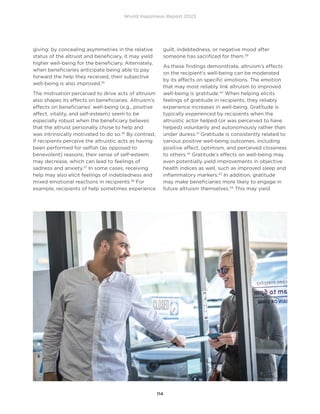
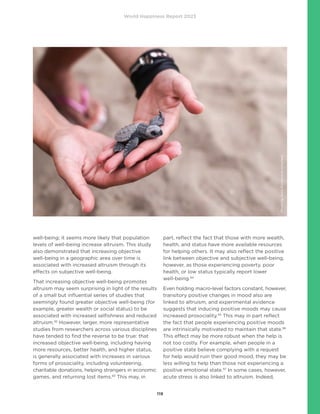
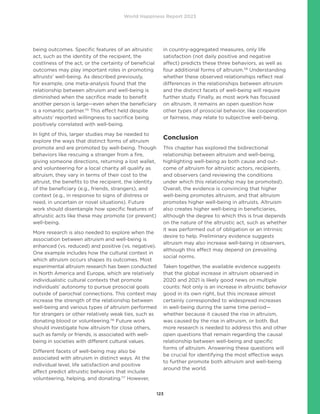
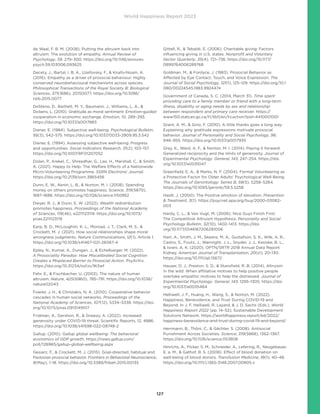
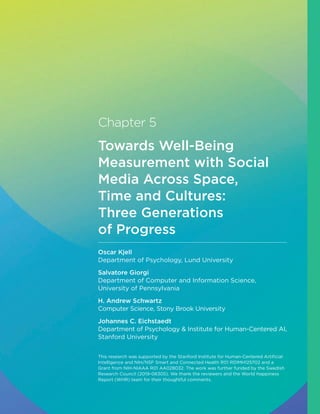
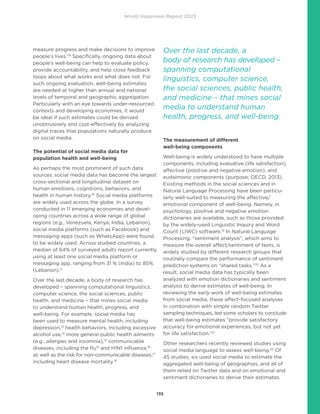
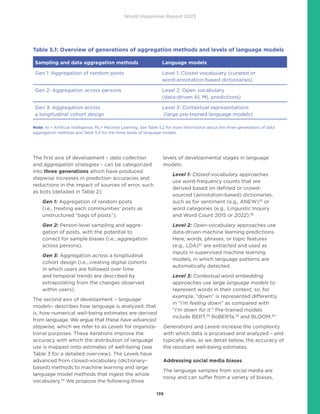
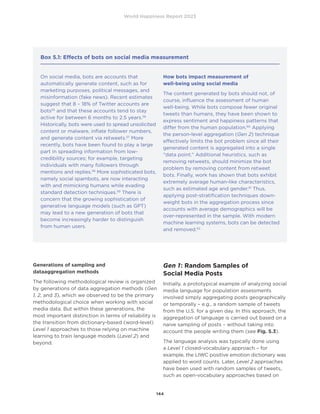
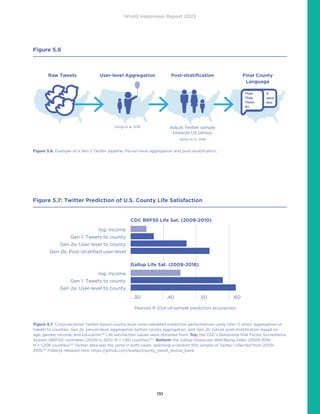
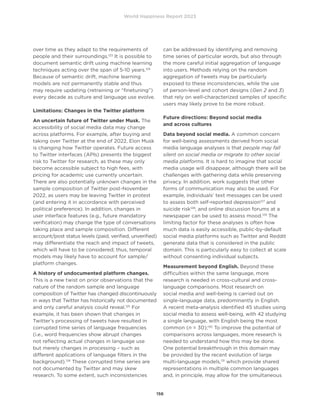
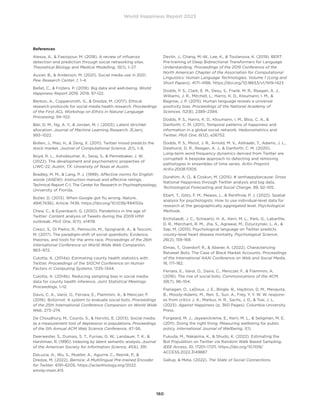
Table 5.3: Advances in language analysis methods
Language
analysis approach Proto-typical Examples Advantages Disadvantages
Level 1 Closed-
vocabulary, or
crowdsourced
dictionaries
Word-
frequency
counts are
derived based
on defined
dictionaries
such as
sentiment
or word
categories.
LIWC
LabMT
ANEW
Warriner’s
ANEW
Straightforward,
easy-to-use software
interface (LIWC).
Good for understanding
the same patterns in
language use across
studies (e.g., use of
pronouns).
Top-down approaches typically
rely on hand-coded categories
defined by researchers.
Most words have multiple
words senses, which human
raters do not anticipate
e.g., “I feel great” and “I am
in great sorrow.”54
Dictionaries without weights
(like LIWC) may insufficiently
capture differences in valence
between words (e.g., good vs.
fantastic).
Level 2 Open-
vocabulary,
data-driven
ML or AI
predictions
Words,
phrases, or
topic features
are extracted,
filtered
(based on [co-]
occurrence),
and used as
inputs for
machine
learning
models.
Words
Phrases
LDA topic
models
LSA
Data-driven, bottom-up,
unsupervised methods
rely on the statistical
patterns of word use
(rather than subjective
evaluations).
Words are represented
with high precision (not
just binary).
Topics can naturally
appear and provide
basic handling of word
sense ambiguities.
Numerical representations
do not take context into
account.
Data-driven units of
analysis (such as topics)
can be challenging to
compare across studies.
Level 3 Contextual
representations,
large language
models
Contextualized
word embed-
dings through
self-attention.
Transformer
models:
BERT
RoBERTa
BLOOM
Produces state-of-the-
art representations of
text. Takes context into
account. Disambiguates
word meaning.
Leverages large internet
corpora.
Computationally resource-
intensive (needs GPUs).
Semantic biases: transformers
models get their representations
of text from the structure of the
training dataset (corpus) that is
used; this involves the risk of
reproducing existing biases in
the corpus (N.b.: there are
methods to examine and reduce
these biases).
ML = Machine Learning; LabMT = Language Assessment by Mechanical Turk (LabMT) word list (Dodds et al. (2015);
ANEW = Affective Norms for English Words (Bradley Lang, 1999); LIWC = Linguistic Inquiry and Word Count (Boyd et al. (2022);
Pennebaker et al. (2001); Warriner’s ANEW – a list with 13915 words (Warriner et al. (2013). LSA = Latent Semantic Analysis
(Deerwester et al. (1990); LDA = (Blei et al. (2003); BERT = Bidirectional Encoder Representations from Transformers (Devlin
et al. (2019); RoBERTa = Robustly Optimized Bidirectional Encoder Representations from Transformers Pretraining Approach
(Y. Liu et al. (2019); BLOOM = BigScience Large Open-science Open-access Multilingual Language Model.
GPU = Graphical Processing Units (Graphics Cards)](https://image.slidesharecdn.com/whr23-230320082439-416810b5/85/World-Happiness-Report-2023-145-320.jpg)

![World Happiness Report 2023
148
Gen 1 using Level 2 machine learning methods
More advanced language analysis approaches,
including Level 2 (machine learning) and Level 3
(large language models), have been applied to
random Twitter feeds. For example, random
tweets aggregated to the U.S. county level were
used to predict life satisfaction (r = .31; 1,293
counties)82
and heart disease mortality rates
(r = .42, 95% CI = [.38, .45]; 1,347 counties; Gen 1,
Level 1–2)83
; in these studies, machine learning
models were applied to open-vocabulary words,
phrases, and topics (see supplementary material
for social media estimates with a spatial resolution
below the county level).
In addition, researchers have used text data from
discussion forums at a large online newspaper
(Der Standard) and Twitter language to capture
the temporal dynamics of individuals’ moods.84
Readers of the newspaper (N = 268,128 responses)
were asked to rate their mood of the preceding
day (response format: “good,” “somewhat good,”
“somewhat bad,” or “bad”), which were aggregated
to the national level (Gen 1, Level 1 and 3).85
Language analyses based on a combination of
Level 1 (German adaptation of LIWC 2001)86
and
Level 3 (German Sentiment, based on contextual
embeddings, BERT) yielded high agreement
across days with the aggregated Der Standard
self-reports over 20 days (r =.93 [.82, .97]).
Similarly, in a preregistered replication, estimates
from Twitter language (more than 500,000
tweets by Austrian Twitter users) correlated with
the same daily-aggregated self-reported mood at
r = .63 (.26, .84).
Gen 1: Random post aggregation - Summary
To aggregate random tweets directly into
geographic estimates is intuitively straightforward
and relatively easy to implement; and it has been
used for over a decade (2010+). However, it is
susceptible to many types of noise, such as
changing sample composition over time, incon-
sistent posting patterns, and the disproportionate
impact of super-posting accounts (e.g., bots, see
Box 5.1), which may decrease measurement
accuracy.
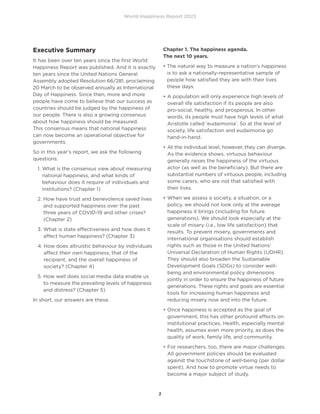
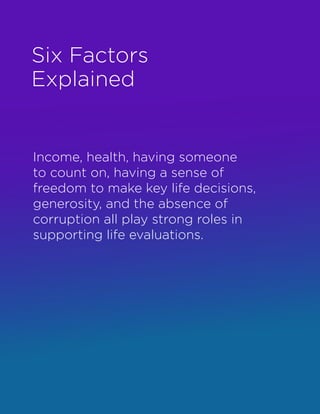
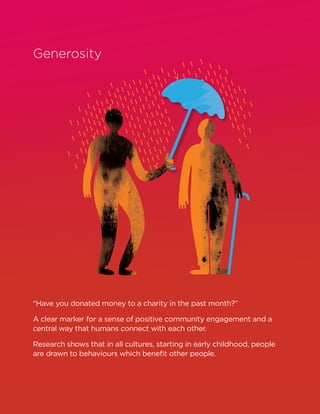
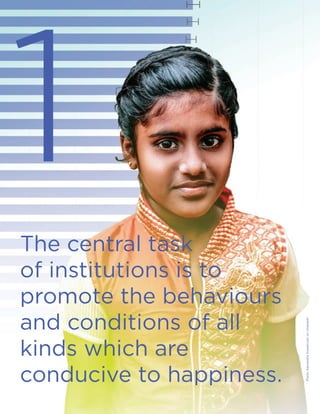
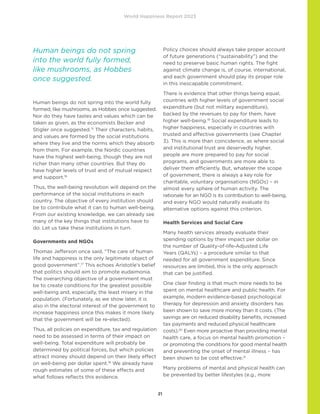
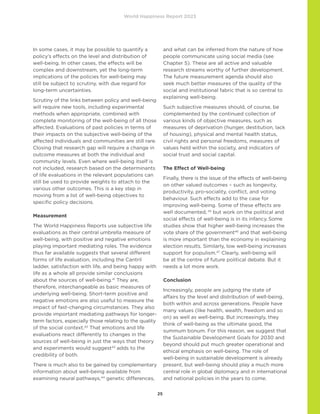
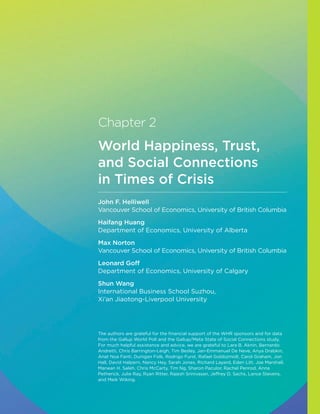
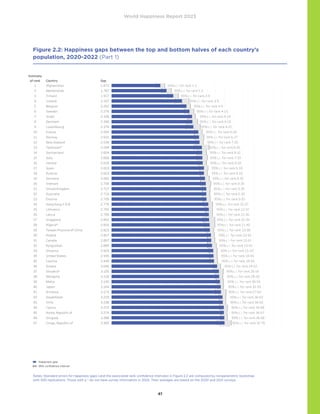
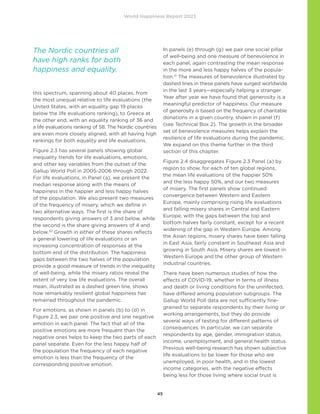
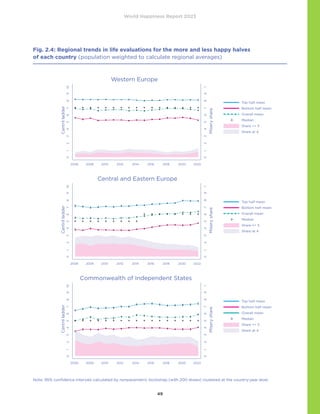
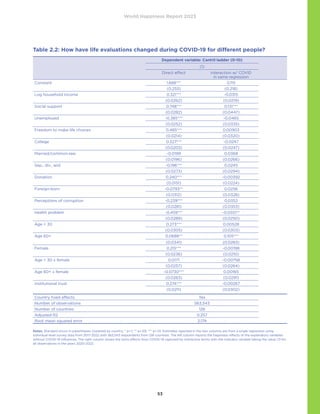
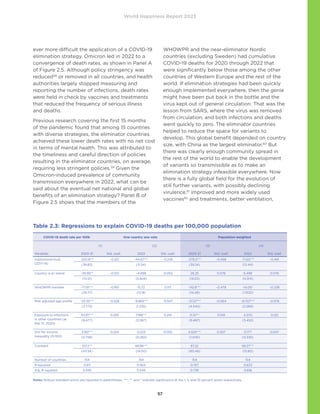
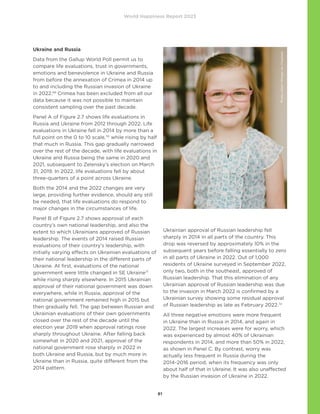
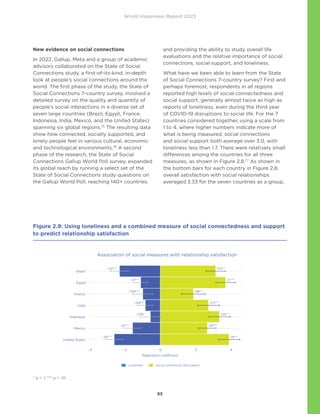
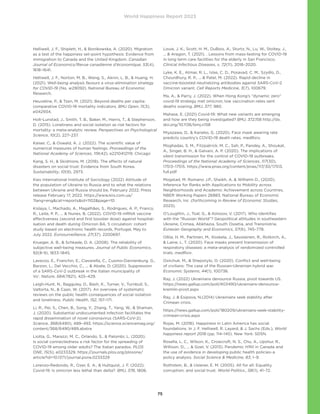
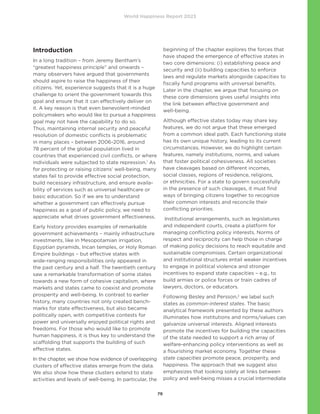
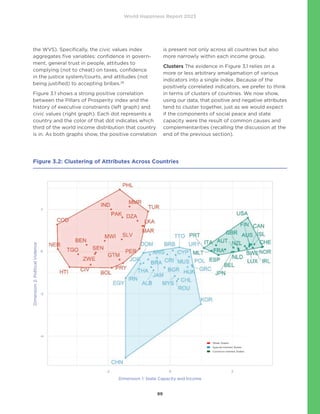
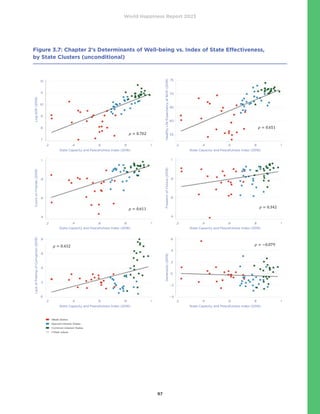
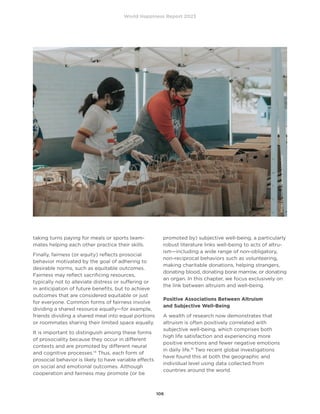
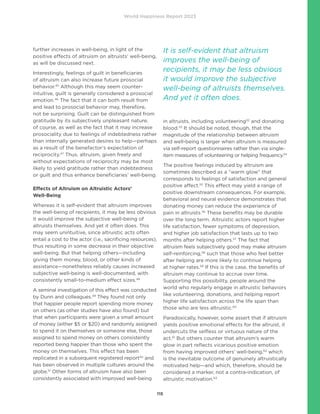
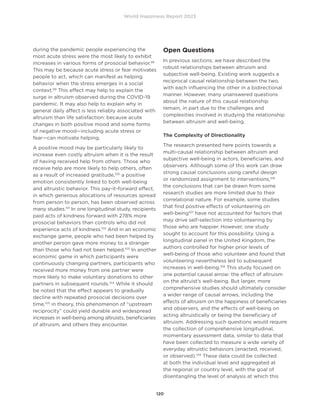
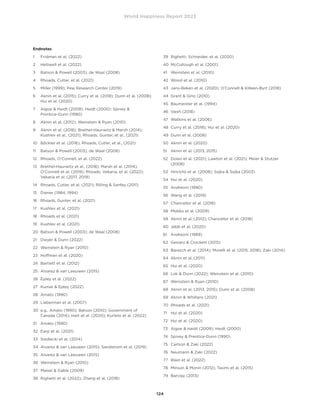
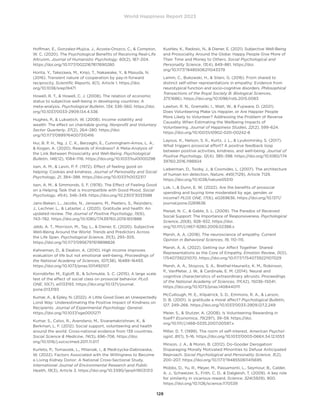
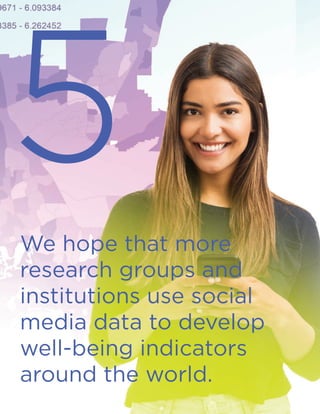
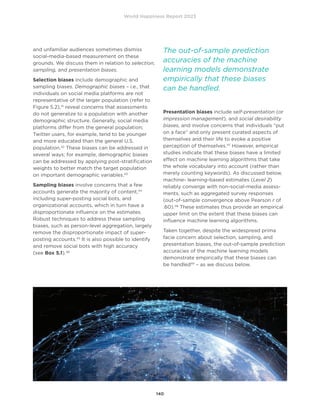
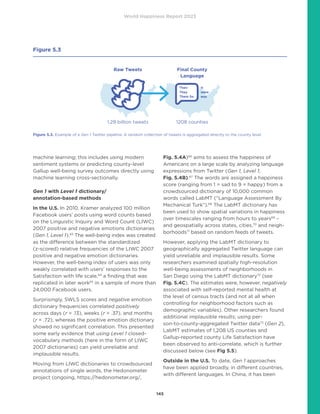
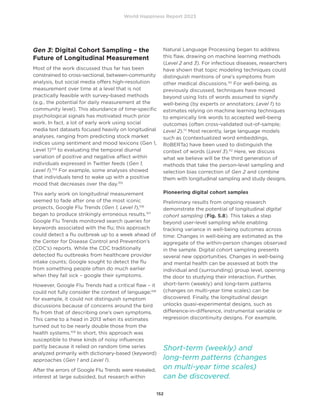
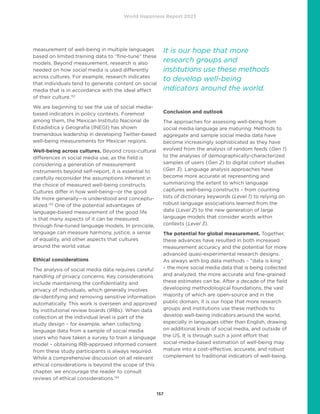
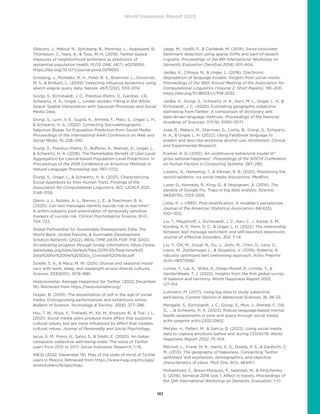
Figure 5.5
Level 1: Dictionaries Level 2: Machine-Learning Models
LIWC 2015 LabMT Swiss Chocolate
World
Well-Being Project
Gallup surveys
Positive
Emotion
Negative
Emotion Happiness
Positive
Sentiment
Negative
Sentiment
Life
Satisfaction
Model
Direct
County-Level
Prediction
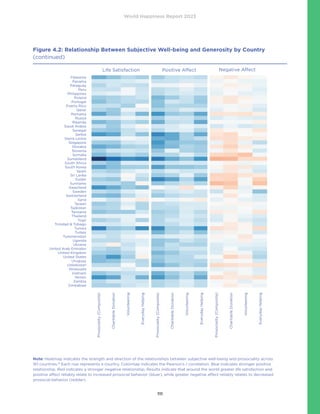
Life Satisfaction -.21 -.32 -.27 .24 -.29 .39 .62
Happiness -.13 -.27 -.07 .24 -.30 .23 .51
Sadness .25 .22 .19 -.20 .33 -.23 .64
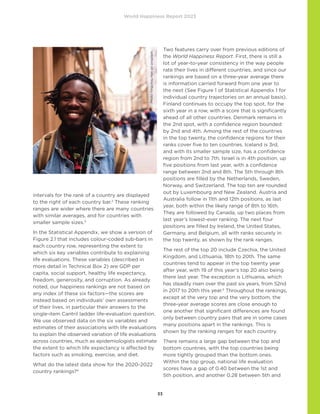
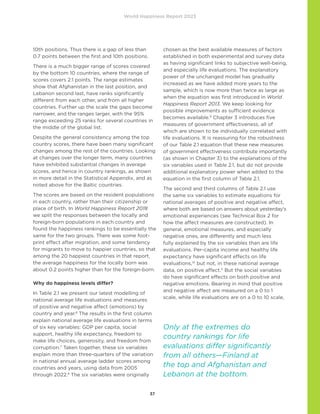
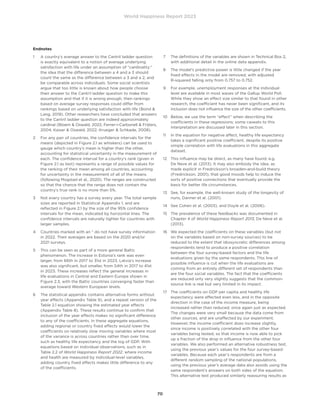
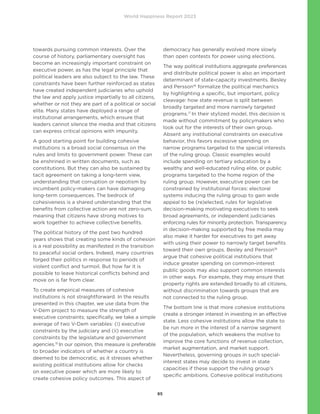
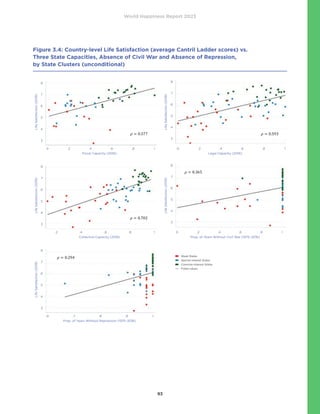
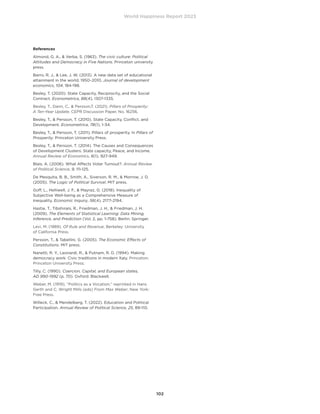
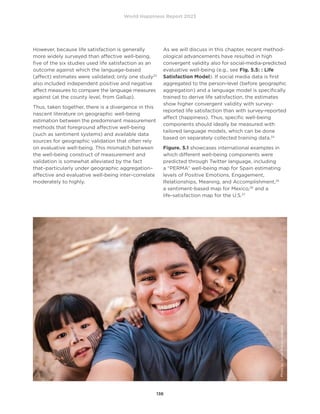
Figure 5.5. Using different kinds (“levels”) of language models in the prediction for Gallup-reported county-level Life Satisfaction,
Happiness, and Sadness (using a Gen 2: User-level-aggregated 2009-2015 10% Twitter dataset) across 1,208 US counties.
Level 2-based estimates, such as those based on Swiss Chocolate – a modern Sentiment system derived through machine
learning – yield consistent results.80
However, estimates derived through the Level 1 Linguistic Inquiry and Word Count (LIWC 2015)
Positive Emotions dictionary or the word-level annotation-based Language Assessment by Mechanical Turk (labMT) dictionary
anti-correlate with the county-level Gallup-reported survey measure for Life Satisfaction.81](https://image.slidesharecdn.com/whr23-230320082439-416810b5/85/World-Happiness-Report-2023-150-320.jpg)
![World Happiness Report 2023
150
Averaging across genders. In chapter 4 of the
World Happiness Report 2022 (WHR 2022), the
authors95
report results from a study that assessed
emotions, including happy/joy/positive affect,
sadness, and fear/anxiety/scared over two years in
the U.K. Prior work has found demographics like
gender and age to impact patterns in language
use more than personality and are thus important
confounding variables to consider when analyzing
language use.96
The authors in chapter 4 of the
WHR 2022,97
separately derived (and then
combined) gender-specific estimates from Twitter
data using both Level 1 (LIWC) and Level 3
(contextualized word embeddings; RoBERTa)
approaches.98
Twitter-estimated joy correlated
at r = .55 [.27, .75] with YouGov reported
happiness over eight months from November
2020 to June 2021.
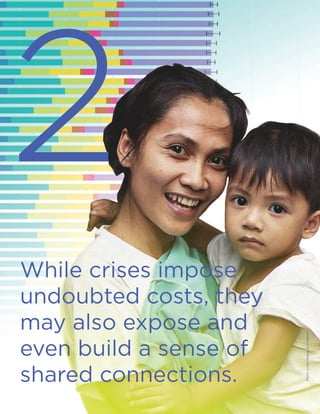
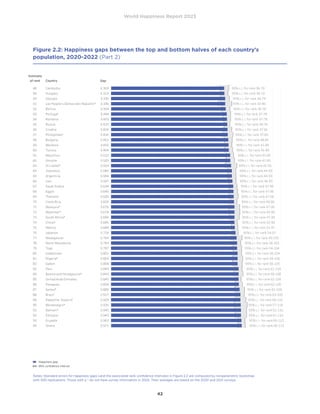
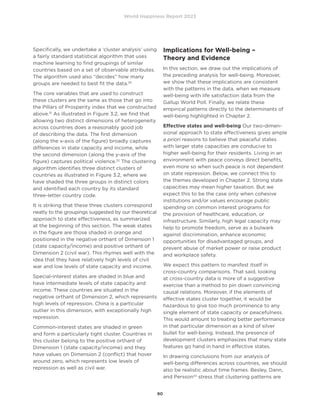
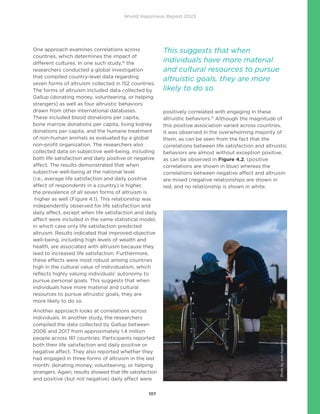
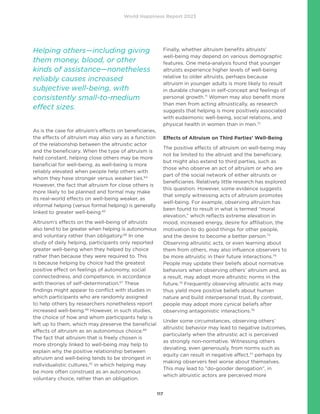
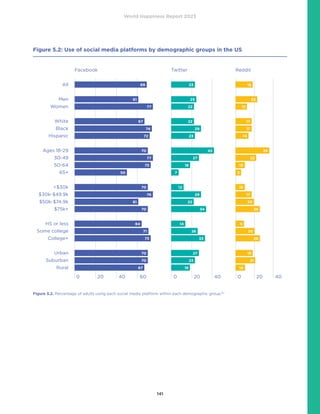
Gen 2 person-level aggregation – Summary
Person-level Gen 2 methods are built on a decade
of research using Gen 1 random feed aggregation
methods based on the (in hindsight obvious)
intuition that communities are groups of people
who produce language rather than a random
assortment of tweets. This intuition has several
methodological advantages. First, person-level
aggregation treats each person as a single
observation, which can down-weight highly active
accounts and minimize the influences of bots or
organizations. Second, it paves the way for
addressing selection biases as one can now
weight each person in the sample according to
their representativeness in the population.
Furthermore, these methods can be applied to
any digital data. Finally, these methods more
closely reflect the methodological approaches in
demography and public health that survey people
and lay the foundation for tracking digital cohorts
over time (Gen 3).
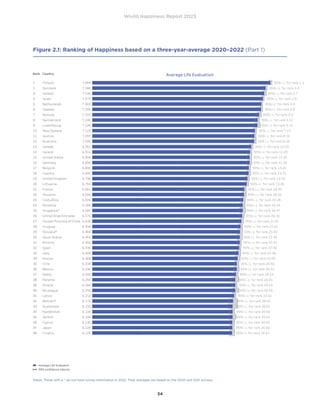
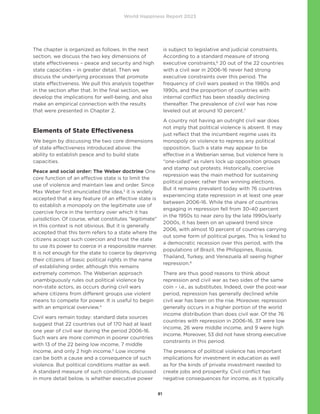
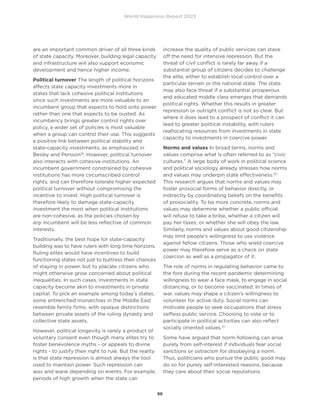
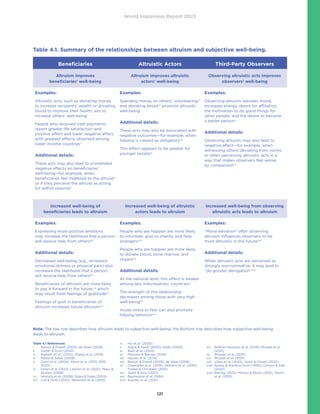
Person-level aggregation
can down-weight highly active
accounts and minimize the
influences of bots.](https://image.slidesharecdn.com/whr23-230320082439-416810b5/85/World-Happiness-Report-2023-152-320.jpg)
![World Happiness Report 2023
154
trends in socioeconomically matched counties
can be compared to study the impact of specific
events, such as pandemic lockdowns, large-scale
unemployment, or natural disasters.
The choice of spatiotemporal resolution. Social
media data is particularly suitable for longitudinal
designs since many people frequently engage
with social media. For example, in the U.S., 38%
of respondents reported interacting with others
“once per day or more” through one of the top
five social media platforms (this ranges from 19%
in India to 59% in Brazil across seven countries).113
Even in research studies conducted by university
research labs, sample sizes of more than 1% of the
U.S. population are feasible (e.g., the County-
Tweet Lexical Bank with 6.1 million Twitter users).114
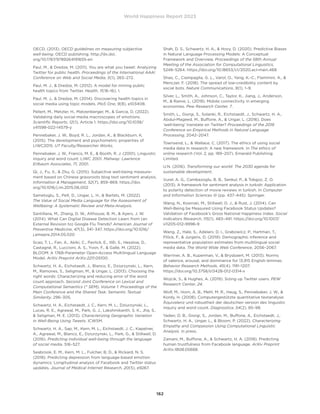
In principle, such an abundance of data allows for
high resolution in both space and time, such as
estimates for county–weeks (see Fig. 5.9). The
higher resolution can provide economists and
policymakers with more fine-grained, reliable
information that can be used for evaluating the
impact of policies within a quasi-experimental
framework.
Enabling data linkage. Estimates at the county-
month level also appear to be well-suited for data
linkage with the population surveillance projects
in population health (for example, the Office
of National Drug Control Policy’s [ONDCP]
Non-Fatal Opioid Overdose Tracker) and serve
as suitable predictors of sensitive time-varying
health outcomes, such as county-level changes
in rates of low birth weights. The principled and
stabilized estimation of county-level time series
opens the door for social-media-based measure-
ments to be integrated with the larger ecosystem
of datasets designed to capture health and
well-being.
Forthcoming work: Well-being and mental
health assessment in time and space
Studies employing digital cohorts have only
recently emerged (i.e., preliminary studies in
preprints) related to tracking the opioid epidemic
from social media. For example, some researchers
(Gen 3, Level 1) use Reddit forum data to identify
and follow more than 1.5 million individuals
geolocated to a state and city to test relationships
between discussion topics and changes in opioid
mortality rate.115
Similarly, other researchers
(Gen 3, Level 2) tracks opioid rates of a cohort of
counties to predict future changes in opioid
mortality rates. Albeit utilizing coarse-grained
temporal resolutions (i.e., annual estimates), these
works lay a foundation of within-person and
within-community cohort designs that can be
mirrored for well-being monitoring at scale.116
The field is on the verge of combining Gen 3
sampling and aggregation with Level 3 contextu-
alized embedding-based language analyses
(Gen 3, Level 3), which will provide state-of-the-
art resolutions and accuracies.
Gen 3 digital cohort designs –
Summary and Limitations
The digital cohort approach comes with the
advantages of the person-level approaches, as
well as increased methodological design control
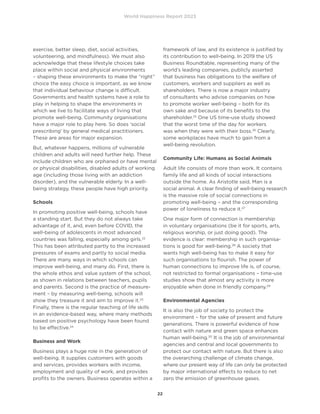
Photo
by
Shingi
Rice
on
Unsplash](https://image.slidesharecdn.com/whr23-230320082439-416810b5/85/World-Happiness-Report-2023-156-320.jpg)


The World Happiness Report 2023 examines the importance of measuring national happiness, highlighting trust, social connections, and altruism as key factors influencing well-being. It details the resilience of life satisfaction during crises like COVID-19 and underscores how government effectiveness and policies can shape happiness. The report also explores advancements in social media data analysis for tracking well-being, advocating for happiness as a primary goal for governments.


