Download to read offline


![128
129
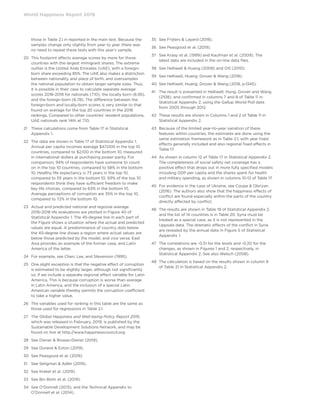
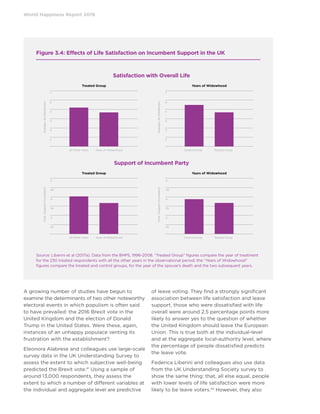
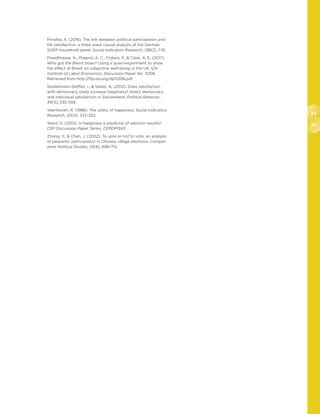
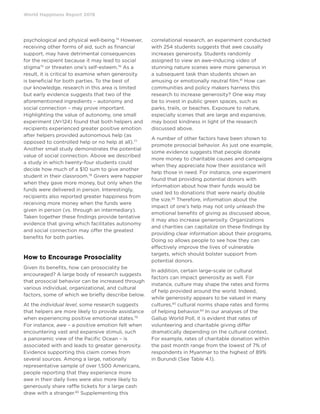
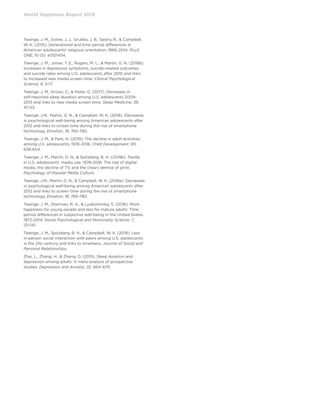
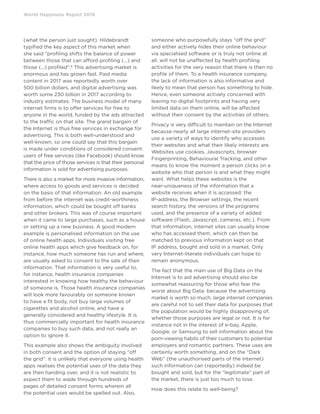
Possible Causes of Rising Rates
of Addiction
Many studies indicate a rising prevalence of
several addictions, certainly including opioids,
Internet-related, eating-related, and possibly
others. These epidemics are accompanied by
rising suicide rates and overdoses related to
substance abuse, rising obesity related to eating
addictions, and rising adolescent depression
apparently related to Internet and related
addictions. While there is no overarching
consensus on the reasons for the rising
prevalence of addictions in American society,
several broad hypotheses have been put
forward for consideration. These hypotheses are
inter-related and by no means mutually exclusive.
Mismatches of Human Nature and
Modern Life
The first hypothesis, as expressed cogently for
example by Prof. Lee Goldman in his book Too
Much of a Good Thing (2015), is that several
prevalent addictions result from a discrepancy
between our evolutionary heritage and our
current life conditions. As Goldman explains,
“Early humans avoided starvation by being able
to gorge themselves whenever food was available.
Now that same tendency to eat more than our
bodies really need explains why 35 percent of
Americans are obese and have an increased
risk of developing diabetes, heart disease, and
even cancer.” Similarly, the ancient risk of fatal
dehydration created a craving for salt and water,
which now leads many people to consume an
excess of salt that in turn contributes to high
blood pressure.
Rising Stress Levels Associated with
Increased Socioeconomic Inequality
The second hypothesis, powerfully described by
Profs. Richard Wilkinson and Kate Pickett in their
new book The Inner Level (2019), argues that
high and rising income inequality in high-income
societies leads to stress that leads to addiction:
“As we have seen, trying to maintain self-esteem
and status in a more unequal society can be
highly stressful … [T]his experience of stress can
lead to an increased desire for anything which
makes them feel better – whether alcohol, drugs,
eating for comfort, ‘retail therapy’ or another
crutch. It’s a dysfunctional way of coping, of
giving yourself a break from the relentlessness
of the anxiety so many feel.”
Super-normal Stimuli
The third major hypothesis points to a core
design feature of a market economy: addictive
products boost the bottom line. Americans are
being drugged, stimulated, and aroused by the
work of advertisers, marketers, app designers,
and others who know how to hook people on
brands and product lines. If Sigmund Freud is the
psychologist who made the “unconscious” the
basis of his theories, it was his nephew, Edward
Bernays, the inventor of modern public relations
(PR), who preyed on the unconscious to sell goods.
Bernays trafficked in behavioral conditioning, for
example, famously associating cigarette smoking
with sexual allure of the female models who were
photographed smoking in public, a dubious
“first” for women.
The academic and business literature is rife with
examples of businesses “spiking” their products
by associating them with various kinds of craving:
sex, power, fame, euphoria, or others. As Adam
Alter (2017) powerfully describes in his book
Irresistible: The Rise of Addictive Technology and
the Business of Keeping Us Hooked, the tech
companies are aggressively adjusting their apps
to induce more screen time (e.g. by including
time delays or other screen signals designed to
prompt our heightened attention and rush of
dopamine). Slot machine owners program their
machines so that they give a payout after a long
stretch of losses, in order to hook the individual
on continued gambling. Food companies spike
their products with extra sugar and salt, highly
processed foodstuffs, and fats that trigger a
craving response. The tobacco industry adds
nicotine in order to induce more smoking addiction.
Social Contagion
For countless behaviors, peer imitation and
peer pressure are often decisive for leading
an individual to addiction. Zhang et al. (2018)
review studies showing that “friendship
networks and weight outcomes/behaviours
were interdependent, and that friends were](https://image.slidesharecdn.com/worldhappynessreport-190326124939/85/World-happiness-report-131-320.jpg)
![World Happiness Report 2019
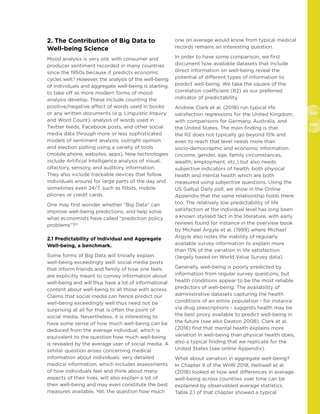
References
Ali, M. M., Amialchuk, A., Dwyer, D. S. (2011). The Social
Contagion Effect of Marijuana Use Among Adolescents.
PloS one, 6(1), e16183.
Alter, A. (2018). Irresistible: The rise of addictive technology and
the business of keeping us hooked. New York: Penguin Press.
American Beverage Association v. City County of San
Francisco (United States Court of Appeals for the Ninth Circuit
February 31, 2019).
Barman-Adhikari, A., Rice, E., Winetrobe, H., Petering, R.
(2015). Social network correlates of methamphetamine, heroin,
and cocaine use in a sociometric network of homeless youth.
Journal of the Society for Social Work and Research, 6(3),
433-457.
Bickel, W. K., Mellis, A. M., Snider, S. E., Athamneh, L. N., Stein,
J. S., Pope, D. A. (2018). 21st century neurobehavioral theories
of decision making in addiction: Review and evaluation.
Pharmacology Biochemistry and Behavior, 164, 4-21.
Easterlin, R. A. (1974). Does economic growth improve the
human lot? Some empirical evidence. In Nations and house-
holds in economic growth (pp. 89-125). Academic Press.
Fogoros, R. N., T., B. (2018). The Costs of Drug Use to Society.
Retrieved from https://www.verywellmind.com/what-are-the-
costs-of-drug-abuse-to-society-63037
Goldman, L. (2015). Too Much of a Good Thing. Little, Brown
and Company.
Institute for Health Metrics and Evaluation. (2017). Global
Burden of Disease [Results Tool]. Retrieved from http://ghdx.
healthdata.org/gbd-results-tool
Jiang, J. (2018). How teens and parents navigate screen time
and device distractions. Pew Research Center for Internet and
Technology, Retrieved from http://www. pewinternet.
org/2018/08/22/how-teens-and-parents-navigate-screen-time-
and-device-distractions.
Lindgren, E., Gray, K., Miller, G., Tyler, R., Wiers, C. E., Volkow, N.
D., Wang, G. J. (2018). Food addiction: A common
neurobiological mechanism with drug abuse. Front Biosci
(Landmark Ed), 23, 811-836.
Lissak, G. (2018). Adverse physiological and psychological
effects of screen time on children and adolescents: Literature
review and case study. Environmental research, 164, 149-157.
Lutter, M., Tisch, D., Beckert, J. (2018). Social Explanations of
Lottery Play: New Evidence Based on National Survey Data.
Journal of gambling studies, 1-19.
Sachs, J. D. (2018). America’s health crisis and the Easterlin
paradox. World happiness report, 218, 146-159.
Small, D. M., DiFeliceantonio, A. G. (2019). Processed foods
and food reward. Science, 363(6425), 346-347.
Sussman, S. (2017). Substance and behavioral addictions:
Concepts, causes, and cures. Cambridge University Press.
Twenge, J. (2019) The sad state of happiness in the United
States and the role of digital media. In Helliwell, J., Layard, R.
and Sachs, J., eds., World Happiness Report 2019, xx-xx.
Wilkinson, R. G., Pickett, K. (2019). The inner level: How more
equal societies reduce stress, restore sanity and improve
everyones well-being. New York: Penguin Press.
Zhang, S., de la Haye, K., Ji, M., An, R. (2018). Applications of
social network analysis to obesity: a systematic review. Obesity
reviews, 19(7), 976-988.](https://image.slidesharecdn.com/worldhappynessreport-190326124939/85/World-happiness-report-134-320.jpg)

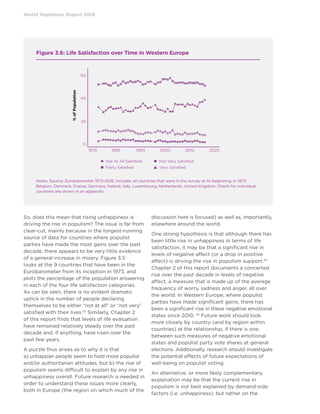
This document provides an overview of the 2019 World Happiness Report, which focuses on happiness and community. It discusses three topics: links between government and happiness, the importance of prosocial behavior, and the impact of digital technology on communities and interactions. The overview previews the subsequent chapters, which will analyze relationships between governance and life evaluations, the connection between voter happiness and political participation, evidence on the link between generosity and well-being, and the effects of digital media and internet addiction on American happiness.


