Workshop 3 rachaya
•Download as PPTX, PDF•
0 likes•100 views

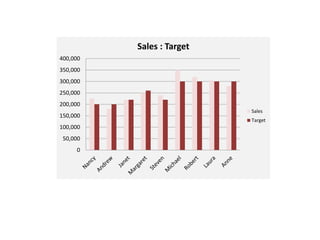
This bar chart shows sales figures compared to a target across 10 data points. Sales start at 0 and increase by 50,000 each time up to 400,000, while the target remains at 300,000. The sales are below the target for most of the values shown but exceed it at 350,000 and 400,000.