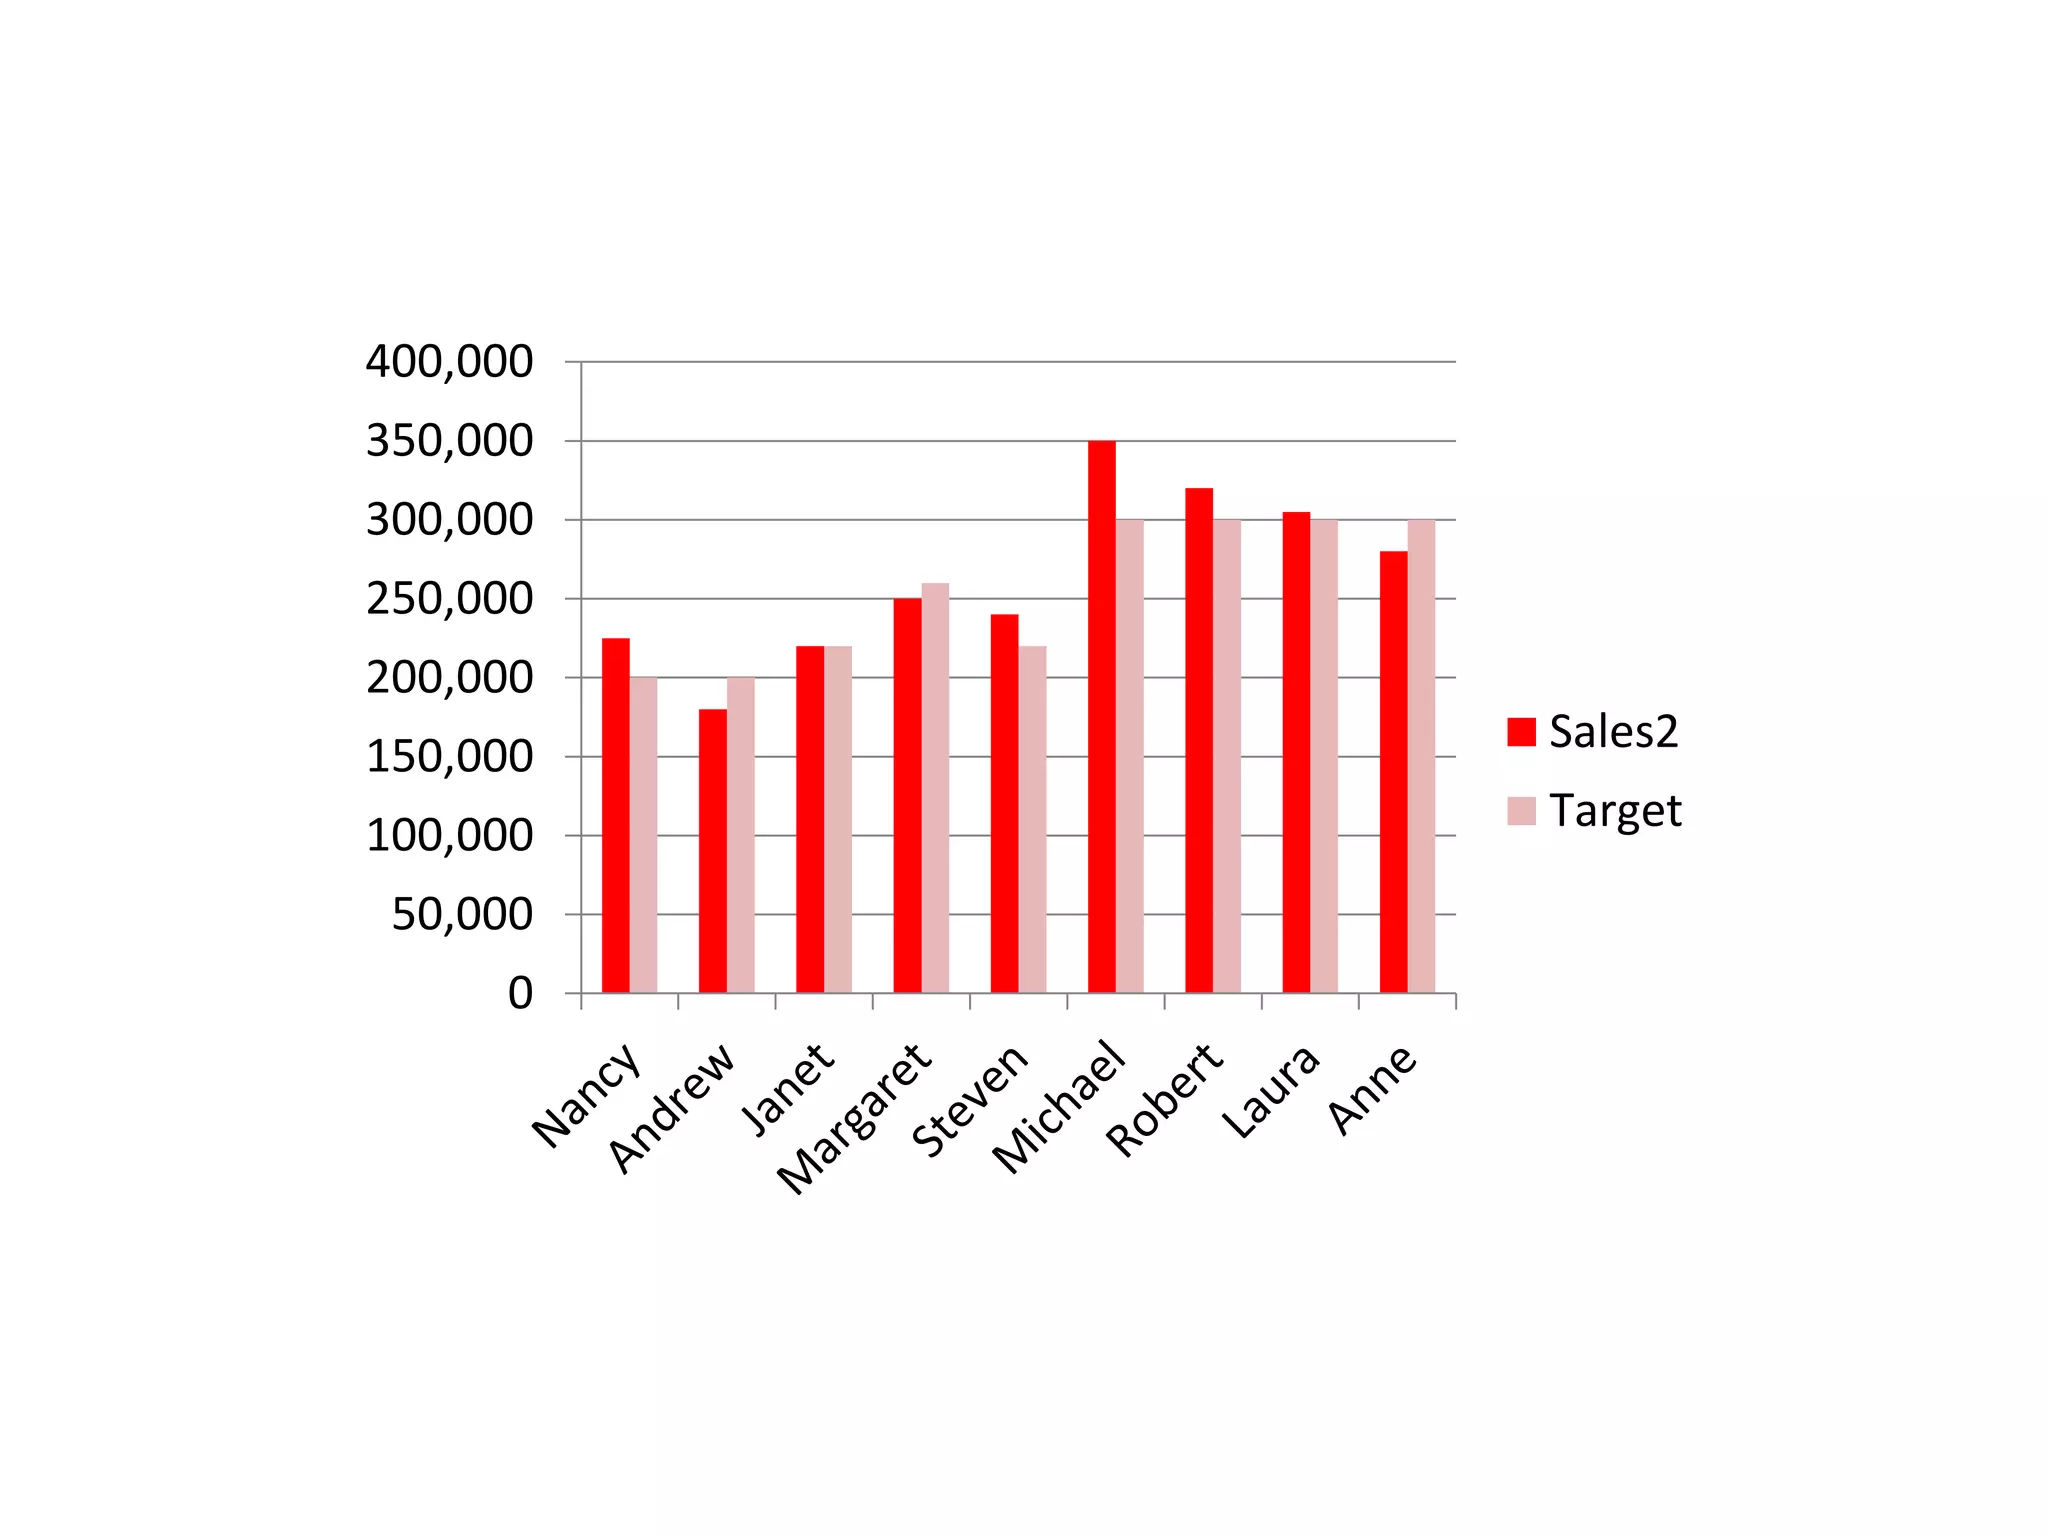
This document contains a line graph with sales data on the y-axis ranging from 0 to 400,000 in increments of 50,000, and a target line is included. The graph shows sales figures across an unspecified x-axis.