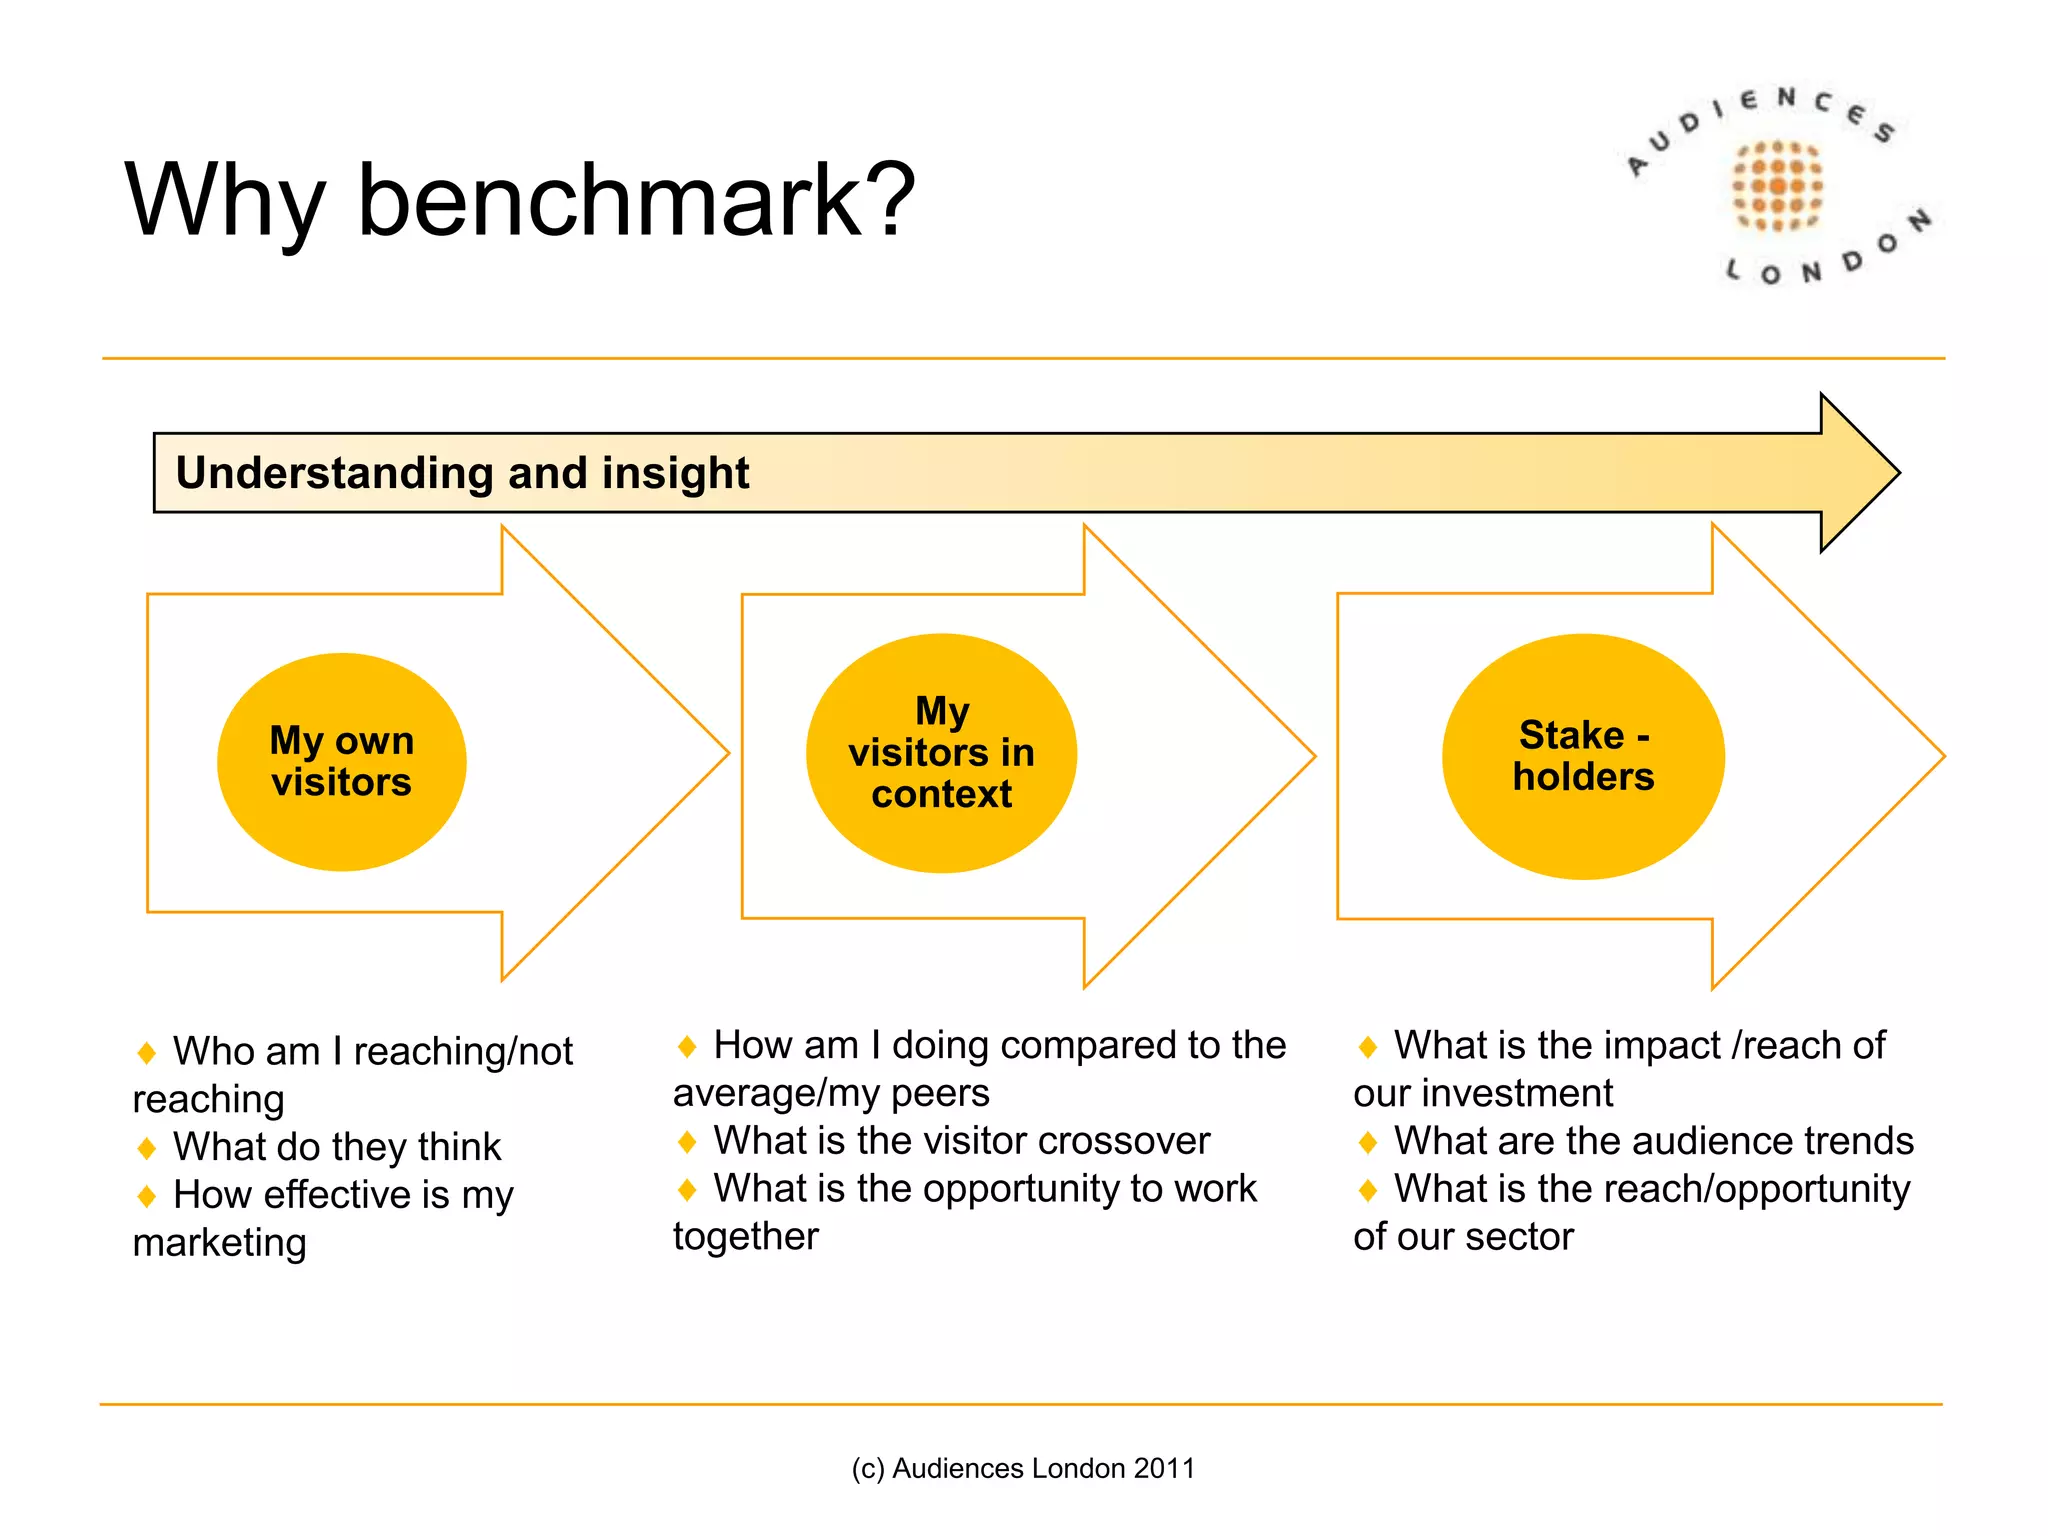
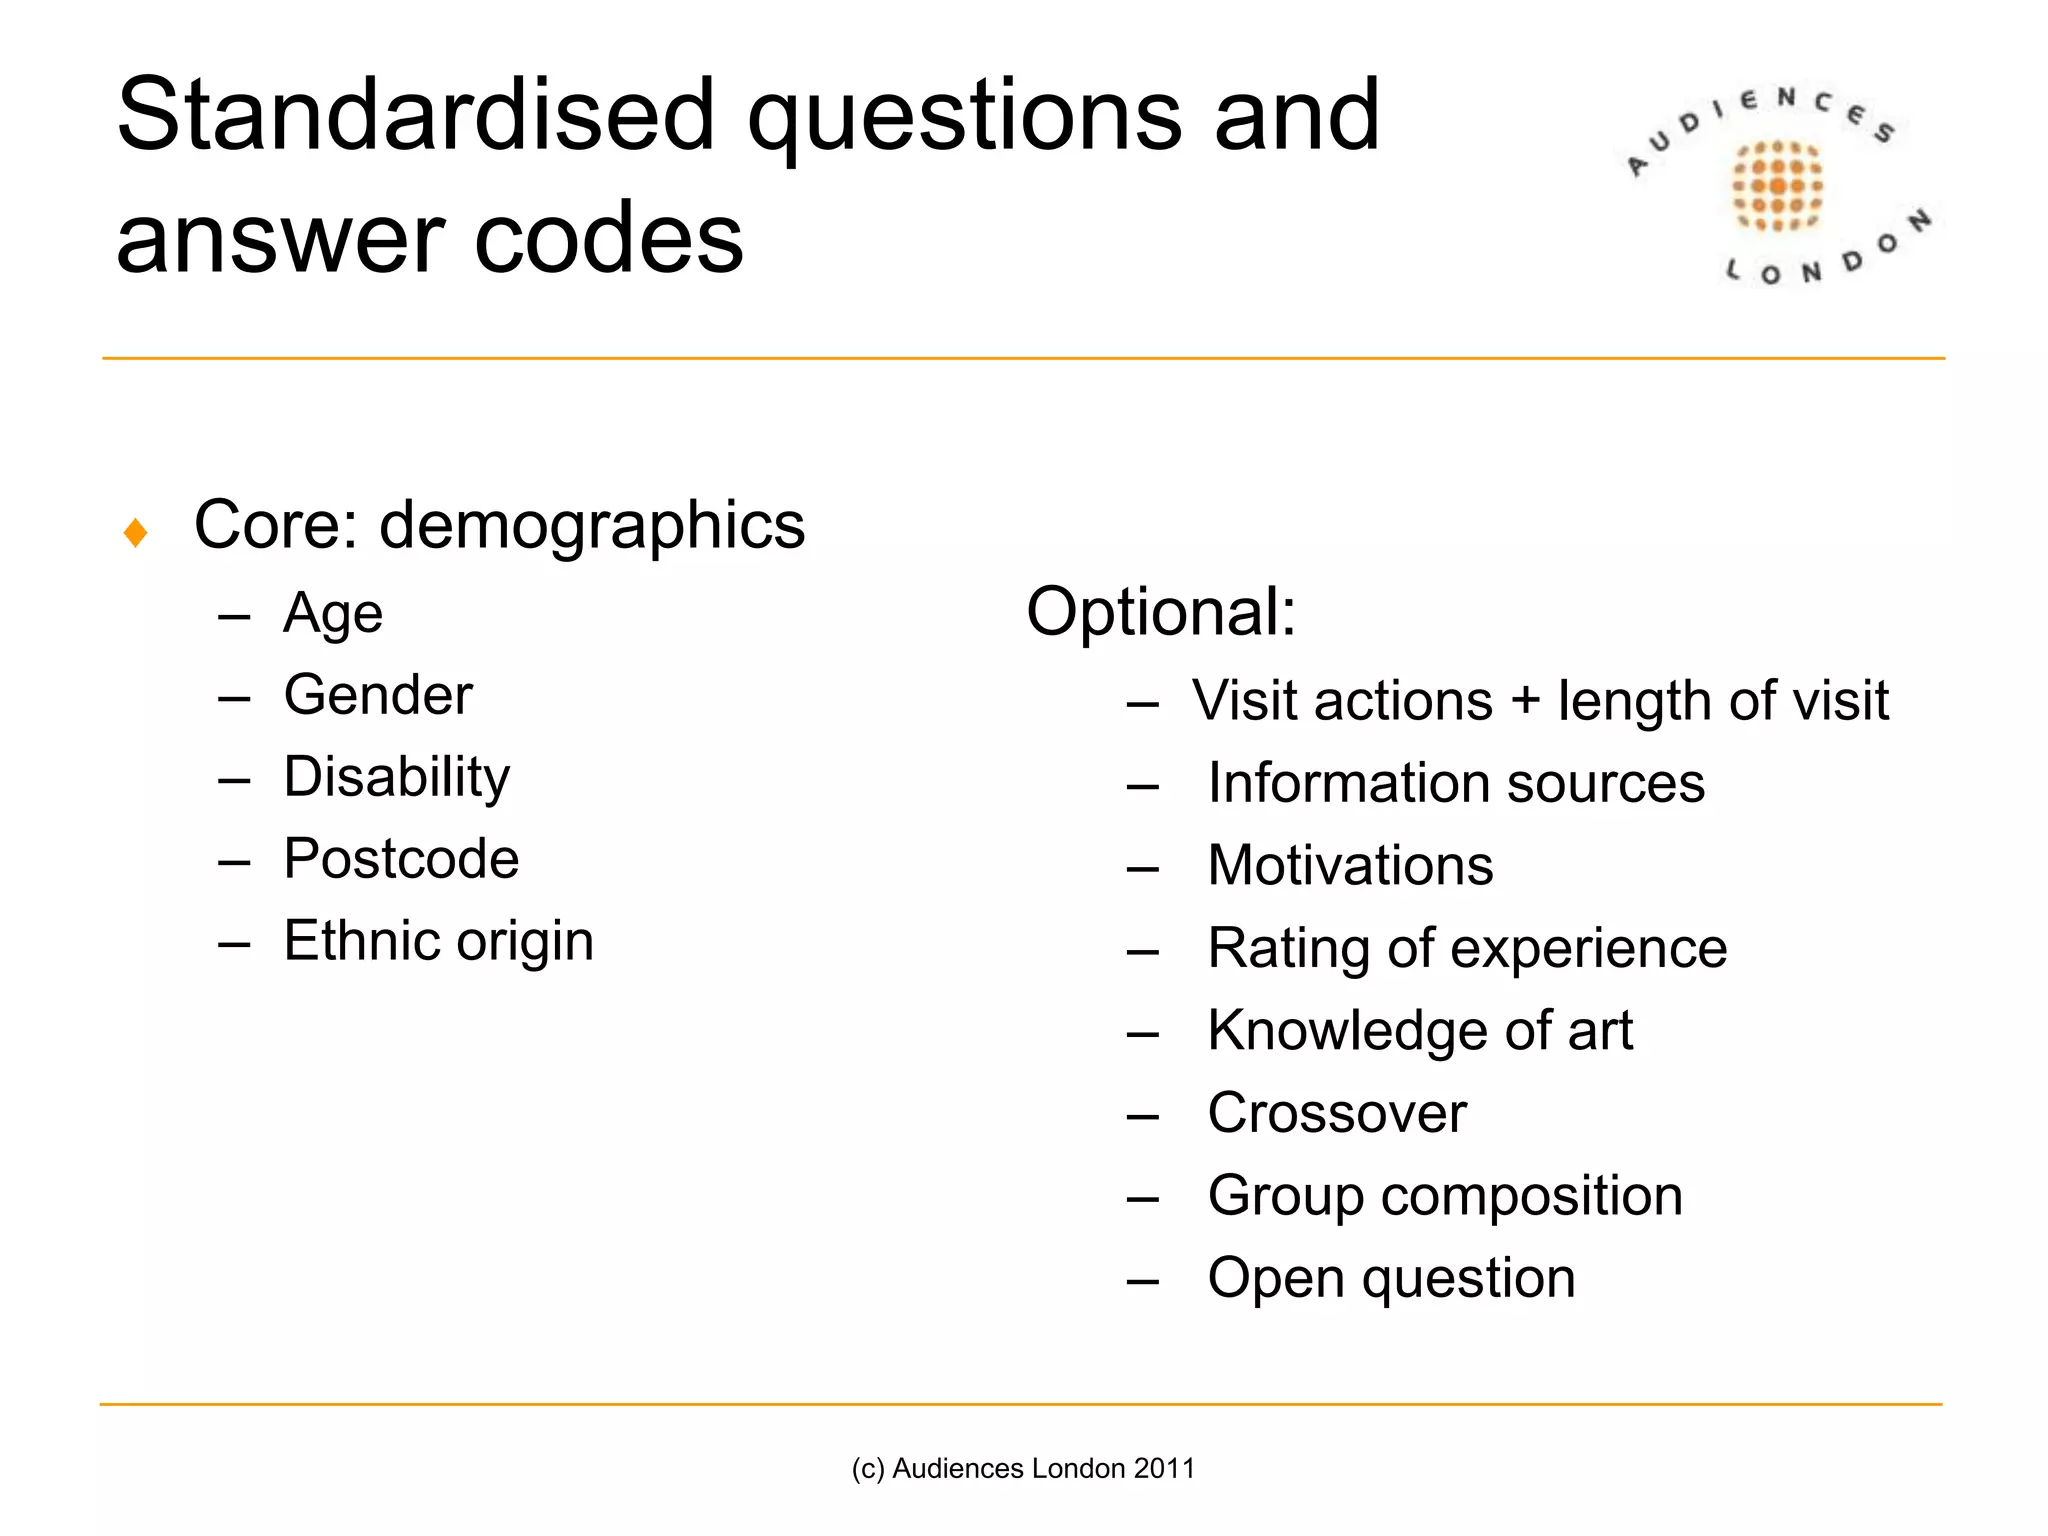
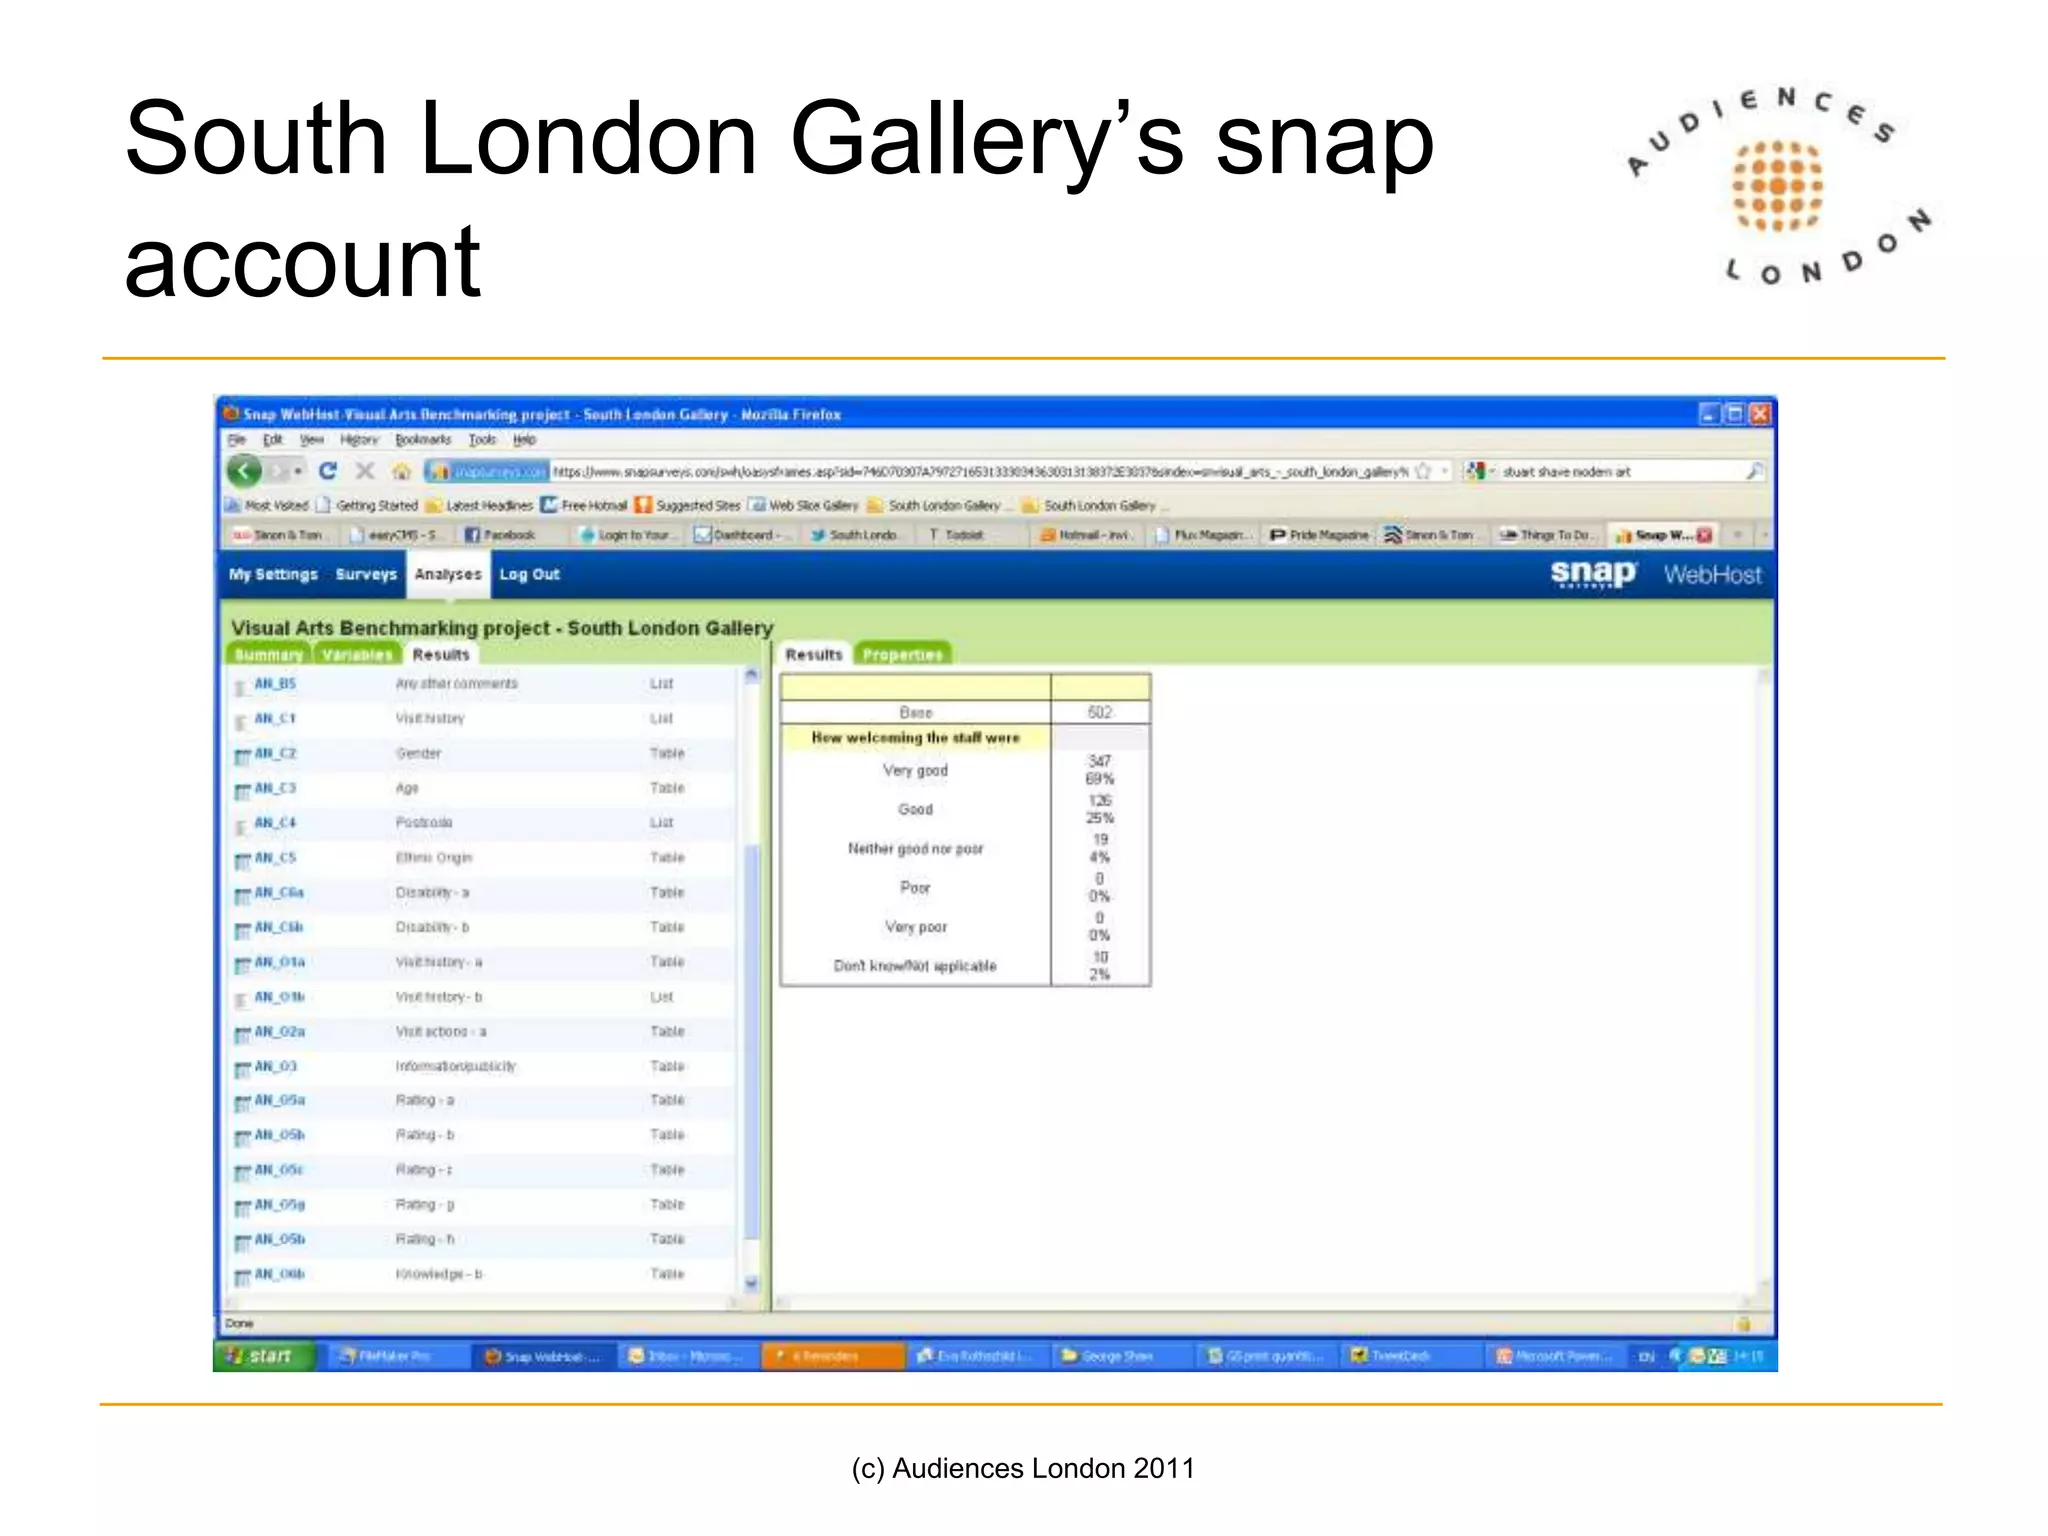
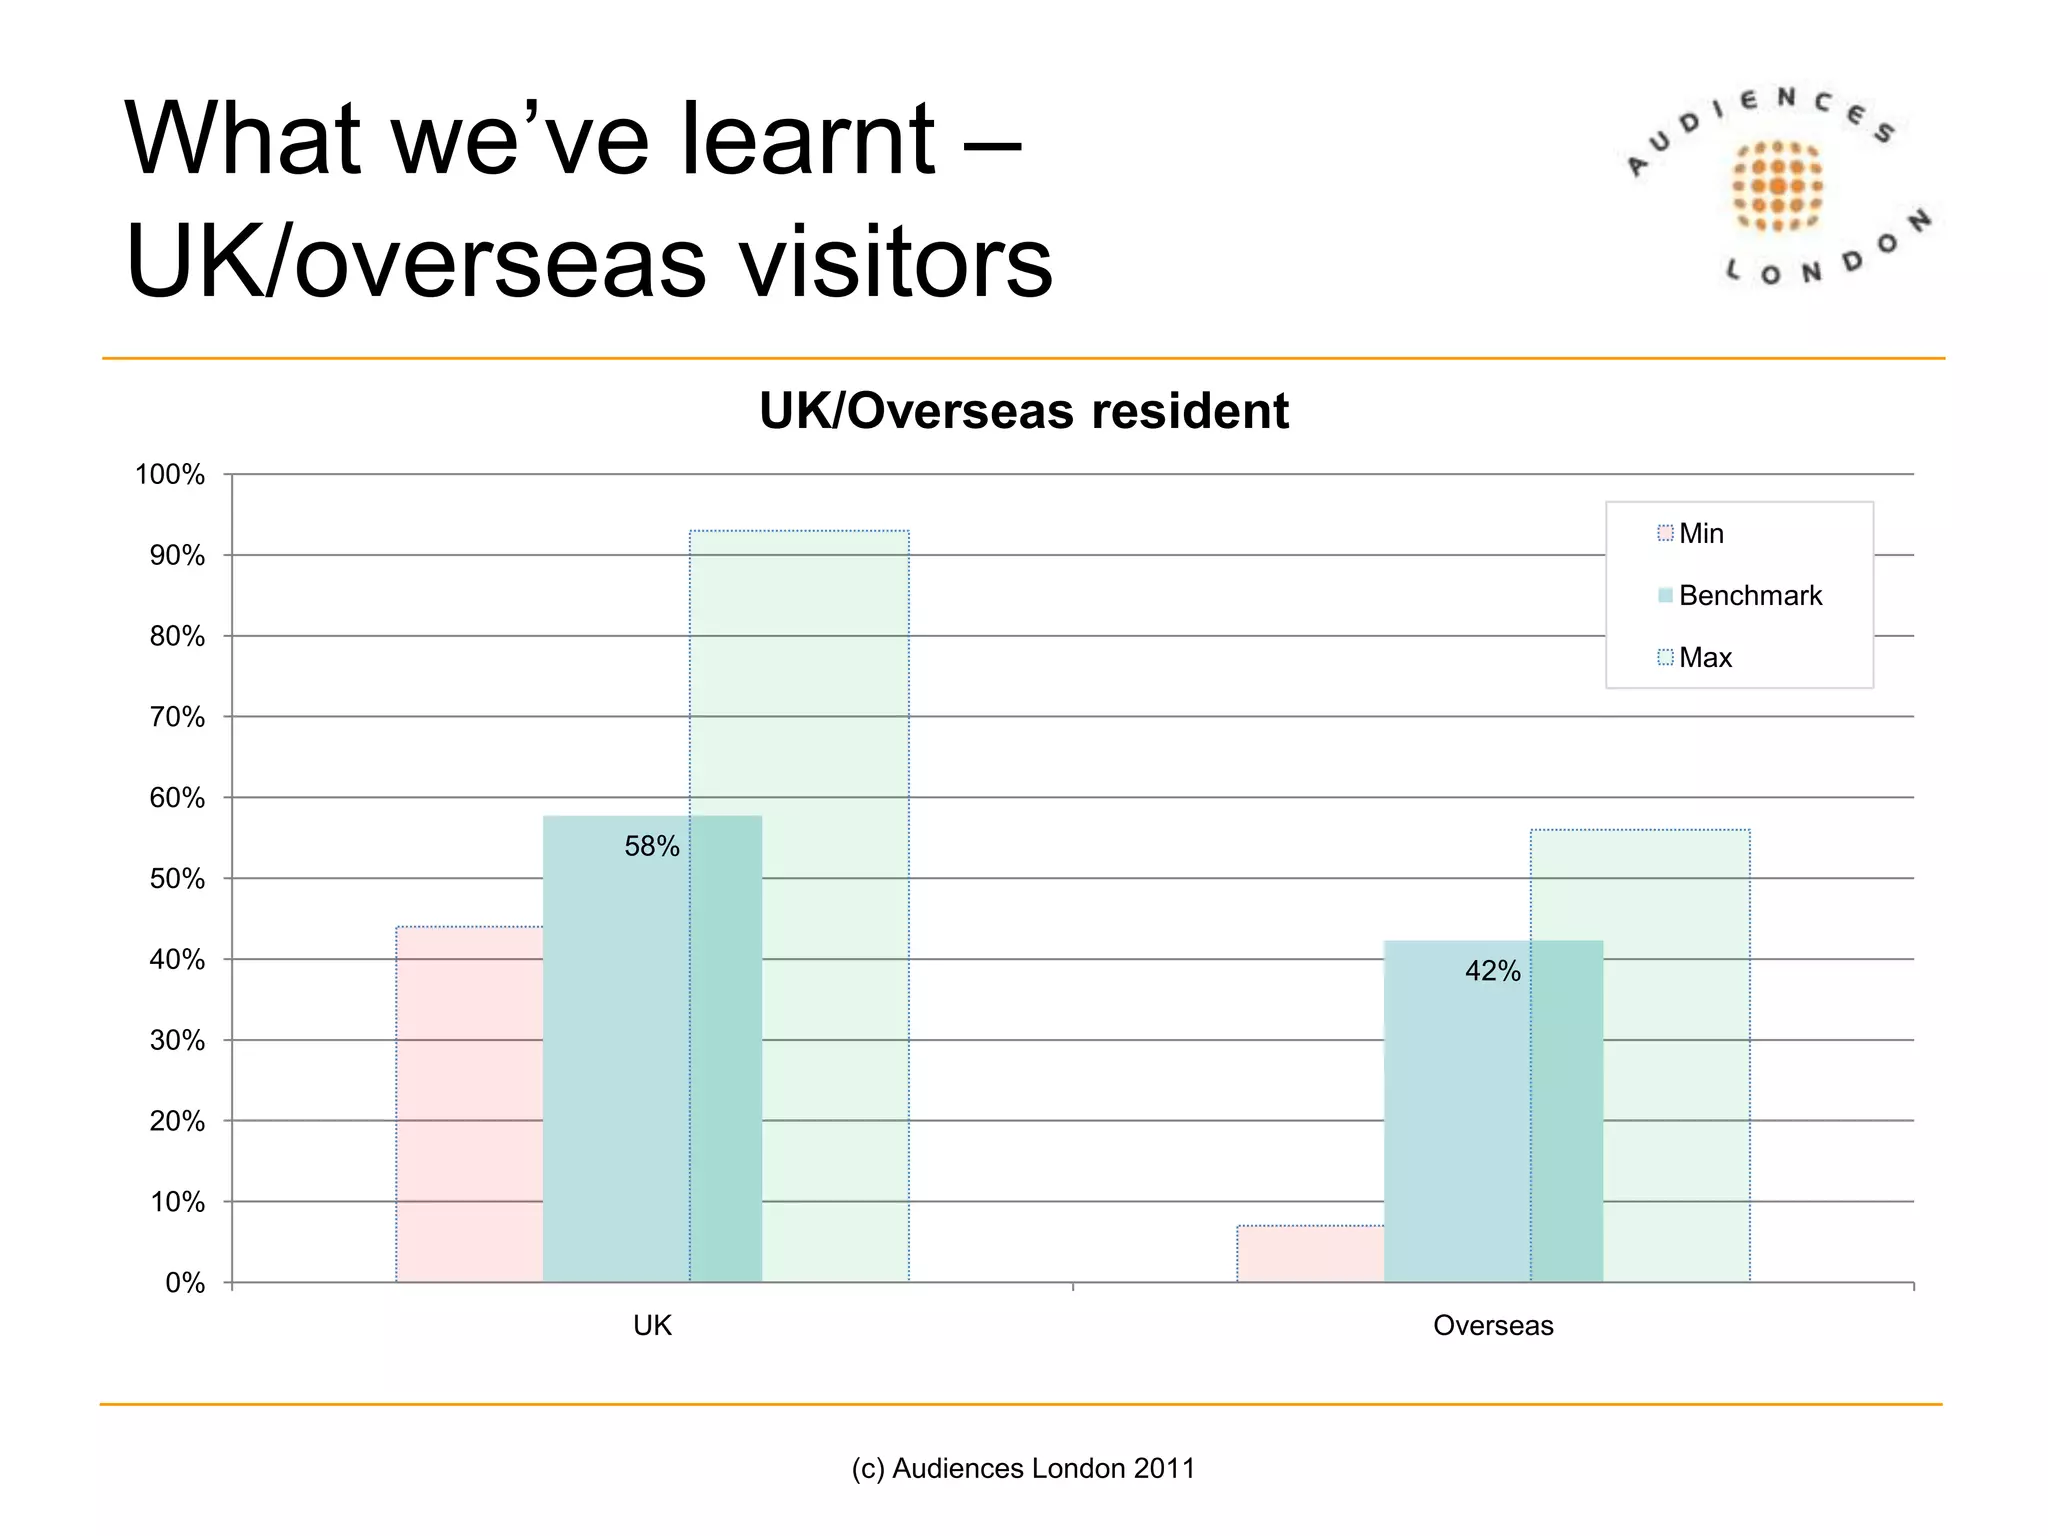
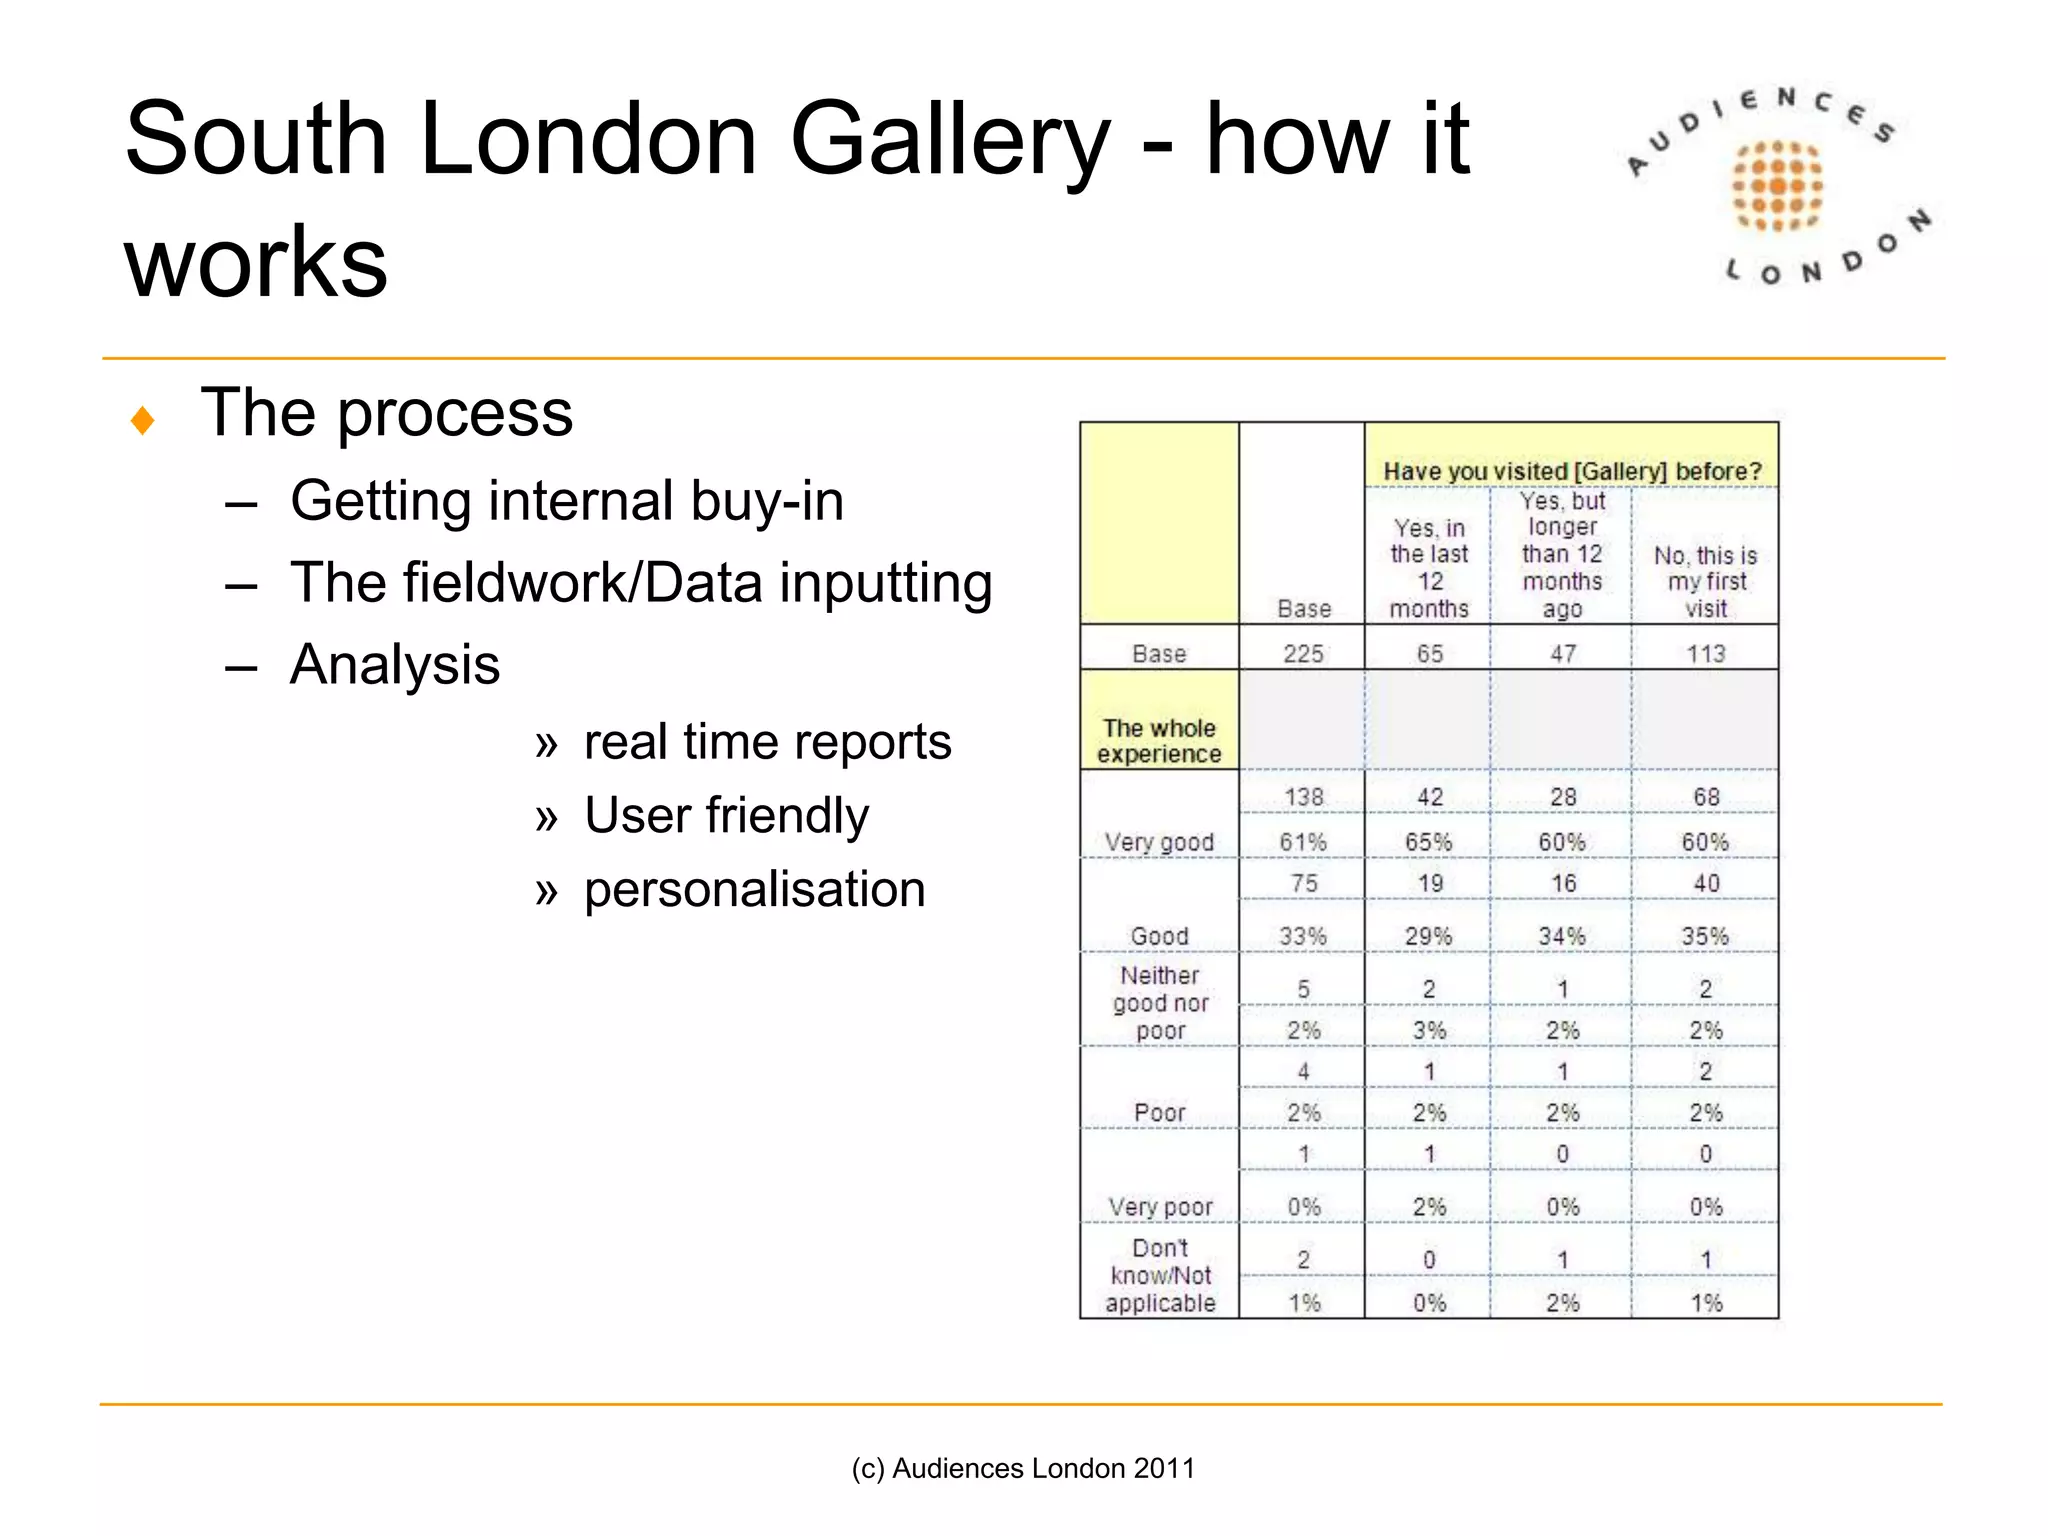
Working together to monitor and measureSarah Boiling Audiences LondonSangeeta Sathe South London GalleryMuseums and Heritage Show 2011© Audiences London 2011
Visual Arts audience benchmarkingBackgroundWhat it isWhat we’ve learntHow it is being usedFuture plans© Audiences London 2011
BackgroundConsultation with galleries and data analysisLots of existing audience research but not comparableAppetite to improve and shareStandardised core and optional questions and answersSupport programme for primary researchOn-line Data hubACE funded23 galleries(c) Audiences London 2011
Why benchmark? (c) Audiences London 2011Understanding and insight How am I doing compared to the average/my peers
 What is the visitor crossover
 What is the opportunity to work together
 What is the impact /reach of our investment
 What are the audience trends
 What is the reach/opportunity of our sector
 Who am I reaching/not reaching
 What do they think
 How effective is my marketingStandardised questions and answer codesOptional:Visit actions + length of visit
 Information sources
 Motivations
 Rating of experience
 Knowledge of art
 Crossover
 Group composition
 Open questionCore: demographicsAgeGenderDisabilityPostcodeEthnic origin(c) Audiences London 2011
Support programmeResults only as good as the data that goes inPrimary research – assisted self completion questionnairesGalleries own staff Fieldworker trainingProject spaceHandbook(c) Audiences London 2011
Data hubEach gallery own Snap online account based on core plus their optional questionsGallery staff undertake fieldworkAssisted self completion questionnairesInput dataIndividual analysis and tablesCompare to benchmarks(c) Audiences London 2011

Working Together to Monitor and Measure

  • 1.
    Working together tomonitor and measureSarah Boiling Audiences LondonSangeeta Sathe South London GalleryMuseums and Heritage Show 2011© Audiences London 2011
  • 2.
    Visual Arts audiencebenchmarkingBackgroundWhat it isWhat we’ve learntHow it is being usedFuture plans© Audiences London 2011
  • 3.
    BackgroundConsultation with galleriesand data analysisLots of existing audience research but not comparableAppetite to improve and shareStandardised core and optional questions and answersSupport programme for primary researchOn-line Data hubACE funded23 galleries(c) Audiences London 2011
  • 5.
    Why benchmark? (c)Audiences London 2011Understanding and insight How am I doing compared to the average/my peers
  • 6.
    What isthe visitor crossover
  • 7.
    What isthe opportunity to work together
  • 8.
    What isthe impact /reach of our investment
  • 9.
    What arethe audience trends
  • 10.
    What isthe reach/opportunity of our sector
  • 11.
    Who amI reaching/not reaching
  • 12.
    What dothey think
  • 13.
    How effectiveis my marketingStandardised questions and answer codesOptional:Visit actions + length of visit
  • 14.
  • 15.
  • 16.
    Rating ofexperience
  • 17.
  • 18.
  • 19.
  • 20.
    Open questionCore:demographicsAgeGenderDisabilityPostcodeEthnic origin(c) Audiences London 2011
  • 21.
    Support programmeResults onlyas good as the data that goes inPrimary research – assisted self completion questionnairesGalleries own staff Fieldworker trainingProject spaceHandbook(c) Audiences London 2011
  • 22.
    Data hubEach galleryown Snap online account based on core plus their optional questionsGallery staff undertake fieldworkAssisted self completion questionnairesInput dataIndividual analysis and tablesCompare to benchmarks(c) Audiences London 2011
  • 23.
    (c) Audiences London2011Data hub – how it works
  • 24.
    South London Gallery’ssnap account(c) Audiences London 2011
  • 25.
    South London Gallery’ssnap account(c) Audiences London 2011
  • 26.
    What we’ve learntBoroughof residence(c) Audiences London 2011
  • 27.
    What we’ve learntMosaicGeodemographic profilingBased on postcodeSplits UK population into15 Groups 67 TypesDetailed picture of attitudes, income, spending habits, family make up, education, political views, leisure habits etc(c) Audiences London 2011
  • 28.
    Mosiac Group O- Liberal OpinionsYoung, professional, well educated people who are well read, cosmopolitan in their tastes, liberal in their views and have a keen interest in the arts. Young singles
  • 29.
    Degree leveleducation
  • 30.
  • 31.
  • 32.
  • 33.
    What we’ve learntMosaicGroup profile(c) Audiences London 2011
  • 34.
    What we’ve learnt– UK/overseas visitors(c) Audiences London 2011
  • 35.
    South London Gallery- how it worksThe processGetting internal buy-inThe fieldwork/Data inputtingAnalysisreal time reportsUser friendlypersonalisation(c) Audiences London 2011
  • 36.
    South London Gallery- how it worksThe resultsConfirmed our expectations – reassuringEg. Age – slightly youngerOverseas visitors - far fewerEthnic group – fewer ‘white: other’Mosaic typesFewer Alpha Territories and Professional RewardsFewer Suburban MindsetsTwice number of Terraced Melting PotsGives context within which to understand our audienceNext step – clustering by size, location and type of work presented(c) Audiences London 2011
  • 37.
    South London Gallery- how it worksHow I’m using itEasy reporting for fundersPrompted informal digital data sharingFurther collaboration / closer working with peers(c) Audiences London 2011
  • 38.
    What’s nextFor museums- London Museum Hub pilotFor galleries - National pilot roll out to 5 pilot regions via Turning Point plus Wales(c) Audiences London 2011
  • 39.
    (c) Audiences London2011Thank yousarah@audienceslondon.org
  • 40.

Editor's Notes

  • #18 ProcessSmall organisation, few resources for research so opportunity to share process and methods with other orgs welcomed - actually seemed to ‘endorse’ our current researchAs research results rarely changed they were only ever really used for funding reports – this was an opportunity to put these results into context and hopefully make them more meaningful.FieldworkAlready using interviewers and had staff time dedicated for data entry - new system radically reduced data entry time compared with excel plus snap is user friendly (some staff find excel a bit offputting/technical) AnalysisSimple percentages on total data is instant and v. User friendly.More detailed analysis or filtering requires statistical language but AL prepared a handbook which provides the most useful ‘codes’. Even so back end is much easier than excel, i only use v. basic level but much easier esp. for cross tabs. Can filter by date eg exhibition.No personalisation but as I’m often asking the same question but in different time periods, I’ve made notes of the codes i need to enter in order to extract the data i need. Eg At least 70% of first time users rate the spaces as good or very good
  • #19 ResultsDidn’t show anything groundbreaking but confirmed what we thought we knew – reassuringAge - due to nature of programmingOverseas – not so many touristsEthnic group – again due to fewer touristsMosaic types seem to show the most interesting resultsAlpha territories 12% to 3%Professional rewards 8% to 0%Suburban mindsets 7% to 1%Terraced Melting Pot 7% to 16%Intuitively this could be due to the programme being perceived as niche/edgy, due to location on Peckham borders and also organisation has changed quite drastically in the last year previously having no facilities apart from the exhibition space so our audience is likely to be in transition.– worth probing deeper and comparing to organisations we position ourselves againstClusters may start to reveal most meaningful results and allow to galleries to understand their audience in relation to others.
  • #20 Funding reports and apps – easy to glean dataHas prompted colleagues to think about sharing other data such as on digital audience and offer – not got off the ground yetClustering may lead to collaborations with other organisations such as cross promotions or sharing good practice.