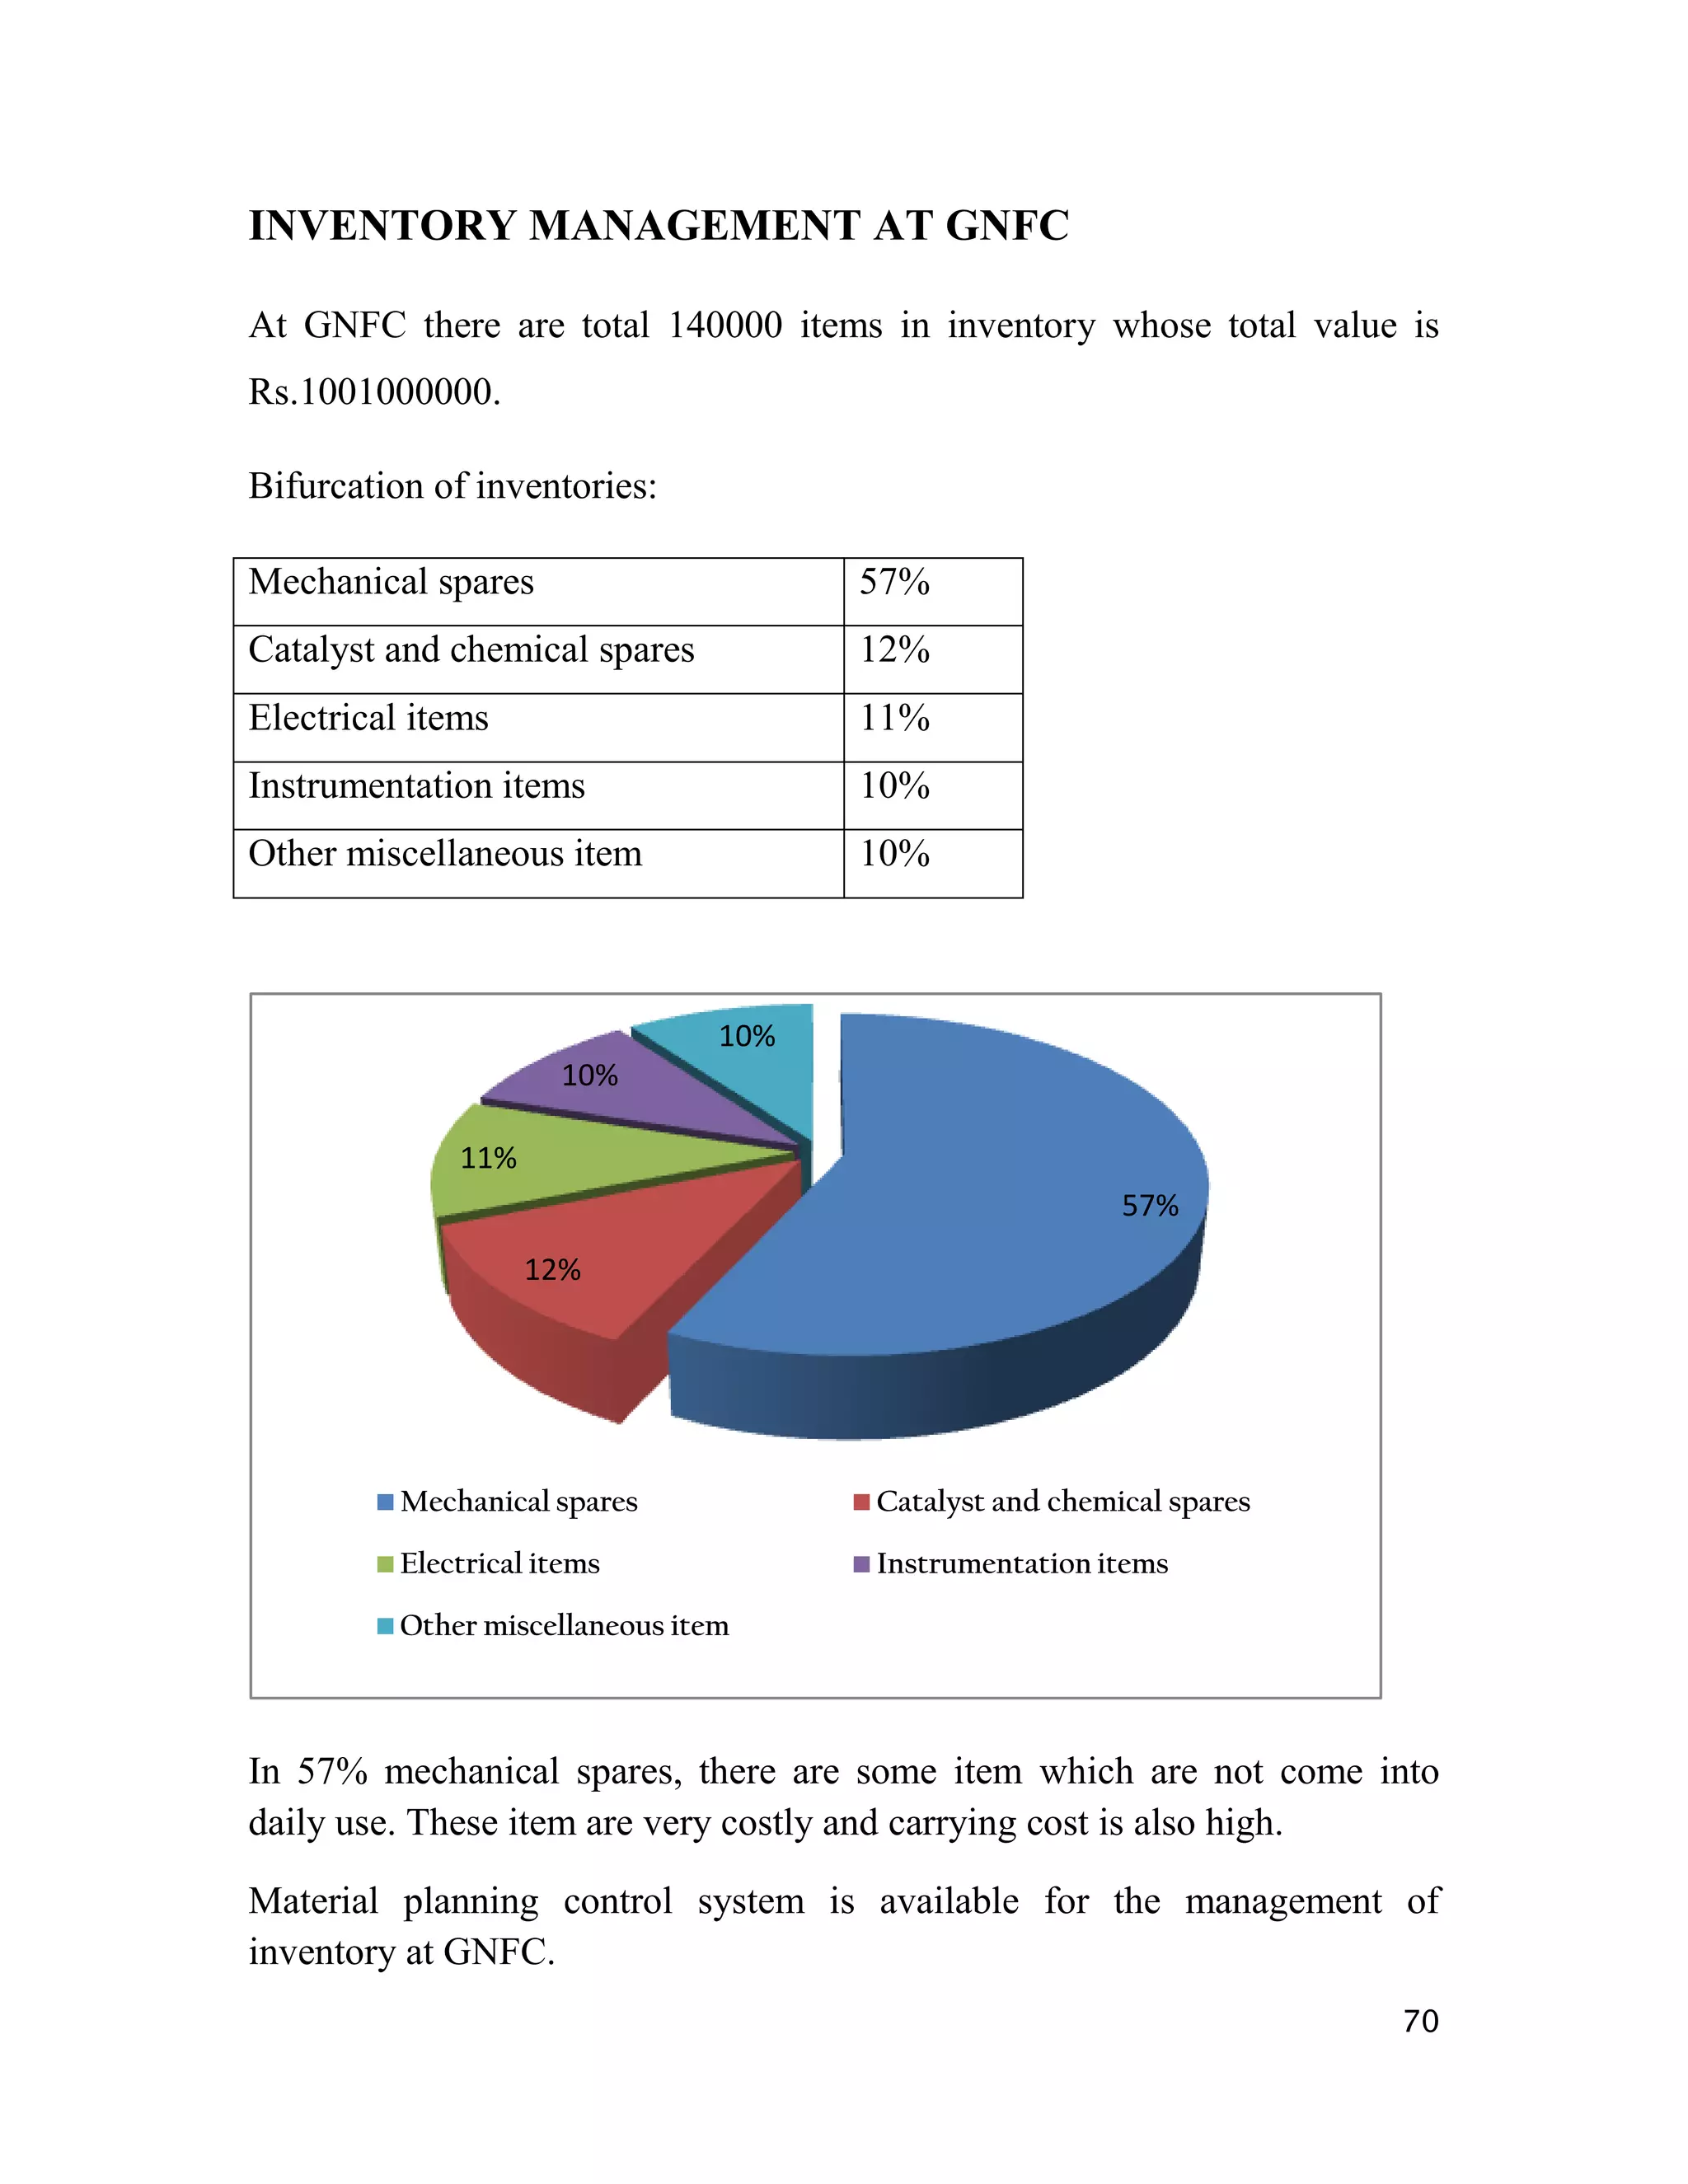
A
                     REPORT
                       ON
   STUDY OF WORKING CAPITAL MANAGEMENT
                       AT
  GUJARAT NARMADA VALLEY FERTILIZER
                  COMPANY LTD
                     BHARUCH
   SUBMITTEDIN PARTIAL FULFILLMENT OF THE
      MASTER OF BUSINESS ADMINISTRATION

                 ICFAI UNIVERSITY


SUBMINITTED BY
VIVEK.D. PATEL


PROJECT GUIDE
MR.A.K.TRIVEDI (GM-FINANCE)
MR.D.R.PANCHAL (PS-FINANCE)


           OMEGAN SHOOL OF BUSINESS
                   BARODA
                    2008-2010

                                            1
ACKNOWLEGMENT
This summer training project has been a wonderful learning. We are very
thankful to have got this opportunity to work on a satisfying project on
“STUDY OF WORKING CAPITAL MANAGEMENT OF GNFC.”

We have gained in depth knowledge on this topic. Apart from this we have
had a wonderful feel of the corporate environment and how an organization
functions.

We are very thankful to the management of GNFC for providing us the
golden opportunity to do 8 week training. We would like to thank
Mr.N.K.Patadia (AGM-TC) to grant us for training. We also express out
thank to Mr.I.P.Bhatt (SM-TC).

We are immensely grateful to Mr.A.K.Trivedi (GM-Finance) who has
guided us during the project and our special thanks to Mr.D.R.Panchal (PS-
Finance) who has guided us and helped us a lot throughout the training.

We are also thankful to manager Mr. R.B.Kayastha (Banking Section) who
has guided us for studying working capital management.

We are also thankful to chief managers Mrs.J.M.Kavina, Mr.V.C.Bhatt,
senior       managers   Mr.U.N.Gohil,      Mr.P.H.Gadhi,      Mr.U.V.Parmar,
Mr.R.M.Patel, and managers Mr.A.B.shah, Mr.R.B.Shah, Mr.A.R.Shah,
Mr.R.S.Patel, Mr.M.H.Dave, Mr.N.N.Modi, Mr.M.S, Talukdar, in charge of
different section for making us aware about their particular section.


                                                           Vivek Patel
                                                                          2
PREFACE

     There is an ancient proverb practice makes man perfect.
It indicates practice makes the person more practical and
provides training and knowledge through which we can handle
related satiation.


     As a part of study I have to take training and collect in
formation of com any and present as in the form of project
report of the company to university.


     Here is given the project report of GNFC Bharuch .I
visited for my practical study and it is great experienced.
Fertilizers are and very good commodity and I try my level best
to collect the information for the same.


                                                              3
INDEX

Sr No.                     content                Page No.

1.       Company Profile                          5

2.       Brief Study Of Finance Department        11

3.       Working Capital Management               36


         Calculation of operating cycle of GNFC   39


         Calculation of Working Capital           51


         Cash management                          58


         Inventory management                     65


         Receivables management                   78


         findings                                 84


         conclusion                               85


                                                             4
COMPANY PROFILE
GUJARAT NARMADA VALLEY FERTILIZER COMPANY LIMITED
(GNFC), is a joint sector enterprise promoted by the Government Of Gujarat
and the Gujarat State Fertilizer Company Ltd (GSFFC). It was set up in
bharuch, Gujarat in 1976. Located at bharuch in an extremely prosperous
industrial belt, GNFC draws on the resource of the natural wealth of
the land as well as the industrially rich reserves of the area.

GNFC started its manufacturing and marketing operation by setting up in
1982, one of the world‟s largest single-stream ammonia-urea fertilizer
company. Over the next few years, GNFC successfully commissioned
different projects in fields as diverse as chemicals, fertilizer and electronics.

Since inception, GNFC has worked towards an extensive growth as a
corporation. A growth which respects the environment and springs from the
progressive vision of GNFC.

GNFC today has extended its profile much beyond fertilizers through a
process of horizontal integration. Chemicals/Petrochemicals, Energy Sector,
Electronics/Telecommunication         And Information Technology from
ambition and challenging additions to its corporate portfolio. GNFC has
enterprising, strategic view towards expansion and diversification.

Amidst sylvan surrounding and lush green landscapes, nestles
Narmadanagar, a peaceful about for those who make GNFC what it is. A
club house, Tennis court, Swimming pool and an open air theater provide
recreations for GNFC personnel.

Narmadanagar also has a 32-bed hospital, with modern systems and
equipment, and a temple.

Narmadanagar is designed to serve the Ideals of community living,
encourage fraternity among all GNFC members, and integrate the
various interests and inclination of all the individuals.


                                                                               5
GNFC is wedded to the prosperity of the farmers. It interacts with them on
selection of seeds, on correct application of fertilizers, on scientific farming
methods and on land and water management. A large soil testing laboratory
offering free service, mobile fertilizer sales units for remote areas, field
demonstrations, farmers camps and educational visits and the adoption of
districts and villages under an intensive fertilizer campaign -- all provide for
a direct linkage with the farmer. GNFC also reaches out to the farmers
through mass media communication and mobile audio visual units.

GNFC runs a school in the township of Narmada agar, and has also
sponsored a College for Science, Technology and Commerce.

GNFC has a full-fledged training and development facility for human
resources, which is equipped with audio-visual systems, simulators,
comprehensive laboratory and workshops.

Shareholding pattern of GNFC:-

                                                      % of Total Equity
                         Holders
                                                           Capital
      Promoters                                                     41.18

      Mutual Funds & UTI                                            11.05
      Bank, Financial Institutions & Insurance
                                                                    13.41
      Companies
      Foreign Institution Investors                                  4.13

      NRIs / OCBs                                                    2.11

      Corporate Bodies                                               4.90

      Co-operative Society                                           0.23

      Indian Public                                                 22.92

      Shares In Pool A/c                                             0.07

                         TOTAL                                    100.00


                                                                              6
Board of Directors
Smt. Sudha Anchlia        IAS Chairperson & Managing Director
Shri S Jagadeesan         IAS   Director
Shri P. N. Roychaudhari   IAS Director
Shri M. M. Srivastava     IAS Director
Shri H. V. Patel          IAS Director
Shri Pankaj Kumar         IAS Director
Dr. TT Ram Mohan                Director
Shri D. C. Anjaria              Director
Dr. Ashok Shah                  Director


Executive Directors 3
Shri J. S. Kochar
Shri S. M. Shah
Shri K. C. Jatania
Shri A. D. Modashia


Company Secretary
Shri R.B.Panchal
Auditors


M/s SR Batliboi & Company,
Chartered Accountants,
Mumbai
                                                            7
Registered Office
P. O. Narmadanagar- 392015
District: Bharuch
Gujarat, INDIA

Products
      Methanol
      Acetic Acid
      Toluene Di-isocyanate
      Aniline
      Formic Acid
      Concentrated-Nitric Acid
      Weak Nitric Acid
      Ammonium Nitric (Melt)
      Methyl Formate
      Nitrobenzene (NB)
      Calcium Carbonate
      Hydrochloric Acid
      Ortho Toluene Diamine

Services
Fertilizer plant
GNFC started fertilizer manufacturing and marketing operation by setting up
in 1982, one of the world‟s largest single-stream ammonia-urea fertilizer
complexes.

GNFC today is one of the leaders in fertilizer industry. The company is
engaged in manufacturing and selling fertilizer such as Urea, Ammonium
Nitro phosphate and calcium Ammonia Nitrate under the umbrella Narmada.
GNFC has to phosphate and calcium Ammonia plant, a reference plant in the


                                                                         8
world of fuel oil based technology along with the world‟s largest single
stream urea plant.

Chemical plant
GNFC has kept pace with changing times and its vision is always focused on
growth. Even as the company was implementing its fertilizer complex, plans
were underway for expansion and diversification in related areas. This
resulted in the up of core chemical and petrochemical plants such as
Methanol, Formic Acid, Nitric Acid and Acetic Acid.

These industrial chemicals are used by a wide range of manufacturers,
processors and chemical operators in India and even abroad. While methanol
finds application in chemicals, resign etc. Formic acid is used mainly in
rubber, textiles, tanneries and pharmaceuticals industries. Both methanol and
formic acid are regularly being exported to international markets.

IT Tower

An it division of GNFC it offers digital certificates that can integrate with
application such as emails, workflow, enterprise wide application, or secure
VPNs. The digital certificates can use by individuals, corporate and
governments to secure online B2B/B2C applications and other online
transactions.

It has promoted a portal called www.nprocure .com offering end-to-end
electronic procurement services provider. It also designs and builds world
class data center infrastructures and also offers a wide range of security
services which include managed IT services & secure infrastructure design
& building services.


                                                                           9
ORGANISATIONAL STRUCTURE
          Board of Directors


   Chairperson & Managing Director


         Executive Director


          General Manager


      Additional General Manger


           Chief Manager


           Senior Manager


              Manager


            Senior Officer


               Officer


                Staff
                                     10
FINANCE
DEPARTMEN
    T


            11
GNFC have a finance department for transacting all types of financial

dealings. The finance department is the integral part of any organization

which plays pivotal role in all organization. Because money is the medium

without which we can even think to do anything. And finance department

can only solve the problems which are arises for the money .finance

department dealing with the sources of fund and application of the fund. To

take any operation any operation in the consideration we must have to

budget it according to the financial condition of the organization. And

foremost is that to handle this financial department GNFC has its own latest

technology through which I can run financial activity smoothly.


                                                                         12
FINANCE DEPARTMENT MAINLY DEVIDED IN THE
FOLLOWING SECTION:


        Bills Payment Section

        Marketing Account Section

        Bank Section

        Establishment Section

        Insurance Section

        Indirect Tex Section

        Central Account Section

        Concurrence Section

        Stores Account Section


                                           13
BILLS PAYMENT SECTION

The task of the bills payment section is to make payment for purchases made
for the company.

Company has to make various kinds of purchases for carrying out its
operations. Like raw material purchases, purchase of the services and
other purchases. Generally company asks for 30 days of credit.


    RAW MATERIAL PAYMENT


      RAW MATERIAL PAYMENT               SUPPLIERS

      OIL                                IOC: INDIAN OIL CORPORATION

                                         INDIAN SECL: OUTH EAST COAL
      COAL
                                         LIMITED, IMPORTED CHINA

      NATURAL GAS                        GAIL, ONGC, GSPC

      BAGS

      CHEMICALS                          GACL

      PHOSPHATE                          RAJSTHAN


                                                                        14
 Transport of the raw material by railway then by lorry to the plant.

 In case of gas through pipeline directly send to the plant, in short no

   storage. And form main pipeline to other departments.

 In material if the purchase up to 1.5 lakh then decision authority given

   to purchase department.


 SERVICE PAYMENT


   This section carries out the activity of payment of the services like

   advertising, stationary, security, canteen, computer related services,

   medical related services etc.


 WORKS PAYMENT

 Contractor for building repairs, machine repairs, paints and work

   related.

 Road contract, gardening, garbage cleaning, hospital cleaning and

   many more they all are get their payment from this section.

 Fixed cost for the stoppage of machine and operation is very high

   that‟s way much planned decision is to taken.


                                                                         15
Material requisition letter


                        Inquiry by purchase department


         Shield cover not opened without the presence of person of
                    Finance department (concurrence)


                      department (concurrence)
                Comparative statement is prepared by purchase
                        Department (decide lowest 1, 2, 3)


      Finance department decide and order made by purchase department


 In this section if contract amount is up to Rs. 50,000 then decision
  taken by purchase department only.
 If higher then this amount then

Below Rs. 5000                 Below Rs. 50000               Annual rate
                                                             contracts
    Known as                   Service order is
    first and final            must                          Gardening
    bill
                               Various                       Running bill
    Works
                               certificates are              (within 30 days
    emergency
                               required like,                to part)
    Payment by                 completion, no
    own                                                      It early required
                               claim, no object
                                                             then cut interest
    Puts bill with                                           at 14.5% and
    the sign of
    AGM                                                      payment is made.

                                                                           16
CONTRACTOR BILL

 Final bill is paid within 30 days.
 Three years renewal contract is possible.
 Form    every month payment 5% security and 5% retention will be
   deducted. (purpose: if contractor leave before completion of month
   then payment to labors from above fund created by deduction)
 If   while contract is undertaken perfectly, then retention deduction
   given back immediately and security deduction within 12 months
   without interest.


 FOREING PAYMENT


 Most of plants are imported form foreign. Letter of credit in the favor
   of wander containing the information like amount, mode of transport
   etc.
 In case of imported service on IC just service order (so) is enough.
 Insurance by company form the ware house of wander to company.
 Payment as per the current rate of foreign currency.
 All imported goods collected at Mumbai ports.
 Liaison office at Mumbai and Delhi.
 Import as per the RBI‟s guidelines having import license.


                                                                         17
BUDGET AND COST SECTION


In any organization forecasting and future planning is necessary factor and it

plays pivotal role in any sector. Strategic or long term planning requires

specification of objective towards which future operation should be directed.

These objectives should answer a no of fundamental question about the

company future growth and development.


The objective of budgeting is as follows,

    Plan and co-ordinate all activities of business,

    Quantify expectation in physical and monetary,

    Co-ordinate all action,

    Provide a base for control of function,

    Examine area of uncertainty and risk.


                                                                           18
BANK SECTION

Communicating details of budget policy and guidelines those
       responsible for the preparation of budget


             Determine the limiting faction


          Negotiation of budget with superior


          Initial preparation of various budgets


           Final acceptance of review budget


             Ongoing review of the budget


                                                       19
BOB
                                                  SBI
                          35%
                                                  10%


         HDFC
                                                         Canara
           5%
                                 Consortium
                                                          10%


                SBI
                                                   BOI
                25%
                                                   10%
                                  ICICI

                                   5%


 LONG TERMS FUND (DEBT EQUITY RATIO)
 Decisions are taken by CPG
 In second step all other department with CPG check the viability and
   feasibility of production and plans.
 Range of interest rate 11% to 15%
 The amount to be transferred to reserve and surplus out of profit is
   depending upon the policy of the management.


                                                                   20
 Board getting loan from bank information like, B/S, P&L A/C, cash
      flow statement, ratios and whatever required presented in the format
      given by following.
          TONDON COMMITTEE
          CHORE COMMITTEE

              INDIRECT TAXATION SECTION

There are mainly tow factor in which the whole indirect taxation cell section
is working,

                                     VAT
                        (VALUE ADDED TAX)
VAT is the state revenue income. And it is all about in the hands o the
government. In the factor mainly three things are to be considered which are
as follows;

A. REGISTRATION

    To start any business every business has to registrar with the registrar
      of the company.
    As soon as department gets register with the registrar of company and
      gets the certificate this is with the tin no which is of 11 digits.
    As any time when the tin no is necessary for that the company can
      also use the rubber stamp for the same.
    The maximum rate for that 16%.
    4% VAT and 1% additional tax is paid by the GNFC.
    12.5% basic tax +2.5% additional taxes for the VAT.


                                                                            21
 If the any change is to be made in the rate of the VAT then the
    company has to mention on every product.
  The VAT amount collected as the way of the sell of product.
  This tax the company has to pay to government with the prescribed
    rate and before depositing it, the dealer has deduct tax which he has to
    deduct tax which he has paid to supplier at the time of purchase.
  In short whatever it purchases within Gujarat is available as input tax
    credit.

B. PAYMENT

  The payment is to be made to government in subsequent month on or

    before 22nd date of the subsequent month.


C. RETURNS

  It means submission of date such as;

        Sales amount,

        Purchase amount,

        VAT payable amount,

        VAT receivable amount,

        Net payment payable to government, payment date,

        Payment date,

        Chalan number etc.


                                                                         22
 The return may be monthly basis or quarterly basis.

  Second return is to be known as annual return, where the dealer has to

    give the details for 12 months of period.

  Return is to be file within 30 days from the completion of month/

    quarter.

  In the case of annual return it has to be filed within 90 days from the

    completion of the accounting year.


D. AUDIT

  If the more sales or purchase turnover more than 1 crore Rs. Which

    has the taxable turnover more than 20 lacs, then dealer has to audit the

    vat returns and submit to the government in prescribed form.


E. PENALTY IN THE VAT

  18% rate of interest as applicable on the amount up to the delay in

    payment.

  Rs.100 per month is the penalty for delay in submission of return

    whether monthly or quarterly.


                                                                         23
CST-CENTRAL SALES TAX

  The rules are frame by central government CST rule will apply where

    there is transaction between tow dealers of different states.

  Payment returns, audit report rule applicable as per the vat for CST

    transaction.

  The payment of VAT/ CST is to be made to government whether the

    same has been received by dealer or not.


                                   ST
                        (SERVICE TAX)

  Service tax is the preview of the central government.
  Rules and regulation are formed by the central government.

A. REGISTRATION

  Service tax sell is falling under central excise and custom and service
    tax rules.
  The rate of service tax is 12% +2% education tax on service tax and
    1% higher education tax on service tax. In total rate will be 12.36%.
  Service tax is charged by the service provided in invoice so separately
    the service tax amount.
  Prescribe limit of service income is 10 lacs in current year, where the
    service provider has not to register with service department.


                                                                            24
B. PAYMENT

  The payment is to be made on before 5th of the next month except
    March month on the service income received during the payment
    period.
  The payment can be made on monthly or quarter basis as per the rules
    mentions rules in the law.

C. RETURN

  The returns are on half year basis April to September and October to
    march.
  The retunes are to be filed within 25 days on completion o the half
    year.

D. SERVICE TAX PENALTY

  13% is the rate of interest is applicable for the delay in days.

E. PENALTY IN CASE OF FILLING RETURN

  Rs. 500 is the penalty for filling a return after due date but within 15
    days of last date.
  Rs. 1000 for delay in submission of return within one month after due
    fate of return.
  After 1 month penalty will be Rs.2000for any month.


                                                                        25
Other information related to this section is as follows:

   There are 144 services which are covered under service tax rules.

   In 5 services the receiver has to pay service tax to the government as

     per the rules.

   Following are the industry in which the service tax is not applicable;

         Consulting services from abroad,

         Good transported by road,

         Sponsorship,

         Financial institution.


                                                                         26
CONCURRENCE SECTION
Concurrence means pre audit of the file paper. As per the company policy,
on purchase order will place without financial concurrence section the main
objective of the financial concurrence is to competitive rate new Para when
ever company receiver tender, it should be opened in the presence of the
financial officer.

After opening tenders, technical analysis is done by indent person, and then
concurrence section comes in to light.

The main activity the concurrence section is to prepare competitive section
and negotiate with party, comparative statement mainly include- rate, days
credit sales tax, excise duty, insurance, freight experience.

Financial concurrence is used as a tool of internal control and budgetary
control in all government and government controlled organization and some
large private sector companies.

Purpose
Financial concurrence system is normally used as tool of

    Internal control.
    Budgetary control, and
    Cost control.

Moreover, the system also ensures that at each and every stage of
procurement commercial and financial points are taken care of while the
procurement process is on. This helps in avoiding ambiguities and delays at
the stage of ordering and execution.


                                                                         27
CENTRAL ACCOUNTS SECTION


Central account department works as coordinator.


    This department collects financial information and figures from all

      other departments and prepares final accounts.

    Quarterly results as well as final results are to be prepared as per the

      requirement of the accounting standards and according to the

      company‟s act 1956.

    Approval of the board of director is essential before publishing

      quarterly results.

    Financial statement prepared by this section is the mirror of

      company‟s performance in which company‟s image can easily traced

      out.

    Annual and quarterly both reports are audited.

    Monthly profitability is also finding out for the internal use only.

    Audit is done by sampling method using advanced software.

    Depreciation is calculated as per the “straight line method.”

    FERTILIZER INDUSTRIAL CO-ORDINATION COMMITTEE

      provides subsidy by the amount of difference between price fixed by

      FICC and cost to company.
                                                                            28
ESTABLISHMENT SECTION


   This section deals with transaction of employee remuneration. Major
   functions of these sections are,

       Salary payment (as per grades)
       Loan employee
       Leave encasement
       Payment of travelling allowances
       Payment of medical,
       Facility payment.


  A salary paid on the 25th of the same month,
  Bonus as per the union and management decision (ad hawk policy),
  For gratuity, provident fund, pension trust is created.
  Company is also having legal and sanitary dept.


This section looks after the welfare of the company employees as per service
rule framed by company management, which includes following:


      Salary wages:
    Salary includes basic pay plus dearness allowance and personal pay.
    In addition to salary HRA(house rent allowance) and other perks are
      calculated for all the officers and staff members from electronically
      recorded presence.


                                                                         29
 The entire accounting of salary and applicable income-tax is taken
   care by this department.
 All the above activities are carried out through HRM system which is
   directly connected with time office of the HR department.
 The data generated from HRM system is summarized and transformed
   to the SAP system.


   Payment Of LTC Medical Expenses, Loan & Other Special Perks
 LTC (Leave Travel Concession)
This benefit is given to each employee as per their dependent members
once in a year for travel of 4,000 Km. for this employee has to apply the
leave of at least 3 days.
 Medical benefit:
GNFC reimburses the medical expenditure incurred by the employee as
certified by the GNFC hospital management. This benefit is given only to
the dependent family members of the employee.
 Loan:
Various loan are sectioned by this department as per the recommendation
of HR department. Such as,
    Loan for construction of house.
   1. For purchase of vehicle.
   2. For purchase of consumer durable items like washing machine,
      frieze, fans, furniture etc.


                                                                      30
Fixed Deposit Section:


Fixed deposit is important source for short-term requirement. Amount
of F.D occupy big place in unsecured loan for GNFC. Due to increase
in profitability of company and good reputation in the market amount
of fixed deposit increased in last five years.


Following are the main activities of F.D section:


Accepting fresh deposits
    Payment on maturity
    Interest payment
    Renewal of F.D
    Correction
    Report to registrar of company
    Approval of B.O.D
    Promotional activities
    Monthly statement


                                                                 31
INSURANCE SECTION

Purpose is to cover financial losses from accidental events:


                            General                    For Non- Living
                           Insurance                   Things
INSURANCE
                              Life                     Fire
                           Insurance                   Insurance

                                                        More Than 75
                                                        Types

                                                        Marine
                                                        Insurance

                                                        Election All Risk
                                                        Project Insurance


                                                        Group Personal
                                                        Insurance


                                                                         32
 Imported decision which are taken by the insurance section are as
         follows;
             Sum assured,
             Risk coverage.


       Loss due to any accidental event will be estimated the government
         approval value‟s
       Surveyor‟s visit for document verification and technical
         consultation.


The following are the major activities which are under taken by the
insurance section;

    New insurance policy,
    Renewal of old policy,
    Putting claims against insurance company,
    Premium amount,
    Accounting policy.


                                                                        33
MARKETING ACCOUNT SECTION

Marketing account section covers followings:

   1. Cash collection from exported products
   2. Cash collection
   3. Collection of miscellaneous income.

In detail discussion is as follows,

   1. Cash collection of exported
       Company is also involved in activities of exports.
       Marketing account section is responsive to collect case of products.
       Marketing account section checks the terms and condition of letter
         of credit.
       If any terms and condition do not match with company‟s policy,
         they demand amendment in the letter of credit.

  2. Cash collection

       Company‟s products are divided into groups

Industrial product

      More contribution in total profit
      Free market price decision

Fertilizer

      Government regulated
      Subsidize products


                                                                          34
Major point considered is as follows:

        Debtor,
        Turnovers,
        Variances,
        Cash flow statement
        Reports preparing

3. Collection of miscellaneous income.

    Company receives miscellaneous income and following are the main
      sources of the income.
        Hospital fees and charges,
        Rent test shops (GNFC township)
        Soil test charges,
        Sell of scraper,
        Tender.
    Main activities per formed by marketing account section
            Preparation of sell summary,
            Preparation impressed ledgers,
            Preparation of bank book work sheet,
            Provide guidance for collection of debts.

CREDIT POLICY AT GNFC
    For urea only cash payment is followed and on credit is given.
    For Narmada can and phos period of 30 days or 45 days is allowed.
    Credit policy allowed in the sales of industrial products,
        Formic acid -----65days
        Methanol-----30days,
        Acetic acid-----45 days.
    Company gives discount on cash purchase and discount on quantity.
    Discount scheme is depending upon credit policy of company, market
      condition and other internal and external factors.
                                                                         35
WORKING CAPITAL

   MANAGEMENT

Working capital, also known as net working capital, is a financial metric
which represents operating liquidity available to a business. Along with
fixed assets such as plant and equipment, working capital is considered a
part of operating capital. It is calculated as current assets minus current
liabilities. If current assets are less than current liabilities, an entity has a
working capital deficiency, also called a working capital deficit.

A company can be endowed with assets and profitability but short of
liquidity if its assets cannot readily be converted into cash. Positive working
capital is required to ensure that a firm is able to continue its operations and
that it has sufficient funds to satisfy both maturing short-term debt and
upcoming operational expenses. The management of working capital
involves managing inventories, accounts receivable and payable and cash.


Concepts of working capital

There are two concepts of working capital-gross and net.

Gross working capital refers to the firm‟s investment in total current assets.

Net working capital refers to the difference between current assets and
current liabilities. Net working capital is positive when CA exceed CL and
negative when CL exceeds CA.

A finance manager should ensure there is sufficient liquidity in the firm‟s
operations. This is possible only when the CA and CL are managed

                                                                              36
efficiently. Liquidity of the firm is defined as the firm‟s ability to meet its
short-term obligations as and when payable.

OBJECTIVES

Liquidity V. Profitability

The basis objective of working capital management is to maintain the
smooth functioning of the normal business operations of a firm. The
company has to decide on the sufficient quantity of working capital to be
maintained. A company following a conservative approach will have more
current assets at its disposal. Holding large amount of CA is not very
advisable as the firms lose on the profitability aspect. They can earn more by
putting these resources to alternative uses or by investing CA into short term
investment avenues. This approach is dynamic wherein only small amounts
of cash are held by companies and the rest put to alternative uses.


Need for Working Capital

Different firms have different requirements of working capital. One of the
objectives, the firm should earn good returns from its operations which mean
that earning a steady amount of profit requires good amount of sales. The
firm should invest adequately in current assets to enable it to generate sales
continuously without any break. Sales do not convert into cash
instantaneously and there is always on operating cycle involved in the
conversion of sales into cash.


                                                                            37
OPERATING CYCLE

It is the length of time required to convert sales into cash. This involves
three phases:

    Acquisition of resources-procuring raw materials, labour, fuel, etc.
    Manufacture of the product-conversion of raw material into inventory.
    Sale of the product-conversion of sales into cash or credit in which
      case the firm has accounts receivable.
The length of the operating cycle is the sum total of:

    Raw Material storage period
    Conversion period
    Average collection period
This total is referred to as Gross Operating Cycle (GOC). Form this; the firm
has to make payables which are the Average Payment Period. Subtracting
payables deferrals from GOC, we get Net Operating Cycle or the Cash
Conversion Cycle.


                                                                            38
Calculation of Operating Cycle of GNFC

1) Inventory Conversion Period

The inventory conversion is the sum of raw material conversion period,
work in process and finished goods conversion period:

      ICP=RMCP + WIPCP + FGCP


      i)    Raw Material Conversion Period ( RMCP )


                 RMCP = Average raw material inventory
                          Raw material consumption per day
Raw material consumption per day = Raw material consumption / 360

Average raw material inventory = (Opening stock of RM + Closing stock of
RM)/2


                                                                     39
2007-08    2008-09          2009-10

Average raw material inventory   4041.71    5274.76          5522.39

Raw Material consumption per     214.71     292.01           341.99
day

Raw Material Conversion          19         18               16
Period (RMCP) (in days)


       ii)    Work in Process Conversion Period (WIPCP)

                 WIPCP = Average work in process inventory
                         Cost of production per day


Average work in process inventory = (Opening WIP + Closing WIP) / 2

Cost of production per day = (Raw material consumed + power, fuel and
other Utilities + stores chemicals + Opening WIP – Closing WIP) / 360


                                                                        40
2007-08        2008-09       2009-10

Average Work in Process      2422.75        1793.73       2013.60
Inventory


Cost of Production per day   367.30         377.15        433.86

Work in Process Conversion   7              5             5
Period (WIPCP) (in days)


      iii)   Finished Goods Conversion Period (FGCP)


                FGCP = Average Finished goods Inventory
                      Cost of goods sold per day


                                                                    41
2007-08      2008-09        2009-10

Average finished goods       4351.26      8795.65        11532.51
Inventory


Cost of goods sold per day   455.18       592.60         765.97

Finished goods conversion 10              15             15
Period (FGCP) (in days)


                                          2007-08   2008-09   2009-10

Raw Material Conversion Period (RMCP)     19        18        16
(in days)

Work in Process Conversion Period         7         5         5
(WIPCP) (in days)

Finished Goods Conversion Period (FGCP)   10        15        15
(in days)

Inventory Conversion Period (ICP) (in     36        38        36
days)


                                                                        42
Inventory Conversion Period

   40                                                38
                          36                                                    36
   35
   30
   25
          19                        18
   20                                                            16
                                               15                          15
   15
                    10
   10          7
                                          5                            5
    5
    0
               2005-06                   2006-07                      2007-08

                   Raw Material Conversion Period (RMCP) (in days)
                   Work in Process Conversion Period (WIPCP) (in days)
                   Finished Goods Conversion Period (FGCP) (in days)
                   Inventory Conversion Period (ICP) (in days)


From the above calculation we can see that since last 3 years the ICP is
nearer to 37days. For maintaining operating cycle successfully this
conversion period of inventory is fair for GNFC.


                                                                                     43
2) Debtors conversion Period (DCP)

Debtors conversion period =             Debtors * 360
                                        Credit Sales

                             2007-08            2008-09             2009-10

Debtors                      36117.55           51742.25            50126

Credit Sales per day         596.55             649.82              953.86

Debtors Conversion     60                       80                  53
Period (DCP) (in days)


                                Debtors Conversion Period

                                               80
   80

   70
                       60
   60
                                                                        53
   50

   40

   30

   20

   10

    0
               2005-06                     2006-07              2007-08

                            Debitor conversion period (DCP) (in days)


                                                                              44
The debtors‟ conversion period represents the length of time required to
collect the sales receipts. It can be called process of cash inflow. From the
above calculation the conversion periods are fluctuating. It was highest in
2006-07 i.e. 80days which affects adversely to the firm. In 2007-08 it
decreases from 80days to 53 days which is fair for GNFC.


3. Gross Operating Cycle (GOC)
Gross operating cycle = Inventory conversion period + Debtors Conversion
Period
                                  2005-06      2006-07         2007-08

Inventory Conversion Period (In 36             38              36
days)

Debtors Conversion Period (In 60               80              53
days)

Gross Operating cycle (In days)   96           118             96


                                                                          45
Gross Operating Cycle

  120                                      118


  100            96                                           96


   80


   60


   40


   20


    0
               2005-06                   2006-07            2007-08

                         Gross Operating Cycle (in days)


From the above calculation we can say that gross operating cycle is highest
in 2006-07 i.e. 118 days because of high collection period. In 2007-08 it is
decreased to 89 days because of low collection period. The time taken in
completing one round from cash outflow to cash inflow takes nearly 90
days.


                                                                         46
4. Payable Deferred Payment (PDP)


   PDP =     Average Creditors * 360
                Credit Purchase

Credit purchase = raw material consumed + power fuel and other utilities +
stores and chemicals + packing material + purchase of good for sale +
closing stock of raw material + closing stork of stores and spares – (opening
stock of raw material + opening stock of stores and spares)


                                             2005-06     2006-07     2007-08

Average Creditors                           21275.35 21045.27 34782.22

Credit Purchase Per Day                     410.39       551.51      678.89

Payable Deferred Payment (PDP) (In          52           38          51
Days)


                                                                          47
60
                   52                                                  51
   50

   40                                         38


   30

   20

   10

    0
                2005-06                    2006-07                   2007-08

                          Payabel Deferred Payment (PDP) (In days)


Payable deferred payment is the time that lapse between the dates of various
resources received on credit and the date when payment is made. In the last
3 days it is highest in 2005-06 i.e. 52days. An increase in the length of the
operating cycle, without a corresponding increase in payable deferred
period, creates the further working capital financing needs. The days are
lowest in 2006-07 i.e. 38days.


                                                                               48
5. net operating cycle (NOC)
Net operating cycle = gross operating cycle + payable deferred period


                                          2005-06        2006-07      2007-08
Gross operating cycle (GOC)               96             118          89
(in days)
Payable deferred payment (PDP)            52             38           51
(in days)
Net operating cycle (NOC)                 44             80           38
(in days)


       80                                    80

       70

       60

       50
                    44
       40                                                            38

       30

       20

       10

        0
                  2005-06                 2006-07                  2007-08

                            Net Operating Cycle (NOC) (In days)


      The difference between gross operating cycle and payable deferred
      period is known as net operating cycle. The operating cycle is 44 days
      in 2005-06 which goes up in 2006-07 i.e. 80days. An increase in the

                                                                             49
length of operating cycle creates further working capital financing
needs. In 2007-08 the cycle days are reduced to a noticeable level.
The change in 2006-07 is because of higher collection period and
lower payable deferred period.


6. Current Asset to Fixed Asset Ratio:
Higher of current asset to fixed asset is useful to measure a level of
current asset. The three policies are follows:
 Higher CA / FA ratio indicates conservative current asset policy.
    It implies greater liquidity and lower risk.
 Lower CA/FA ratio indicates aggressive current asset policy. It
    implies higher risk and poor liquidity.
 Between these two extreme levels, there is an average current
    asset policy.

                                  2005-06        2006-07     2007-08

       Current Asset             88426.02        141029.06   120397.18

        Fixed Asset              85109.61        110632.68   107022.88

     CA / FA (Times)                1.04           1.27        1.12


                                                                         50
1.4
                                      1.27

            1.2                                     1.12
                      1.04
             1

            0.8

            0.6

            0.4

            0.2

             0
                    2005-06         2006-07       2007-08

                              CA / FA (Times)


From the above data we can say that GNFC is following average policy. In
2005-06 current asset was slightly greater than fixed asset and 2007-08 it
follows greater difference. The ratio is highest in 2006-07 i.e. 1.27 which
indicates conservative current asset policy. It shows greater liquidity and
lower risk of the company.


                                                                        51
Determinants of working capital

A firm should plan its operations in such a way that there is neither too much
nor too little working capital. The following factors are indentified as
significant factors affecting the composition of working capital or current
assets:

    Nature of business: working capital requirements are basically
      influenced by the nature of business. Trading organizations invest
      little on fixed asset and are have a large stock of finished goods,
      accounts receivable (arising out of credit sales) and accounts payables
      (due to credit purchases). In contrast, public utilizes do not have large
      stocks of current asset and they invest heavily on fixed assets.
    Nature of Raw Material Used: the nature of raw material also
      influences the quantum of inventory. For example, if the raw material
      is based on the agricultural produce, the seasonality of production
      affects the raw material requirements. Consequently, the percentage of
      raw material inventory to total current asset will be very high.
    Sales and Demand Conditions/ Business Cycle: companies which are
      growing will have large quantities of finished goods inventory. Sales
      depend on the demand conditions which vary depending on the
      seasonality and cyclicality of product demand.
    Processing Technology: the manufacturing cycle comprises the
      purchase and use of raw material and production of finished goods.
      Longer the manufacturing cycle, larger is the firm‟s requirement of
      working capital. This will also lead to an extended manufacturing
      time span and larger tie-up of funds in inventory.


                                                                            52
 Credit Policy: the credit policy of the firm affects the working capital.
       The credit terms to be granted to customers depend on the industry
       norms. If the industry standard is 45 days and the firm restricts its
       credit terms to 20 days, it works heavily on the company‟s sales. On
       the other hand, if the company follows the industry standard and
       grants credit of 45 days, extra efforts are to be put in towards
       collection. Incidence of bad debts is higher in such cases.
    Operation Efficiency: use of working capital is improved and the
       velocity of cash conversion cycle is stepped up. Better utilization of
       resources improves profitability and helps in reducing the pressure on
       working capital.


Decision Criteria


Working capital management entails short term decisions – generally,
relating to the next one year period which is “reversible”. These decisions
are therefore not taken on the same basis as capital investment decisions
(NPV or related, as above) rather they will be based on cash flows and / or
profitability.


One measure of cash flow is provided by the cash conversion cycle the net
number of days from the outlay of cash for raw material to receiving
payment from the customer. As a management tool, this metric makes
explicit the inter- relatedness of decisions relating to inventories, account
receivable and payable, and cash. Because this number effectively
corresponds to the time that firm‟s cash is tied up in operations and

                                                                           53
unavailable for other activities, management generally aims at a low net
count.


In this context, the most useful measure of profitability is return on capital
(ROC). The result is shown as a percentage, determined by dividing relevant
income for the 12 months by capital employed; return on equity (ROE)
shows this result for the firm‟s shareholders. Firm value is enhanced when,
and if the return on capital, which results from working capital management,
exceeds the cost of capital, which results from capital investment decisions
as above. ROC measures are therefore useful as a management tool, in that
they link short-term policy with long-term decision making. See economic
value added (EVA).


Management of working capital
Management uses a combination of policies and techniques for the
management of working capital. These policies aim at managing the current
asset (generally cash and cash equivalents, inventories and debtors) and the
short term financing, such that cash flows and returns are acceptable.


    Cash management: identify the cash balance which allows for the
         business to meet day to day expenses, but reduces cash holding costs.
    Inventory management: indentify the level of inventory which allows
         for uninterrupted production but reduces the investment in raw
         materials and minimizes reordering costs and hence increases cash
         flow; i.e. credit terms which will attract customers, such that any


                                                                            54
revenue and hence return on capital (or vice versa) discounts and
      allowances.
    Short term financing: identify the appropriate source of financing,
      given the cash conversion cycle: the inventory is ideally financed by
      credit granted by the supplier; however, it may be necessary to utilize
      a bank loan (or overdraft), or to “convert debtors to cash” through
      “factoring”.


Calculation of gross working capital:
Gross working capital refers to the current assets of the firm. Current assets
are the assets which can be converted into cash within a year and it includes
cash, short term securities, debtors, bills receivables etc.


                                                          (Rs. In Lacs)

Sources of funds
                                     2005-06       2006-07      2007-08
Current assets
Inventories                          26957.87     38848.52     38599.79

Sundry debtors                      42957.30     60527.55      38968.35
Cash and bank balance               5501.95      13047.91      15141.34
Interest accrued                    141.48       141.48        447.65
Loan and advances                   12867.42     28465.60      27240.05
Gross working capital               88426.02     141029.06 120397.18


                                                                           55
160000
                                       141029.06
  140000
                                                             120397.18
  120000

  100000
                  88426.02

   80000

   60000

   40000

   20000

        0
                 2005-06               2006-07               2007-08

                             Gross Working Cpital

From the above last 3 days data we can see that gross working capital is
highest in 2006-07. Inadequate amount of working capital can threaten. The
solvency of the firm because of its inability to meets its current obligation.
Here we can see the major proportion of current asset investment is done
into account receivable and investment in current asset should be judge
adequately account to the need of business firm. Excessive investment in
current assets should be avoided because it affects the firm‟s profitability, as
idle firm investment earns nothing.


                                                                             56
Calculation of Net Working Capital of GNFC Ltd.


Net working capital is a difference between current assets and current
liabilities.

Net working capital= current asset – current liabilities


Sources of funds                     2005-06        2006-07          2007-08
Current asset
Inventories                             26957.87      38848.52         38599.79
Sundry debtors                          42957.30      60527.55         38968.35
Cash and bank balance                    5501.95      13047.91         15141.34
Interest accrued                          141.48            141.48       447.65
Loan and advances                       12867.42      28465.60         27240.05
(A) Total Current Assets                88426.02     141029.06        120397.18
Current liabilities
Liabilities                             26444.51      44245.09         35272.92
Provisions                              10902.56           9723.65     13594.99
(B) Total Current Liabilities           37347.07      53968.74         48867.19
Net Working Capital (A-B)               51078.95      87060.32         71529.99


                                                                               57
90000                              87060.32

   80000
                                                          71529.99
   70000

   60000
                 51078.95
   50000

   40000

   30000

   20000

   10000

       0
                 2005-06              2006-07             2007-08

                            Net Working Capital (A-B)


Net working capital can be positive or negative. For GNFC it is highest in
2006-07 i.e. 87060.32 which decrease in 2007-08 by 71529.99. so it is
positive. Excessive investment in current assets should be avoided because it
affects the firm‟s profitability.


                                                                          58
Cash Management

Cash is the most important current asset for a business operation. It is the
force that drives business activities and also the ultimate output expected by
the owners. The firm should keep sufficient cash at all time. Excessive cash
will not contribute to the firm‟s profits and shortage of cash will disrupt its
manufacturing operation. The term „cash‟ can be used in tow senses in a
narrow sense it means the current and other cash equivalents such as
cheques, drafts and demand deposits in banks. In a broader sense, it includes
near cash asset like marketable securities and time deposits in banks. The
distinguishing nature of this kind of asset is that they can be converted into
cash very quickly. Cash in its own form is an idle asset. Unless employed in
some form or another, it does not earn any revenue. Cash management is
concerned with

    Management of cash flows into and out of the firm,
    Cash management within the firm and
    Management of cash balances held by the firm deficit financing or
      investing surplus cash.


Motives of holding cash

There are four motives of holding cash. They are:

    Transaction motive: This refers to a firm holding cash to meet its
       routine expenses which are incurred in the ordinary course of
       business. A firm will need finances to meet a plethora of payment


                                                                            59
like wages, salaries, rent, selling expenses, taxes, interests, etc. The
   necessity to hold cash will not


   arise if there were a perfect coordination between the inflows and
   outflows. These two never coincide.
 Precautionary motive: This refers to the need to hold cash to meet
   some exigencies which cannot be foreseen. Such unexpected need
   may arise due sudden slow-down in collection of accounts receivable,
   cancellation of etc. the moneys held to meet such unforeseen
   fluctuations in cash flows are called precautionary balances.
 Speculative motive: This relates to holding cash to take advantage of
   unexpected changes in business scenario which are not normal in the
   usual course of firm‟s dealings. It may also result in investing in
   profit- backed opportunities as the firm comes across.
 Compensating motive: this is yet another motive to hold cash to
   compensate bank for providing certain services and loans. Banks
   provide variety of services like cheque collection, transfer of funds
   through DD, MT, etc. To avail these purposes, the customers need to
   maintain minimum balance in their account at all times. The balance
   so maintained cannot be utilized for other purpose. Such balances are
   called compensating balances.


                                                                        60
Objectives:

 Meeting payments schedule and


 Minimize funds committed to cash balance.


    Meeting payments schedule:

In the normal course of functioning, a firm will have to make many
payments by cash to its employees, suppliers, infrastructure bills, etc. it
will also receive cash through sales of its products and collection of
receivables. Both these do not happen simultaneously. A basic objective
of cash management is therefore to meet the payment schedule in time.
Trade credit refers to the credit extended by the supplier of goods and
services in the normal course of business transactions.

    Minimize funds committed to cash balances:

Trying to achieve the second objective is very difficult. A high level of
cash balances will help the firm to meet its first objective discussed
above, but keeping excess reserves is also not desirable as funds in its
original form is idle cash and a non earning asset. The aim of cash
management is therefore to have an optimal level of cash by bringing
about a proper synchronization inflows and check the spells of cash
deficits and cash surpluses.


                                                                        61
Factors for efficient cash management:

The efficiency of cash management can be augmented by controlling a
important factors described below:

    Prompt billing and mailing: There is a time lag between the
      dispatch of goods and preparation of invoice. Reduction of this gap
      will bring in early remittances.
    Collection of cheques and remittances of cash: It is generally
      found that there is a delay in the receipt of cheques and their
      deposits into banks. The delay can be reduced by speeding up the
      process of collection and depositing cash or other instrument from
      customers. The concept of „float‟ helps firms to a certain extent in
      cash management. Float arises because o the practice of banks not
      crediting firm‟s account in its books when a cheque is deposited by
      it and not debit firm‟s account in its books when cheque is issued
      by it until the cheques is cleared and cash is realized or paid
      respectively. Whenever cheques are deposited with the bank, credit
      balance increases in the firm‟s books but not in bank‟s books until
      the cheque is cleared and money realized. This refers to „collection
      float‟. Likewise the firm may take benefit of „payment float‟. The
      difference between payment float and collection float is called as
      „net float‟. When net float is positive, the balance in the firm‟s
      books is less than the bank‟s book‟s when net float is negative; the
      firm‟s book balance is higher than in the bank‟s books.


                                                                       62
Cash forecasting and budgeting

  Cash budget is a device to plan for and control cash receipts and
  payments. It gives a summary of cash flows over a period of time.
  Cash budgets are prepared under three methods:

1. Receipts and payments method
2. Income and expenditure method
3. Balance sheet method


  Cash management at GNFC
  GNFC uses short period cash budget method. It prepare cash budget
  on quarterly basis. They make budget every month for the next three
  months. Cash budget is prepared by inflow and outflow as well as
  receipt and disbursement.


                                                                  63
Cash budget format:

    Details of cash flow: Actual for Dec-2007 v/s projection for the period
                     Jan 2008 to March 2008 (Rs. In lacks)
                                       Actual                Projections

                                                              Feb          March
                                Dec        Year to   Jan
                                2007       date      2008     2008         2008
A. Opening Balance

B. Receipts

Sub Total

C. Payment

Sub Total

D. Net Cash Inflow (B-C)

E. Closing Balance (A+D)

F. Total Cash Credit Limit


Cash collections
GNFC is selling its all product on cash as well as credit basis. It is own
cash management system with BANK OF BRODA and ICICI. GNFC
has non operative sales collection amount at each of its sales office for
cash collection where only cheques are deposited by the customer, cash
not be withdrawn. The fund is transferred at BOB (bharuch) to the GNFC
cash credit account.


                                                                                   64
Cash disbursement

Company has deal with certain fixed expenses every month i.e. salaries,
telephone payments, electricity charges, dealer payments etc. supplier
payments are done by cheque, inter bank credit or imported account.

Almost all transactions at GNFC are done by cheques on cash
transaction. Minor expenses are done on cash basis. So at GNFC there is
nothing like optimum cash balance.

Surplus cash investment

Company receives cash from selling its products. If there is surplus cash
after all cash disbursement GNFC invest that surplus fund as fixed
deposit for very short time period. On the contrary if company is in
deficit then bank gives cash credit facility. The interest rate is now
9.25%. it is a consortium rate of all banks. The rate is counted as PLR
3.5% second source is short term t inter corporate loan from GSFC for 90
days and HDFC for 120 days.


                                                                      65
Inventory Management
The team „inventory‟ refers to the stockpile of products. Inventory comprises

of those assets which will be sold off in the near future and moneys

recovered. Inventory consists of three types of assets – raw materials, semi –

finished goods (work in progress) and finished goods. Raw material

inventory consists of those items which are purchased by the firm to be

converted into finished goods. Work in progress inventory consists of

partially complete goods, that is, items currently being used in the

production process. Finished goods stock represent completed products

ready to be sold.


The chief responsibility of a finance Manager of a firm is to see to it that the

actions of the firm ultimately lead to wealth maximization of shareholders.

Also he should ensure availability of sufficient raw materials for smooth

production and sufficient finished goods stock to satisfy sales demands.

These two conflicting is a basis of trade-off between costs and benefits

associated with the inventory levels.


                                                                             66
Role of Inventory in Working Capital


Inventories form an important part of a firm‟s working capital. Some
characteristic features about inventory are as follows:

   1. Current asset: Inventories will be converted to cash within a year.
   2. Level of liquidity: Inventories are looked at as next to cash. A firm
      having fast-moving goods in its stock can convert the products
      quickly to cash. Such stocks are called as highly liquid stocks.


   3. Liquidity lags: Inventories have three types of legs:
         a. Creation lag: Raw materials are purchased on credit (creation of
             accounts payable) and used to produce finished goods. There is
             always a lag        in payment whether goods are purchased or
             manufactured. This liquidity lag offers a benefit to the firm.
         b. Storage lag: The goods held for sale cannot be converted into
             cash immediately. Whether the goods are fast-moving, the firm
             realize its cash after a certain period.
         c. Sale lag: Instant cash realized when goods are sold on cash
             basis but in competitive situations, firms should give some
             credit period to their customers to enhance their sales volumes.
             This results in accounts in accounts receivable and this lag is a
             cost to the firm.


                                                                              67
Purpose
The goal of inventory holding is to efficiency through cost reduction and to
increase sales volume. The following are the other benefits accruing from
holding inventories:


    Sales: Customers purchase goods only when need arises. On the other
      hand. Firms the goods they want are not available most of them look
      at other substitutes.
    Avail quantity discounts: suppliers give discounts for purchases. Such
      discounts increase the firm‟s profits. Firms may go in for large orders
      to benefit from discounts offered by dealers.
    Reducing ordering costs and time: every time a firm places an order, it
      incurs certain administrative expenses and some time is lost in
      processing these forms to get necessary approvals. Each of these
      varies with the number of order placed. To save on and costs, the
      firms may think about placing big orders
    Reduce risk of production shortages: manufacturing firms require a
      whole lot of raw materials and spares. Even if one item is missing or
      is not available immediately, the entire production process goes for a
      toss and the firm incurs heavy losses. To avoid such situation firms
      maintain the required stores and inventories in sufficient quantities.


                                                                               68
Cost associated with inventories

Successful inventory management is a trade of between high and low levels
of inventory. The inventory cost can classify as under.

Material costs: these are the costs of purchasing the goods and the related
cost such as transportation and handling costs associated with it.

Ordering costs: the expenses incurred to place orders with suppliers and
replenish inventory of raw materials are known as „ordering cost‟. Ordering
costs include requisitioning. Purchase ordering, transporting, receiving,
inspecting and handling at the warehouse.

Carrying costs: carrying cost include storage, insurance, taxes, deterioration,
spoilage, obsolescence, salaries o in storage. The greater the inventory, the
greater is the carrying cost.

Cost of funds tied up in inventory: whenever a firm commits its resources to
inventory, it is using funds that otherwise might have been available for
other activities. The firm is losing on the opportunity cost. If the finds were
not locked up in inventory, they would have earned a return.

Cost o running out of goods: these are the costs associated with the inability
to provide materials to the production department when they ask for or not
providing finished goods to the marketing department when demand is there
warehouse keeper, maintenance of building etc. carrying cost generally are
to the tune of 25% of the value of inventory.


                                                                            69
INVENTORY MANAGEMENT AT GNFC

At GNFC there are total 140000 items in inventory whose total value is
Rs.1001000000.

Bifurcation of inventories:

Mechanical spares                      57%
Catalyst and chemical spares           12%
Electrical items                       11%
Instrumentation items                  10%
Other miscellaneous item               10%


                                 10%
                      10%

              11%
                                                         57%
                    12%


          Mechanical spares            Catalyst and chemical spares

          Electrical items             Instrumentation items

          Other miscellaneous item


In 57% mechanical spares, there are some item which are not come into
daily use. These item are very costly and carrying cost is also high.

Material planning control system is available for the management of
inventory at GNFC.
                                                                      70
This system is useful to control the minimum maximum level of inventory.
Some inventories costs are very less and required time to time in the
production.


GNFC use SAP system for maintaining the inventory as well as the dead
stock. SAP system is very useful and effective. The important benefit is the
is helps in reducing the work load.

Sales to inventory turnover ratio (2007-08) = sales/ inventory

                                            =343391.21/ 38599.79

                                           =8.89 times

 The sales to inventory turnover ratio is 8.89 tines, which shows good
management of inventory.


Inventory management techniques

Many mathematical models are available to handle inventory management
problems.


Some of the techniques are as follows:

   1.   Codification System
   2.   ABC System
   3.   Economic Oder Quantity ( EOQ)
   4.   FSN Analysis
   5.   HML Analysis


                                                                         71
1. Codification system

Codification refers to assigning a unique code or name to each item based on
its use, characteristics, importance and other features. It is the process of
allocating a code after logical grouping and sub groping considering material
types and application.

Advantages:

      It helps in avoiding duplication of items.
      It is the starting point for standardization.
      It identifies all the items logically.
      It helps to group the similar items together.
      It lays the foundation for an efficient purchase organization by helping
       to form specialized commodity base purchase sections. Since items
       are identified by sources of supply, it is possible to bulk together to
       take advantage of bulk discount.


2. ABCsystem
Monitoring a large number and types of inventory becomes very difficult in
a big company given the amount involved. In such cases, ABC analysis
enable the management to monitor the stocks in a proper manner. The firm
therefore classifies inventories into three different categories – A group –
items with high attention. Rigorous, sophisticated and intensive control
measures are used for such item monitoring. Items under the C group
represent least value items needing simple control large. The B group stands
midway. They are neither too expensive nor very cheap. These items require
reasonable attention. The ABC analysis concentrates on important items and
is therefore known as “Control by Importance and Exception”. It is also
known as Proportion Value Analysis as items are classified according to the
importance of their value.

                                                                            72
Advantages of ABC analysis:

   It ensures closer control on costly items in which lies the greater part of
   company‟s resources. Clerical costs are greatly reduced as stocks are
   maintained at optimum level. It helps in achieving the main objective of
   inventory control at minimum cost.


   3. Economic Order Quantity (EOQ)

   EOQ refers to the optimal order size that will result in the lowest ordering
   and carrying costs for an item of inventory based on its expected usage. The
   optimum level of inventory is referred to as the Economic Order Quantity. It
   is the economic lot size. EOQ is defined as level of inventory order that total
   cost associated with the inventory management. It is the level one unit
   beyond which is additional cost to the firm and one unit below may hamper
   production process. The model in inventory control.


 Constant or uniform demand: The firm knows with certainty the annual
  consumption of a particular item of inventory.
 Constant unit price: The EOQ model is based on the assumption that the per
  unit piece of material does not change and is constant irrespective of the
  order size.
 Constant carrying costs: Unit carrying costs are known to vary substantially
  as the size of inventory increases or decreases. Firms derive economies of
  scale by increasing order size. However, the EOQ model assumes the
  carrying costs to be constant.
 Constant ordering costs: Ordering costs are assumed to be constant
  whatever the numbers of orders are and whatever the size is.


                                                                               73
Economic Order Quantity:

Optimum Production Quantity

  2AS/C

The formula for EOQ model is

Where A refers to the annual usage,

       S refers to ordering cost,

       C refers to cost of carrying inventory per unit per annum.


Re-order Point

In the EOQ model, it was assumed that there is no time lag between ordering
and procuring of materials. Therefore the re-order point for replenishing the
stocks occurs at that level when the inventory level drops to zero and
because of instant delivery by suppliers, the stock levels bounce back. But
rarely do we come across such situations in real life. There is always a lead
time between ordinary data and receipt of materials.

Due to this, the recorder level is always higher zero.

Re-order point = Normal Consumption during lead time + Safety stock

Recorder level = Average usage *Lead time


                                                                          74
Safety stock

In order to avoid a stock-out situation, the firms should maintain a safety
stock which will act as a buffer or a cushion against a possible shortage of
inventory. Safety stock may be defined as the minimum additional inventory
to meet an unanticipated increase in usage resulting from an unusual high
demand


4. FSN Analysis
At GNFC FSN analysis is carried out for consumable items, which are used
by multiuser. FSN means fast moving, slow moving and non moving items
analysis.


Norms established by GNFC for different items

Fast moving items

    It should have more than 5 issue transaction in a year.
    There should be multi users.

   For fast moving items close watch is required and annual rate contracts
   are made to avoid stock outs. Here frequency of review is more.


Slow moving items

    Items should have transactions between 1 to 5 items in a year.
    There should be multi users.

   For slow moving items consumption pattern is studied. Normally these
   items are for specific users and levels can be kept low but users should
   given their requirement or shutdown. Here frequency of review is less.


                                                                         75
Non moving items

    Items have no issue transactions for last 3 years.
    Items should have some quantity available in all the past 3 years.

For non moving items reports are made at the closing of the financially year.
The report is circulated to all concerned department. The departments study
the use of equivalent materials against other similar material. After that the
excess material is declared for disposal and that items are removed from the
list.


5. HML Analysis

HML analysis refers to high value, Medium value and low value items. In
this analysis the unit value of the items is considered. Here the analysis is
mainly focus to control the unit prices of high value items and negotiate the
prices. This analysis is done for electrical, instrumentation and other items.


At GNFC

      Items having value more than or equal to 100000Rs. Is called high
      value items.
      Items having value more than or equal to 25000Rs. and below
      100000Rs. is called medium value items.
      Items having value less than25000Rs. is called low value items.


                                                                           76
Zero inventories

GNFC is maintaining the zero inventories for raw material like oil, gas etc.
Zero inventories takes place when the company has made contract with
suppliers to provide row material on demand.

GNFC has contract with GAIL for providing gas as and when required. The
supply of gas on demand help to save inventory and cost reduction also.

For lubricants GNFC has done negotiation with IOC (Indian Oil
Corporation). It has provided accommodation in the plant which is called
IOC depot. IOC keeps the stock at the depot and GNFC use it when it is
required. Till that GNFC does not need to pay anything for it. GNFC has to
look after the material of depot. IOC pays charges for that to the company.
This helps to reduce the transaction cost.

Import substitution

Import substitution refers to find out the domestic suppliers for the item
which are imported. GNFC has done the same for the item which are
imported. It has developed supplier connection in domestic market and
market contracts with them.

GNFC has positive experience by contracting with local vendors. It has
obtained lots of saving and benefits by adopting import substitution
technique.


Pricing of inventories
There are different ways of valuing inventories. Firms should choose that
system which gives them the maximum benefit.

Fist In Fist Out (FIFO): a firm adopting this method prices the raw material
at that rate at which the material were received. The goods received first are
issued first and once the first set of consignment is completely exhausted,
the second set is not utilized. This is logical method of issues which is used
by almost all companies.

                                                                           77
Last in first out (FIFO): in the LIFO method, the consignment last received
is first issued and if this is not sufficient, only then the previous set in the
warehouse is utilized. This system is useful when the companies want to
price their product on the basis of total cost incurred plus a percentage of
profit.

Weighted average method: the pricing of materials is done on weighted
average method where in weights are assigned to the quantities held and
accordingly priced. This is one of the most widely used methods as it gives
importance to the balances in stores in their proportion of availability.

Standard price method: under this method, the material is priced at a
standard cost which is predetermined. When the material is purchased, the
stock account will be debited with the standard price. The difference
between the purchase price and the standard price will be carried to a
variance account.

Replacement or current price method: this method prices the issues at the
value that is realizable at the time of issue.


                                                                             78
Receivable Management
Businesses sell goods on credit to increase the volume of sale. In the present
era of intense competition, one way to improve sale deals is to offer relaxed
payment conditions to customers. Finished goods get converted to
receivables when sold on credit terms. Trade credit is a marketing tool that
tries to bridge the gap between production and distribution of company‟s
products. Trade credit creates receivables or book debts which the firm
hopes to realize in the near future. The receivables are a very important
component assets.

Objectives
The term „receivables‟ is defined as „debt owed to the firm by customers
arising from the sale of goods or services in the ordinary course of business‟.
The main objective of having receivables in the current assets is to promote
and encourage sales which will lead to increased profits. In competitive
situations, the firms will be forced to offer goods on credit keeping in line
with competitor‟s strategies. All firms therefore grant credit to increase
sales, profits and to meet competition.


Costs Associated with Maintaining Receivables

The following are the different costs incurred with the extension of credit
and accounts receivable:
 Capital cost: A firm offering goods on credit can surely expect higher
   sales but some of the firm‟s resources remain blocked in them as there is
   a time lag between a credit sale and cash receipt from customers. The


                                                                            79
cost of use of additional capital to maintain its obligations will definitely
   have an effect on the firm‟s profits.


 Collection cost: These are the costs incurred in collecting receivables.
   They are administrative in nature and these costs include(a)additional
   expenses on the creation and maintenance of staff, stationery, postage,
   registers etc.


 Delinquency cost: This cost arises out of the failure of customers to meet
   their obligations when payment on credit sales becomes due after the
   expiry of credit period. Additional costs in the form of reminders, legal
   charges etc. will be incurred.


 Default cost: The firm may not be able to recover its dues because of its
   customers‟ inability to pay off their debts. Such dues are bad debts and
   go on to reduce the profits of the company. The size of the receivables is
   determined by the firm‟s credit policy and the level of its sales.


                                                                             80
Receivables management at GNFC
At GNFC the receivables are approx. 35% of current assets. The company
credit policy varies from 15 days to 90 days. On every 30 days company
prepares the receivables list which shows the total receivables and due date
for each bill. The list is prepared by accounting department. Account
department co ordinates with marketing department for collection of
receivables.
Credit policy
The credit policy of a company can be regarded as a tradeoff between
increased credit sales leading to higher profits and the cost of having large
cash locked up in receivables. The credit policy to be adopted in businesses
largely depends upon competitors‟ strategies. If the competitors are grating a
15 day credit period and if the firm decides to extend the credit period
to30days, the firm will be flooded with customers‟ demand for company‟s
products. Firms average investment in account receivable 90days credit per
month.
The credit policy is a framework to determine
   (a) Credit standards,
   (b) Period of credit,
   (c) Cash discount to be offered and
   (d) Collection program.


   All these variables listed influence the amount of sales, the amount of
sales, and the amounts locked up in receivables and the bad debts incidence.


                                                                           81
Credit Standards

The term „credit standard‟ represents the criteria for extending credit to
customers. The quantitative basis for setting credit standards are credit
rating, references, average payment period and ratio analysis. Professional
credit rating agencies‟ help may be sought to rate a customer‟s
creditworthiness. After rating, the customers are rated as „excellent‟, „very
good‟, „good‟,‟ average‟, „poor‟ , etc. The overall credit standards can be
divided into (a) tight or restrictive and (b) liberal or easy-going.


Credit period

This refers to the time given to customers to pay for their purchase. It is
generally expressed in days like 15 days or 30 days. Generally, firms give a
discount if payments are made within a said period beyond which they will
not lose on the benefit that can be availed. Increasing the credit period will
bring in new sales and new customers decrease, which is not desirable.


Cash Discounts

Firms offer cash discount to induce prompt payment s. Cash discounts has
implications on sales volume, average collection period, investment in
receivables, incidence of bad debt losses and profits. Change in discount rate
will bring in additional sales-granting a discount implies reduced pieces and
this factor brings in new sales.
GNFC is providing 14% discount on the total amount to the clients‟ if they
pay before due date.


                                                                           82
Collection Program

The success of a collection program will be depended on the collection
policy. The objective of a collection policy is to achieve timely collection of
receivables, thereby releasing funds locked up in receivables and minimize
bad debts occurrence. The collection program consists of the following:
     Monitoring receivables
     Informing customers about the due date for payment
     Initiating legal action to overdue customers after sending repeated
       notices
Collection policy should be so formulated that it is not too rigorous as it acts
as an irritant to customers, leading to bad relationship with them.

Credit policy at GNFC

    The company sales its product on both cash and credit basis.
    Daily reporting of sales is done for organizations.
    The Company follows a rigorous system of credit evaluation for both
      corporate client and dealers. The customers are required to make
      payments through cheques.
    ICRA rating is the standard for selecting and granting credit to
      customer
    Clients are required to give pre signed cheques to the GNFC for
      purchasing the product.
    Company has non operative sales collection account at each sales
      office for cash collection.
    If clients pay before due date then interest is charged @ 16% per year
      on total amount.

                                                                             83
 If clients pay before due date then 14% discount is given on the total
      amount.
    If the cheque bounces from the account then 0.75% of total amount or
      5000 Rs. whichever is higher is charged to customer.
    Prorate of quantity: if GNFC doesn‟t have quantity if product then it is
      entitled to follow all the conditions.


Credit evaluation of client is done for the purpose of extending credit to
them. GNFC has presently implemented credit rating model developed by
ICRA rating agency for assessing the clients‟ credit worthiness. They want
to change the credit rating agency from ICRA to CARE.


In GNFC different monitoring technique of account receivable are used. It is
to collection period and monitoring the top 10 customers of GNFC.


                                                                          84
FINDINGS
 The value of gross working capital is highest in 2006-07 i.e. 141029.06
   Major proportion of investment is done into account receivables and
   inventories.

 The value of net working capital is increasing and highest in 2006-07 i.e.
   87060.32 which indicates good liquidity position of GNFC.

 The inventory conversion period is on an average 37days during last 3
   years. It means average 37days time is required for producing and selling
   the product.

 Debtors‟ conversion period is highest in 2006-07 i.e.80days which goes
   down in 2007-08 i.e. 53days. Lower collection period is good for the
   company.

 Gross operating cycle is highest in 2006-07 i.e. 118 days due to high
   inventory conversation period and debtor‟s conversation period.

 Payable deferred payment is 2006-07 i.e. 38 days. It is 51 days in 2007-
   08.

 The net operating cycle is higher in 2006-07 due to higher collection
   period and lower payable deferred period.

 Current assets to fixed assets ratio is higher in 2006-07 i.e. 1.27 GNFC is
   following average policy in which there is an equal level of risk and
   liquidity.


                                                                          85
CONCLUSION

From the above calculation and information we can say that GNFC is
managing its working capital very effectively. All three components of
working capital i.e. cash management are operating very successfully at the
company. Major transactions are done through cheque. Company has sound
liquidity position. Its investing the major portion of surplus fund in FD only.
The company has good inventory management. It is maintaining zero
inventories. GNFC uses different techniques for monitoring receivables
management. In short the all over working capital management of GNFC is
proper.


                                                                            86

Working capital management mitesh maharaj

  • 1.
    A REPORT ON STUDY OF WORKING CAPITAL MANAGEMENT AT GUJARAT NARMADA VALLEY FERTILIZER COMPANY LTD BHARUCH SUBMITTEDIN PARTIAL FULFILLMENT OF THE MASTER OF BUSINESS ADMINISTRATION ICFAI UNIVERSITY SUBMINITTED BY VIVEK.D. PATEL PROJECT GUIDE MR.A.K.TRIVEDI (GM-FINANCE) MR.D.R.PANCHAL (PS-FINANCE) OMEGAN SHOOL OF BUSINESS BARODA 2008-2010 1
  • 2.
    ACKNOWLEGMENT This summer trainingproject has been a wonderful learning. We are very thankful to have got this opportunity to work on a satisfying project on “STUDY OF WORKING CAPITAL MANAGEMENT OF GNFC.” We have gained in depth knowledge on this topic. Apart from this we have had a wonderful feel of the corporate environment and how an organization functions. We are very thankful to the management of GNFC for providing us the golden opportunity to do 8 week training. We would like to thank Mr.N.K.Patadia (AGM-TC) to grant us for training. We also express out thank to Mr.I.P.Bhatt (SM-TC). We are immensely grateful to Mr.A.K.Trivedi (GM-Finance) who has guided us during the project and our special thanks to Mr.D.R.Panchal (PS- Finance) who has guided us and helped us a lot throughout the training. We are also thankful to manager Mr. R.B.Kayastha (Banking Section) who has guided us for studying working capital management. We are also thankful to chief managers Mrs.J.M.Kavina, Mr.V.C.Bhatt, senior managers Mr.U.N.Gohil, Mr.P.H.Gadhi, Mr.U.V.Parmar, Mr.R.M.Patel, and managers Mr.A.B.shah, Mr.R.B.Shah, Mr.A.R.Shah, Mr.R.S.Patel, Mr.M.H.Dave, Mr.N.N.Modi, Mr.M.S, Talukdar, in charge of different section for making us aware about their particular section. Vivek Patel 2
  • 3.
    PREFACE There is an ancient proverb practice makes man perfect. It indicates practice makes the person more practical and provides training and knowledge through which we can handle related satiation. As a part of study I have to take training and collect in formation of com any and present as in the form of project report of the company to university. Here is given the project report of GNFC Bharuch .I visited for my practical study and it is great experienced. Fertilizers are and very good commodity and I try my level best to collect the information for the same. 3
  • 4.
    INDEX Sr No. content Page No. 1. Company Profile 5 2. Brief Study Of Finance Department 11 3. Working Capital Management 36 Calculation of operating cycle of GNFC 39 Calculation of Working Capital 51 Cash management 58 Inventory management 65 Receivables management 78 findings 84 conclusion 85 4
  • 5.
    COMPANY PROFILE GUJARAT NARMADAVALLEY FERTILIZER COMPANY LIMITED (GNFC), is a joint sector enterprise promoted by the Government Of Gujarat and the Gujarat State Fertilizer Company Ltd (GSFFC). It was set up in bharuch, Gujarat in 1976. Located at bharuch in an extremely prosperous industrial belt, GNFC draws on the resource of the natural wealth of the land as well as the industrially rich reserves of the area. GNFC started its manufacturing and marketing operation by setting up in 1982, one of the world‟s largest single-stream ammonia-urea fertilizer company. Over the next few years, GNFC successfully commissioned different projects in fields as diverse as chemicals, fertilizer and electronics. Since inception, GNFC has worked towards an extensive growth as a corporation. A growth which respects the environment and springs from the progressive vision of GNFC. GNFC today has extended its profile much beyond fertilizers through a process of horizontal integration. Chemicals/Petrochemicals, Energy Sector, Electronics/Telecommunication And Information Technology from ambition and challenging additions to its corporate portfolio. GNFC has enterprising, strategic view towards expansion and diversification. Amidst sylvan surrounding and lush green landscapes, nestles Narmadanagar, a peaceful about for those who make GNFC what it is. A club house, Tennis court, Swimming pool and an open air theater provide recreations for GNFC personnel. Narmadanagar also has a 32-bed hospital, with modern systems and equipment, and a temple. Narmadanagar is designed to serve the Ideals of community living, encourage fraternity among all GNFC members, and integrate the various interests and inclination of all the individuals. 5
  • 6.
    GNFC is weddedto the prosperity of the farmers. It interacts with them on selection of seeds, on correct application of fertilizers, on scientific farming methods and on land and water management. A large soil testing laboratory offering free service, mobile fertilizer sales units for remote areas, field demonstrations, farmers camps and educational visits and the adoption of districts and villages under an intensive fertilizer campaign -- all provide for a direct linkage with the farmer. GNFC also reaches out to the farmers through mass media communication and mobile audio visual units. GNFC runs a school in the township of Narmada agar, and has also sponsored a College for Science, Technology and Commerce. GNFC has a full-fledged training and development facility for human resources, which is equipped with audio-visual systems, simulators, comprehensive laboratory and workshops. Shareholding pattern of GNFC:- % of Total Equity Holders Capital Promoters 41.18 Mutual Funds & UTI 11.05 Bank, Financial Institutions & Insurance 13.41 Companies Foreign Institution Investors 4.13 NRIs / OCBs 2.11 Corporate Bodies 4.90 Co-operative Society 0.23 Indian Public 22.92 Shares In Pool A/c 0.07 TOTAL 100.00 6
  • 7.
    Board of Directors Smt.Sudha Anchlia IAS Chairperson & Managing Director Shri S Jagadeesan IAS Director Shri P. N. Roychaudhari IAS Director Shri M. M. Srivastava IAS Director Shri H. V. Patel IAS Director Shri Pankaj Kumar IAS Director Dr. TT Ram Mohan Director Shri D. C. Anjaria Director Dr. Ashok Shah Director Executive Directors 3 Shri J. S. Kochar Shri S. M. Shah Shri K. C. Jatania Shri A. D. Modashia Company Secretary Shri R.B.Panchal Auditors M/s SR Batliboi & Company, Chartered Accountants, Mumbai 7
  • 8.
    Registered Office P. O.Narmadanagar- 392015 District: Bharuch Gujarat, INDIA Products  Methanol  Acetic Acid  Toluene Di-isocyanate  Aniline  Formic Acid  Concentrated-Nitric Acid  Weak Nitric Acid  Ammonium Nitric (Melt)  Methyl Formate  Nitrobenzene (NB)  Calcium Carbonate  Hydrochloric Acid  Ortho Toluene Diamine Services Fertilizer plant GNFC started fertilizer manufacturing and marketing operation by setting up in 1982, one of the world‟s largest single-stream ammonia-urea fertilizer complexes. GNFC today is one of the leaders in fertilizer industry. The company is engaged in manufacturing and selling fertilizer such as Urea, Ammonium Nitro phosphate and calcium Ammonia Nitrate under the umbrella Narmada. GNFC has to phosphate and calcium Ammonia plant, a reference plant in the 8
  • 9.
    world of fueloil based technology along with the world‟s largest single stream urea plant. Chemical plant GNFC has kept pace with changing times and its vision is always focused on growth. Even as the company was implementing its fertilizer complex, plans were underway for expansion and diversification in related areas. This resulted in the up of core chemical and petrochemical plants such as Methanol, Formic Acid, Nitric Acid and Acetic Acid. These industrial chemicals are used by a wide range of manufacturers, processors and chemical operators in India and even abroad. While methanol finds application in chemicals, resign etc. Formic acid is used mainly in rubber, textiles, tanneries and pharmaceuticals industries. Both methanol and formic acid are regularly being exported to international markets. IT Tower An it division of GNFC it offers digital certificates that can integrate with application such as emails, workflow, enterprise wide application, or secure VPNs. The digital certificates can use by individuals, corporate and governments to secure online B2B/B2C applications and other online transactions. It has promoted a portal called www.nprocure .com offering end-to-end electronic procurement services provider. It also designs and builds world class data center infrastructures and also offers a wide range of security services which include managed IT services & secure infrastructure design & building services. 9
  • 10.
    ORGANISATIONAL STRUCTURE Board of Directors Chairperson & Managing Director Executive Director General Manager Additional General Manger Chief Manager Senior Manager Manager Senior Officer Officer Staff 10
  • 11.
  • 12.
    GNFC have afinance department for transacting all types of financial dealings. The finance department is the integral part of any organization which plays pivotal role in all organization. Because money is the medium without which we can even think to do anything. And finance department can only solve the problems which are arises for the money .finance department dealing with the sources of fund and application of the fund. To take any operation any operation in the consideration we must have to budget it according to the financial condition of the organization. And foremost is that to handle this financial department GNFC has its own latest technology through which I can run financial activity smoothly. 12
  • 13.
    FINANCE DEPARTMENT MAINLYDEVIDED IN THE FOLLOWING SECTION: Bills Payment Section Marketing Account Section Bank Section Establishment Section Insurance Section Indirect Tex Section Central Account Section Concurrence Section Stores Account Section 13
  • 14.
    BILLS PAYMENT SECTION Thetask of the bills payment section is to make payment for purchases made for the company. Company has to make various kinds of purchases for carrying out its operations. Like raw material purchases, purchase of the services and other purchases. Generally company asks for 30 days of credit.  RAW MATERIAL PAYMENT RAW MATERIAL PAYMENT SUPPLIERS OIL IOC: INDIAN OIL CORPORATION INDIAN SECL: OUTH EAST COAL COAL LIMITED, IMPORTED CHINA NATURAL GAS GAIL, ONGC, GSPC BAGS CHEMICALS GACL PHOSPHATE RAJSTHAN 14
  • 15.
     Transport ofthe raw material by railway then by lorry to the plant.  In case of gas through pipeline directly send to the plant, in short no storage. And form main pipeline to other departments.  In material if the purchase up to 1.5 lakh then decision authority given to purchase department.  SERVICE PAYMENT This section carries out the activity of payment of the services like advertising, stationary, security, canteen, computer related services, medical related services etc.  WORKS PAYMENT  Contractor for building repairs, machine repairs, paints and work related.  Road contract, gardening, garbage cleaning, hospital cleaning and many more they all are get their payment from this section.  Fixed cost for the stoppage of machine and operation is very high that‟s way much planned decision is to taken. 15
  • 16.
    Material requisition letter Inquiry by purchase department Shield cover not opened without the presence of person of Finance department (concurrence) department (concurrence) Comparative statement is prepared by purchase Department (decide lowest 1, 2, 3) Finance department decide and order made by purchase department  In this section if contract amount is up to Rs. 50,000 then decision taken by purchase department only.  If higher then this amount then Below Rs. 5000 Below Rs. 50000 Annual rate contracts Known as Service order is first and final must Gardening bill Various Running bill Works certificates are (within 30 days emergency required like, to part) Payment by completion, no own It early required claim, no object then cut interest Puts bill with at 14.5% and the sign of AGM payment is made. 16
  • 17.
    CONTRACTOR BILL  Finalbill is paid within 30 days.  Three years renewal contract is possible.  Form every month payment 5% security and 5% retention will be deducted. (purpose: if contractor leave before completion of month then payment to labors from above fund created by deduction)  If while contract is undertaken perfectly, then retention deduction given back immediately and security deduction within 12 months without interest.  FOREING PAYMENT  Most of plants are imported form foreign. Letter of credit in the favor of wander containing the information like amount, mode of transport etc.  In case of imported service on IC just service order (so) is enough.  Insurance by company form the ware house of wander to company.  Payment as per the current rate of foreign currency.  All imported goods collected at Mumbai ports.  Liaison office at Mumbai and Delhi.  Import as per the RBI‟s guidelines having import license. 17
  • 18.
    BUDGET AND COSTSECTION In any organization forecasting and future planning is necessary factor and it plays pivotal role in any sector. Strategic or long term planning requires specification of objective towards which future operation should be directed. These objectives should answer a no of fundamental question about the company future growth and development. The objective of budgeting is as follows,  Plan and co-ordinate all activities of business,  Quantify expectation in physical and monetary,  Co-ordinate all action,  Provide a base for control of function,  Examine area of uncertainty and risk. 18
  • 19.
    BANK SECTION Communicating detailsof budget policy and guidelines those responsible for the preparation of budget Determine the limiting faction Negotiation of budget with superior Initial preparation of various budgets Final acceptance of review budget Ongoing review of the budget 19
  • 20.
    BOB SBI 35% 10% HDFC Canara 5% Consortium 10% SBI BOI 25% 10% ICICI 5%  LONG TERMS FUND (DEBT EQUITY RATIO)  Decisions are taken by CPG  In second step all other department with CPG check the viability and feasibility of production and plans.  Range of interest rate 11% to 15%  The amount to be transferred to reserve and surplus out of profit is depending upon the policy of the management. 20
  • 21.
     Board gettingloan from bank information like, B/S, P&L A/C, cash flow statement, ratios and whatever required presented in the format given by following.  TONDON COMMITTEE  CHORE COMMITTEE INDIRECT TAXATION SECTION There are mainly tow factor in which the whole indirect taxation cell section is working, VAT (VALUE ADDED TAX) VAT is the state revenue income. And it is all about in the hands o the government. In the factor mainly three things are to be considered which are as follows; A. REGISTRATION  To start any business every business has to registrar with the registrar of the company.  As soon as department gets register with the registrar of company and gets the certificate this is with the tin no which is of 11 digits.  As any time when the tin no is necessary for that the company can also use the rubber stamp for the same.  The maximum rate for that 16%.  4% VAT and 1% additional tax is paid by the GNFC.  12.5% basic tax +2.5% additional taxes for the VAT. 21
  • 22.
     If theany change is to be made in the rate of the VAT then the company has to mention on every product.  The VAT amount collected as the way of the sell of product.  This tax the company has to pay to government with the prescribed rate and before depositing it, the dealer has deduct tax which he has to deduct tax which he has paid to supplier at the time of purchase.  In short whatever it purchases within Gujarat is available as input tax credit. B. PAYMENT  The payment is to be made to government in subsequent month on or before 22nd date of the subsequent month. C. RETURNS  It means submission of date such as;  Sales amount,  Purchase amount,  VAT payable amount,  VAT receivable amount,  Net payment payable to government, payment date,  Payment date,  Chalan number etc. 22
  • 23.
     The returnmay be monthly basis or quarterly basis.  Second return is to be known as annual return, where the dealer has to give the details for 12 months of period.  Return is to be file within 30 days from the completion of month/ quarter.  In the case of annual return it has to be filed within 90 days from the completion of the accounting year. D. AUDIT  If the more sales or purchase turnover more than 1 crore Rs. Which has the taxable turnover more than 20 lacs, then dealer has to audit the vat returns and submit to the government in prescribed form. E. PENALTY IN THE VAT  18% rate of interest as applicable on the amount up to the delay in payment.  Rs.100 per month is the penalty for delay in submission of return whether monthly or quarterly. 23
  • 24.
    CST-CENTRAL SALES TAX  The rules are frame by central government CST rule will apply where there is transaction between tow dealers of different states.  Payment returns, audit report rule applicable as per the vat for CST transaction.  The payment of VAT/ CST is to be made to government whether the same has been received by dealer or not. ST (SERVICE TAX)  Service tax is the preview of the central government.  Rules and regulation are formed by the central government. A. REGISTRATION  Service tax sell is falling under central excise and custom and service tax rules.  The rate of service tax is 12% +2% education tax on service tax and 1% higher education tax on service tax. In total rate will be 12.36%.  Service tax is charged by the service provided in invoice so separately the service tax amount.  Prescribe limit of service income is 10 lacs in current year, where the service provider has not to register with service department. 24
  • 25.
    B. PAYMENT The payment is to be made on before 5th of the next month except March month on the service income received during the payment period.  The payment can be made on monthly or quarter basis as per the rules mentions rules in the law. C. RETURN  The returns are on half year basis April to September and October to march.  The retunes are to be filed within 25 days on completion o the half year. D. SERVICE TAX PENALTY  13% is the rate of interest is applicable for the delay in days. E. PENALTY IN CASE OF FILLING RETURN  Rs. 500 is the penalty for filling a return after due date but within 15 days of last date.  Rs. 1000 for delay in submission of return within one month after due fate of return.  After 1 month penalty will be Rs.2000for any month. 25
  • 26.
    Other information relatedto this section is as follows:  There are 144 services which are covered under service tax rules.  In 5 services the receiver has to pay service tax to the government as per the rules.  Following are the industry in which the service tax is not applicable;  Consulting services from abroad,  Good transported by road,  Sponsorship,  Financial institution. 26
  • 27.
    CONCURRENCE SECTION Concurrence meanspre audit of the file paper. As per the company policy, on purchase order will place without financial concurrence section the main objective of the financial concurrence is to competitive rate new Para when ever company receiver tender, it should be opened in the presence of the financial officer. After opening tenders, technical analysis is done by indent person, and then concurrence section comes in to light. The main activity the concurrence section is to prepare competitive section and negotiate with party, comparative statement mainly include- rate, days credit sales tax, excise duty, insurance, freight experience. Financial concurrence is used as a tool of internal control and budgetary control in all government and government controlled organization and some large private sector companies. Purpose Financial concurrence system is normally used as tool of  Internal control.  Budgetary control, and  Cost control. Moreover, the system also ensures that at each and every stage of procurement commercial and financial points are taken care of while the procurement process is on. This helps in avoiding ambiguities and delays at the stage of ordering and execution. 27
  • 28.
    CENTRAL ACCOUNTS SECTION Centralaccount department works as coordinator.  This department collects financial information and figures from all other departments and prepares final accounts.  Quarterly results as well as final results are to be prepared as per the requirement of the accounting standards and according to the company‟s act 1956.  Approval of the board of director is essential before publishing quarterly results.  Financial statement prepared by this section is the mirror of company‟s performance in which company‟s image can easily traced out.  Annual and quarterly both reports are audited.  Monthly profitability is also finding out for the internal use only.  Audit is done by sampling method using advanced software.  Depreciation is calculated as per the “straight line method.”  FERTILIZER INDUSTRIAL CO-ORDINATION COMMITTEE provides subsidy by the amount of difference between price fixed by FICC and cost to company. 28
  • 29.
    ESTABLISHMENT SECTION This section deals with transaction of employee remuneration. Major functions of these sections are,  Salary payment (as per grades)  Loan employee  Leave encasement  Payment of travelling allowances  Payment of medical,  Facility payment.  A salary paid on the 25th of the same month,  Bonus as per the union and management decision (ad hawk policy),  For gratuity, provident fund, pension trust is created.  Company is also having legal and sanitary dept. This section looks after the welfare of the company employees as per service rule framed by company management, which includes following: Salary wages:  Salary includes basic pay plus dearness allowance and personal pay.  In addition to salary HRA(house rent allowance) and other perks are calculated for all the officers and staff members from electronically recorded presence. 29
  • 30.
     The entireaccounting of salary and applicable income-tax is taken care by this department.  All the above activities are carried out through HRM system which is directly connected with time office of the HR department.  The data generated from HRM system is summarized and transformed to the SAP system. Payment Of LTC Medical Expenses, Loan & Other Special Perks  LTC (Leave Travel Concession) This benefit is given to each employee as per their dependent members once in a year for travel of 4,000 Km. for this employee has to apply the leave of at least 3 days.  Medical benefit: GNFC reimburses the medical expenditure incurred by the employee as certified by the GNFC hospital management. This benefit is given only to the dependent family members of the employee.  Loan: Various loan are sectioned by this department as per the recommendation of HR department. Such as,  Loan for construction of house. 1. For purchase of vehicle. 2. For purchase of consumer durable items like washing machine, frieze, fans, furniture etc. 30
  • 31.
    Fixed Deposit Section: Fixeddeposit is important source for short-term requirement. Amount of F.D occupy big place in unsecured loan for GNFC. Due to increase in profitability of company and good reputation in the market amount of fixed deposit increased in last five years. Following are the main activities of F.D section: Accepting fresh deposits  Payment on maturity  Interest payment  Renewal of F.D  Correction  Report to registrar of company  Approval of B.O.D  Promotional activities  Monthly statement 31
  • 32.
    INSURANCE SECTION Purpose isto cover financial losses from accidental events: General For Non- Living Insurance Things INSURANCE Life Fire Insurance Insurance More Than 75 Types Marine Insurance Election All Risk Project Insurance Group Personal Insurance 32
  • 33.
     Imported decisionwhich are taken by the insurance section are as follows;  Sum assured,  Risk coverage.  Loss due to any accidental event will be estimated the government approval value‟s  Surveyor‟s visit for document verification and technical consultation. The following are the major activities which are under taken by the insurance section;  New insurance policy,  Renewal of old policy,  Putting claims against insurance company,  Premium amount,  Accounting policy. 33
  • 34.
    MARKETING ACCOUNT SECTION Marketingaccount section covers followings: 1. Cash collection from exported products 2. Cash collection 3. Collection of miscellaneous income. In detail discussion is as follows, 1. Cash collection of exported  Company is also involved in activities of exports.  Marketing account section is responsive to collect case of products.  Marketing account section checks the terms and condition of letter of credit.  If any terms and condition do not match with company‟s policy, they demand amendment in the letter of credit. 2. Cash collection  Company‟s products are divided into groups Industrial product More contribution in total profit Free market price decision Fertilizer Government regulated Subsidize products 34
  • 35.
    Major point consideredis as follows:  Debtor,  Turnovers,  Variances,  Cash flow statement  Reports preparing 3. Collection of miscellaneous income.  Company receives miscellaneous income and following are the main sources of the income.  Hospital fees and charges,  Rent test shops (GNFC township)  Soil test charges,  Sell of scraper,  Tender.  Main activities per formed by marketing account section  Preparation of sell summary,  Preparation impressed ledgers,  Preparation of bank book work sheet,  Provide guidance for collection of debts. CREDIT POLICY AT GNFC  For urea only cash payment is followed and on credit is given.  For Narmada can and phos period of 30 days or 45 days is allowed.  Credit policy allowed in the sales of industrial products,  Formic acid -----65days  Methanol-----30days,  Acetic acid-----45 days.  Company gives discount on cash purchase and discount on quantity.  Discount scheme is depending upon credit policy of company, market condition and other internal and external factors. 35
  • 36.
    WORKING CAPITAL MANAGEMENT Working capital, also known as net working capital, is a financial metric which represents operating liquidity available to a business. Along with fixed assets such as plant and equipment, working capital is considered a part of operating capital. It is calculated as current assets minus current liabilities. If current assets are less than current liabilities, an entity has a working capital deficiency, also called a working capital deficit. A company can be endowed with assets and profitability but short of liquidity if its assets cannot readily be converted into cash. Positive working capital is required to ensure that a firm is able to continue its operations and that it has sufficient funds to satisfy both maturing short-term debt and upcoming operational expenses. The management of working capital involves managing inventories, accounts receivable and payable and cash. Concepts of working capital There are two concepts of working capital-gross and net. Gross working capital refers to the firm‟s investment in total current assets. Net working capital refers to the difference between current assets and current liabilities. Net working capital is positive when CA exceed CL and negative when CL exceeds CA. A finance manager should ensure there is sufficient liquidity in the firm‟s operations. This is possible only when the CA and CL are managed 36
  • 37.
    efficiently. Liquidity ofthe firm is defined as the firm‟s ability to meet its short-term obligations as and when payable. OBJECTIVES Liquidity V. Profitability The basis objective of working capital management is to maintain the smooth functioning of the normal business operations of a firm. The company has to decide on the sufficient quantity of working capital to be maintained. A company following a conservative approach will have more current assets at its disposal. Holding large amount of CA is not very advisable as the firms lose on the profitability aspect. They can earn more by putting these resources to alternative uses or by investing CA into short term investment avenues. This approach is dynamic wherein only small amounts of cash are held by companies and the rest put to alternative uses. Need for Working Capital Different firms have different requirements of working capital. One of the objectives, the firm should earn good returns from its operations which mean that earning a steady amount of profit requires good amount of sales. The firm should invest adequately in current assets to enable it to generate sales continuously without any break. Sales do not convert into cash instantaneously and there is always on operating cycle involved in the conversion of sales into cash. 37
  • 38.
    OPERATING CYCLE It isthe length of time required to convert sales into cash. This involves three phases:  Acquisition of resources-procuring raw materials, labour, fuel, etc.  Manufacture of the product-conversion of raw material into inventory.  Sale of the product-conversion of sales into cash or credit in which case the firm has accounts receivable. The length of the operating cycle is the sum total of:  Raw Material storage period  Conversion period  Average collection period This total is referred to as Gross Operating Cycle (GOC). Form this; the firm has to make payables which are the Average Payment Period. Subtracting payables deferrals from GOC, we get Net Operating Cycle or the Cash Conversion Cycle. 38
  • 39.
    Calculation of OperatingCycle of GNFC 1) Inventory Conversion Period The inventory conversion is the sum of raw material conversion period, work in process and finished goods conversion period: ICP=RMCP + WIPCP + FGCP i) Raw Material Conversion Period ( RMCP ) RMCP = Average raw material inventory Raw material consumption per day Raw material consumption per day = Raw material consumption / 360 Average raw material inventory = (Opening stock of RM + Closing stock of RM)/2 39
  • 40.
    2007-08 2008-09 2009-10 Average raw material inventory 4041.71 5274.76 5522.39 Raw Material consumption per 214.71 292.01 341.99 day Raw Material Conversion 19 18 16 Period (RMCP) (in days) ii) Work in Process Conversion Period (WIPCP) WIPCP = Average work in process inventory Cost of production per day Average work in process inventory = (Opening WIP + Closing WIP) / 2 Cost of production per day = (Raw material consumed + power, fuel and other Utilities + stores chemicals + Opening WIP – Closing WIP) / 360 40
  • 41.
    2007-08 2008-09 2009-10 Average Work in Process 2422.75 1793.73 2013.60 Inventory Cost of Production per day 367.30 377.15 433.86 Work in Process Conversion 7 5 5 Period (WIPCP) (in days) iii) Finished Goods Conversion Period (FGCP) FGCP = Average Finished goods Inventory Cost of goods sold per day 41
  • 42.
    2007-08 2008-09 2009-10 Average finished goods 4351.26 8795.65 11532.51 Inventory Cost of goods sold per day 455.18 592.60 765.97 Finished goods conversion 10 15 15 Period (FGCP) (in days) 2007-08 2008-09 2009-10 Raw Material Conversion Period (RMCP) 19 18 16 (in days) Work in Process Conversion Period 7 5 5 (WIPCP) (in days) Finished Goods Conversion Period (FGCP) 10 15 15 (in days) Inventory Conversion Period (ICP) (in 36 38 36 days) 42
  • 43.
    Inventory Conversion Period 40 38 36 36 35 30 25 19 18 20 16 15 15 15 10 10 7 5 5 5 0 2005-06 2006-07 2007-08 Raw Material Conversion Period (RMCP) (in days) Work in Process Conversion Period (WIPCP) (in days) Finished Goods Conversion Period (FGCP) (in days) Inventory Conversion Period (ICP) (in days) From the above calculation we can see that since last 3 years the ICP is nearer to 37days. For maintaining operating cycle successfully this conversion period of inventory is fair for GNFC. 43
  • 44.
    2) Debtors conversionPeriod (DCP) Debtors conversion period = Debtors * 360 Credit Sales 2007-08 2008-09 2009-10 Debtors 36117.55 51742.25 50126 Credit Sales per day 596.55 649.82 953.86 Debtors Conversion 60 80 53 Period (DCP) (in days) Debtors Conversion Period 80 80 70 60 60 53 50 40 30 20 10 0 2005-06 2006-07 2007-08 Debitor conversion period (DCP) (in days) 44
  • 45.
    The debtors‟ conversionperiod represents the length of time required to collect the sales receipts. It can be called process of cash inflow. From the above calculation the conversion periods are fluctuating. It was highest in 2006-07 i.e. 80days which affects adversely to the firm. In 2007-08 it decreases from 80days to 53 days which is fair for GNFC. 3. Gross Operating Cycle (GOC) Gross operating cycle = Inventory conversion period + Debtors Conversion Period 2005-06 2006-07 2007-08 Inventory Conversion Period (In 36 38 36 days) Debtors Conversion Period (In 60 80 53 days) Gross Operating cycle (In days) 96 118 96 45
  • 46.
    Gross Operating Cycle 120 118 100 96 96 80 60 40 20 0 2005-06 2006-07 2007-08 Gross Operating Cycle (in days) From the above calculation we can say that gross operating cycle is highest in 2006-07 i.e. 118 days because of high collection period. In 2007-08 it is decreased to 89 days because of low collection period. The time taken in completing one round from cash outflow to cash inflow takes nearly 90 days. 46
  • 47.
    4. Payable DeferredPayment (PDP) PDP = Average Creditors * 360 Credit Purchase Credit purchase = raw material consumed + power fuel and other utilities + stores and chemicals + packing material + purchase of good for sale + closing stock of raw material + closing stork of stores and spares – (opening stock of raw material + opening stock of stores and spares) 2005-06 2006-07 2007-08 Average Creditors 21275.35 21045.27 34782.22 Credit Purchase Per Day 410.39 551.51 678.89 Payable Deferred Payment (PDP) (In 52 38 51 Days) 47
  • 48.
    60 52 51 50 40 38 30 20 10 0 2005-06 2006-07 2007-08 Payabel Deferred Payment (PDP) (In days) Payable deferred payment is the time that lapse between the dates of various resources received on credit and the date when payment is made. In the last 3 days it is highest in 2005-06 i.e. 52days. An increase in the length of the operating cycle, without a corresponding increase in payable deferred period, creates the further working capital financing needs. The days are lowest in 2006-07 i.e. 38days. 48
  • 49.
    5. net operatingcycle (NOC) Net operating cycle = gross operating cycle + payable deferred period 2005-06 2006-07 2007-08 Gross operating cycle (GOC) 96 118 89 (in days) Payable deferred payment (PDP) 52 38 51 (in days) Net operating cycle (NOC) 44 80 38 (in days) 80 80 70 60 50 44 40 38 30 20 10 0 2005-06 2006-07 2007-08 Net Operating Cycle (NOC) (In days) The difference between gross operating cycle and payable deferred period is known as net operating cycle. The operating cycle is 44 days in 2005-06 which goes up in 2006-07 i.e. 80days. An increase in the 49
  • 50.
    length of operatingcycle creates further working capital financing needs. In 2007-08 the cycle days are reduced to a noticeable level. The change in 2006-07 is because of higher collection period and lower payable deferred period. 6. Current Asset to Fixed Asset Ratio: Higher of current asset to fixed asset is useful to measure a level of current asset. The three policies are follows:  Higher CA / FA ratio indicates conservative current asset policy. It implies greater liquidity and lower risk.  Lower CA/FA ratio indicates aggressive current asset policy. It implies higher risk and poor liquidity.  Between these two extreme levels, there is an average current asset policy. 2005-06 2006-07 2007-08 Current Asset 88426.02 141029.06 120397.18 Fixed Asset 85109.61 110632.68 107022.88 CA / FA (Times) 1.04 1.27 1.12 50
  • 51.
    1.4 1.27 1.2 1.12 1.04 1 0.8 0.6 0.4 0.2 0 2005-06 2006-07 2007-08 CA / FA (Times) From the above data we can say that GNFC is following average policy. In 2005-06 current asset was slightly greater than fixed asset and 2007-08 it follows greater difference. The ratio is highest in 2006-07 i.e. 1.27 which indicates conservative current asset policy. It shows greater liquidity and lower risk of the company. 51
  • 52.
    Determinants of workingcapital A firm should plan its operations in such a way that there is neither too much nor too little working capital. The following factors are indentified as significant factors affecting the composition of working capital or current assets:  Nature of business: working capital requirements are basically influenced by the nature of business. Trading organizations invest little on fixed asset and are have a large stock of finished goods, accounts receivable (arising out of credit sales) and accounts payables (due to credit purchases). In contrast, public utilizes do not have large stocks of current asset and they invest heavily on fixed assets.  Nature of Raw Material Used: the nature of raw material also influences the quantum of inventory. For example, if the raw material is based on the agricultural produce, the seasonality of production affects the raw material requirements. Consequently, the percentage of raw material inventory to total current asset will be very high.  Sales and Demand Conditions/ Business Cycle: companies which are growing will have large quantities of finished goods inventory. Sales depend on the demand conditions which vary depending on the seasonality and cyclicality of product demand.  Processing Technology: the manufacturing cycle comprises the purchase and use of raw material and production of finished goods. Longer the manufacturing cycle, larger is the firm‟s requirement of working capital. This will also lead to an extended manufacturing time span and larger tie-up of funds in inventory. 52
  • 53.
     Credit Policy:the credit policy of the firm affects the working capital. The credit terms to be granted to customers depend on the industry norms. If the industry standard is 45 days and the firm restricts its credit terms to 20 days, it works heavily on the company‟s sales. On the other hand, if the company follows the industry standard and grants credit of 45 days, extra efforts are to be put in towards collection. Incidence of bad debts is higher in such cases.  Operation Efficiency: use of working capital is improved and the velocity of cash conversion cycle is stepped up. Better utilization of resources improves profitability and helps in reducing the pressure on working capital. Decision Criteria Working capital management entails short term decisions – generally, relating to the next one year period which is “reversible”. These decisions are therefore not taken on the same basis as capital investment decisions (NPV or related, as above) rather they will be based on cash flows and / or profitability. One measure of cash flow is provided by the cash conversion cycle the net number of days from the outlay of cash for raw material to receiving payment from the customer. As a management tool, this metric makes explicit the inter- relatedness of decisions relating to inventories, account receivable and payable, and cash. Because this number effectively corresponds to the time that firm‟s cash is tied up in operations and 53
  • 54.
    unavailable for otheractivities, management generally aims at a low net count. In this context, the most useful measure of profitability is return on capital (ROC). The result is shown as a percentage, determined by dividing relevant income for the 12 months by capital employed; return on equity (ROE) shows this result for the firm‟s shareholders. Firm value is enhanced when, and if the return on capital, which results from working capital management, exceeds the cost of capital, which results from capital investment decisions as above. ROC measures are therefore useful as a management tool, in that they link short-term policy with long-term decision making. See economic value added (EVA). Management of working capital Management uses a combination of policies and techniques for the management of working capital. These policies aim at managing the current asset (generally cash and cash equivalents, inventories and debtors) and the short term financing, such that cash flows and returns are acceptable.  Cash management: identify the cash balance which allows for the business to meet day to day expenses, but reduces cash holding costs.  Inventory management: indentify the level of inventory which allows for uninterrupted production but reduces the investment in raw materials and minimizes reordering costs and hence increases cash flow; i.e. credit terms which will attract customers, such that any 54
  • 55.
    revenue and hencereturn on capital (or vice versa) discounts and allowances.  Short term financing: identify the appropriate source of financing, given the cash conversion cycle: the inventory is ideally financed by credit granted by the supplier; however, it may be necessary to utilize a bank loan (or overdraft), or to “convert debtors to cash” through “factoring”. Calculation of gross working capital: Gross working capital refers to the current assets of the firm. Current assets are the assets which can be converted into cash within a year and it includes cash, short term securities, debtors, bills receivables etc. (Rs. In Lacs) Sources of funds 2005-06 2006-07 2007-08 Current assets Inventories 26957.87 38848.52 38599.79 Sundry debtors 42957.30 60527.55 38968.35 Cash and bank balance 5501.95 13047.91 15141.34 Interest accrued 141.48 141.48 447.65 Loan and advances 12867.42 28465.60 27240.05 Gross working capital 88426.02 141029.06 120397.18 55
  • 56.
    160000 141029.06 140000 120397.18 120000 100000 88426.02 80000 60000 40000 20000 0 2005-06 2006-07 2007-08 Gross Working Cpital From the above last 3 days data we can see that gross working capital is highest in 2006-07. Inadequate amount of working capital can threaten. The solvency of the firm because of its inability to meets its current obligation. Here we can see the major proportion of current asset investment is done into account receivable and investment in current asset should be judge adequately account to the need of business firm. Excessive investment in current assets should be avoided because it affects the firm‟s profitability, as idle firm investment earns nothing. 56
  • 57.
    Calculation of NetWorking Capital of GNFC Ltd. Net working capital is a difference between current assets and current liabilities. Net working capital= current asset – current liabilities Sources of funds 2005-06 2006-07 2007-08 Current asset Inventories 26957.87 38848.52 38599.79 Sundry debtors 42957.30 60527.55 38968.35 Cash and bank balance 5501.95 13047.91 15141.34 Interest accrued 141.48 141.48 447.65 Loan and advances 12867.42 28465.60 27240.05 (A) Total Current Assets 88426.02 141029.06 120397.18 Current liabilities Liabilities 26444.51 44245.09 35272.92 Provisions 10902.56 9723.65 13594.99 (B) Total Current Liabilities 37347.07 53968.74 48867.19 Net Working Capital (A-B) 51078.95 87060.32 71529.99 57
  • 58.
    90000 87060.32 80000 71529.99 70000 60000 51078.95 50000 40000 30000 20000 10000 0 2005-06 2006-07 2007-08 Net Working Capital (A-B) Net working capital can be positive or negative. For GNFC it is highest in 2006-07 i.e. 87060.32 which decrease in 2007-08 by 71529.99. so it is positive. Excessive investment in current assets should be avoided because it affects the firm‟s profitability. 58
  • 59.
    Cash Management Cash isthe most important current asset for a business operation. It is the force that drives business activities and also the ultimate output expected by the owners. The firm should keep sufficient cash at all time. Excessive cash will not contribute to the firm‟s profits and shortage of cash will disrupt its manufacturing operation. The term „cash‟ can be used in tow senses in a narrow sense it means the current and other cash equivalents such as cheques, drafts and demand deposits in banks. In a broader sense, it includes near cash asset like marketable securities and time deposits in banks. The distinguishing nature of this kind of asset is that they can be converted into cash very quickly. Cash in its own form is an idle asset. Unless employed in some form or another, it does not earn any revenue. Cash management is concerned with  Management of cash flows into and out of the firm,  Cash management within the firm and  Management of cash balances held by the firm deficit financing or investing surplus cash. Motives of holding cash There are four motives of holding cash. They are:  Transaction motive: This refers to a firm holding cash to meet its routine expenses which are incurred in the ordinary course of business. A firm will need finances to meet a plethora of payment 59
  • 60.
    like wages, salaries,rent, selling expenses, taxes, interests, etc. The necessity to hold cash will not arise if there were a perfect coordination between the inflows and outflows. These two never coincide.  Precautionary motive: This refers to the need to hold cash to meet some exigencies which cannot be foreseen. Such unexpected need may arise due sudden slow-down in collection of accounts receivable, cancellation of etc. the moneys held to meet such unforeseen fluctuations in cash flows are called precautionary balances.  Speculative motive: This relates to holding cash to take advantage of unexpected changes in business scenario which are not normal in the usual course of firm‟s dealings. It may also result in investing in profit- backed opportunities as the firm comes across.  Compensating motive: this is yet another motive to hold cash to compensate bank for providing certain services and loans. Banks provide variety of services like cheque collection, transfer of funds through DD, MT, etc. To avail these purposes, the customers need to maintain minimum balance in their account at all times. The balance so maintained cannot be utilized for other purpose. Such balances are called compensating balances. 60
  • 61.
    Objectives:  Meeting paymentsschedule and  Minimize funds committed to cash balance.  Meeting payments schedule: In the normal course of functioning, a firm will have to make many payments by cash to its employees, suppliers, infrastructure bills, etc. it will also receive cash through sales of its products and collection of receivables. Both these do not happen simultaneously. A basic objective of cash management is therefore to meet the payment schedule in time. Trade credit refers to the credit extended by the supplier of goods and services in the normal course of business transactions.  Minimize funds committed to cash balances: Trying to achieve the second objective is very difficult. A high level of cash balances will help the firm to meet its first objective discussed above, but keeping excess reserves is also not desirable as funds in its original form is idle cash and a non earning asset. The aim of cash management is therefore to have an optimal level of cash by bringing about a proper synchronization inflows and check the spells of cash deficits and cash surpluses. 61
  • 62.
    Factors for efficientcash management: The efficiency of cash management can be augmented by controlling a important factors described below:  Prompt billing and mailing: There is a time lag between the dispatch of goods and preparation of invoice. Reduction of this gap will bring in early remittances.  Collection of cheques and remittances of cash: It is generally found that there is a delay in the receipt of cheques and their deposits into banks. The delay can be reduced by speeding up the process of collection and depositing cash or other instrument from customers. The concept of „float‟ helps firms to a certain extent in cash management. Float arises because o the practice of banks not crediting firm‟s account in its books when a cheque is deposited by it and not debit firm‟s account in its books when cheque is issued by it until the cheques is cleared and cash is realized or paid respectively. Whenever cheques are deposited with the bank, credit balance increases in the firm‟s books but not in bank‟s books until the cheque is cleared and money realized. This refers to „collection float‟. Likewise the firm may take benefit of „payment float‟. The difference between payment float and collection float is called as „net float‟. When net float is positive, the balance in the firm‟s books is less than the bank‟s book‟s when net float is negative; the firm‟s book balance is higher than in the bank‟s books. 62
  • 63.
    Cash forecasting andbudgeting Cash budget is a device to plan for and control cash receipts and payments. It gives a summary of cash flows over a period of time. Cash budgets are prepared under three methods: 1. Receipts and payments method 2. Income and expenditure method 3. Balance sheet method Cash management at GNFC GNFC uses short period cash budget method. It prepare cash budget on quarterly basis. They make budget every month for the next three months. Cash budget is prepared by inflow and outflow as well as receipt and disbursement. 63
  • 64.
    Cash budget format: Details of cash flow: Actual for Dec-2007 v/s projection for the period Jan 2008 to March 2008 (Rs. In lacks) Actual Projections Feb March Dec Year to Jan 2007 date 2008 2008 2008 A. Opening Balance B. Receipts Sub Total C. Payment Sub Total D. Net Cash Inflow (B-C) E. Closing Balance (A+D) F. Total Cash Credit Limit Cash collections GNFC is selling its all product on cash as well as credit basis. It is own cash management system with BANK OF BRODA and ICICI. GNFC has non operative sales collection amount at each of its sales office for cash collection where only cheques are deposited by the customer, cash not be withdrawn. The fund is transferred at BOB (bharuch) to the GNFC cash credit account. 64
  • 65.
    Cash disbursement Company hasdeal with certain fixed expenses every month i.e. salaries, telephone payments, electricity charges, dealer payments etc. supplier payments are done by cheque, inter bank credit or imported account. Almost all transactions at GNFC are done by cheques on cash transaction. Minor expenses are done on cash basis. So at GNFC there is nothing like optimum cash balance. Surplus cash investment Company receives cash from selling its products. If there is surplus cash after all cash disbursement GNFC invest that surplus fund as fixed deposit for very short time period. On the contrary if company is in deficit then bank gives cash credit facility. The interest rate is now 9.25%. it is a consortium rate of all banks. The rate is counted as PLR 3.5% second source is short term t inter corporate loan from GSFC for 90 days and HDFC for 120 days. 65
  • 66.
    Inventory Management The team„inventory‟ refers to the stockpile of products. Inventory comprises of those assets which will be sold off in the near future and moneys recovered. Inventory consists of three types of assets – raw materials, semi – finished goods (work in progress) and finished goods. Raw material inventory consists of those items which are purchased by the firm to be converted into finished goods. Work in progress inventory consists of partially complete goods, that is, items currently being used in the production process. Finished goods stock represent completed products ready to be sold. The chief responsibility of a finance Manager of a firm is to see to it that the actions of the firm ultimately lead to wealth maximization of shareholders. Also he should ensure availability of sufficient raw materials for smooth production and sufficient finished goods stock to satisfy sales demands. These two conflicting is a basis of trade-off between costs and benefits associated with the inventory levels. 66
  • 67.
    Role of Inventoryin Working Capital Inventories form an important part of a firm‟s working capital. Some characteristic features about inventory are as follows: 1. Current asset: Inventories will be converted to cash within a year. 2. Level of liquidity: Inventories are looked at as next to cash. A firm having fast-moving goods in its stock can convert the products quickly to cash. Such stocks are called as highly liquid stocks. 3. Liquidity lags: Inventories have three types of legs: a. Creation lag: Raw materials are purchased on credit (creation of accounts payable) and used to produce finished goods. There is always a lag in payment whether goods are purchased or manufactured. This liquidity lag offers a benefit to the firm. b. Storage lag: The goods held for sale cannot be converted into cash immediately. Whether the goods are fast-moving, the firm realize its cash after a certain period. c. Sale lag: Instant cash realized when goods are sold on cash basis but in competitive situations, firms should give some credit period to their customers to enhance their sales volumes. This results in accounts in accounts receivable and this lag is a cost to the firm. 67
  • 68.
    Purpose The goal ofinventory holding is to efficiency through cost reduction and to increase sales volume. The following are the other benefits accruing from holding inventories:  Sales: Customers purchase goods only when need arises. On the other hand. Firms the goods they want are not available most of them look at other substitutes.  Avail quantity discounts: suppliers give discounts for purchases. Such discounts increase the firm‟s profits. Firms may go in for large orders to benefit from discounts offered by dealers.  Reducing ordering costs and time: every time a firm places an order, it incurs certain administrative expenses and some time is lost in processing these forms to get necessary approvals. Each of these varies with the number of order placed. To save on and costs, the firms may think about placing big orders  Reduce risk of production shortages: manufacturing firms require a whole lot of raw materials and spares. Even if one item is missing or is not available immediately, the entire production process goes for a toss and the firm incurs heavy losses. To avoid such situation firms maintain the required stores and inventories in sufficient quantities. 68
  • 69.
    Cost associated withinventories Successful inventory management is a trade of between high and low levels of inventory. The inventory cost can classify as under. Material costs: these are the costs of purchasing the goods and the related cost such as transportation and handling costs associated with it. Ordering costs: the expenses incurred to place orders with suppliers and replenish inventory of raw materials are known as „ordering cost‟. Ordering costs include requisitioning. Purchase ordering, transporting, receiving, inspecting and handling at the warehouse. Carrying costs: carrying cost include storage, insurance, taxes, deterioration, spoilage, obsolescence, salaries o in storage. The greater the inventory, the greater is the carrying cost. Cost of funds tied up in inventory: whenever a firm commits its resources to inventory, it is using funds that otherwise might have been available for other activities. The firm is losing on the opportunity cost. If the finds were not locked up in inventory, they would have earned a return. Cost o running out of goods: these are the costs associated with the inability to provide materials to the production department when they ask for or not providing finished goods to the marketing department when demand is there warehouse keeper, maintenance of building etc. carrying cost generally are to the tune of 25% of the value of inventory. 69
  • 70.
    INVENTORY MANAGEMENT ATGNFC At GNFC there are total 140000 items in inventory whose total value is Rs.1001000000. Bifurcation of inventories: Mechanical spares 57% Catalyst and chemical spares 12% Electrical items 11% Instrumentation items 10% Other miscellaneous item 10% 10% 10% 11% 57% 12% Mechanical spares Catalyst and chemical spares Electrical items Instrumentation items Other miscellaneous item In 57% mechanical spares, there are some item which are not come into daily use. These item are very costly and carrying cost is also high. Material planning control system is available for the management of inventory at GNFC. 70
  • 71.
    This system isuseful to control the minimum maximum level of inventory. Some inventories costs are very less and required time to time in the production. GNFC use SAP system for maintaining the inventory as well as the dead stock. SAP system is very useful and effective. The important benefit is the is helps in reducing the work load. Sales to inventory turnover ratio (2007-08) = sales/ inventory =343391.21/ 38599.79 =8.89 times The sales to inventory turnover ratio is 8.89 tines, which shows good management of inventory. Inventory management techniques Many mathematical models are available to handle inventory management problems. Some of the techniques are as follows: 1. Codification System 2. ABC System 3. Economic Oder Quantity ( EOQ) 4. FSN Analysis 5. HML Analysis 71
  • 72.
    1. Codification system Codificationrefers to assigning a unique code or name to each item based on its use, characteristics, importance and other features. It is the process of allocating a code after logical grouping and sub groping considering material types and application. Advantages:  It helps in avoiding duplication of items.  It is the starting point for standardization.  It identifies all the items logically.  It helps to group the similar items together.  It lays the foundation for an efficient purchase organization by helping to form specialized commodity base purchase sections. Since items are identified by sources of supply, it is possible to bulk together to take advantage of bulk discount. 2. ABCsystem Monitoring a large number and types of inventory becomes very difficult in a big company given the amount involved. In such cases, ABC analysis enable the management to monitor the stocks in a proper manner. The firm therefore classifies inventories into three different categories – A group – items with high attention. Rigorous, sophisticated and intensive control measures are used for such item monitoring. Items under the C group represent least value items needing simple control large. The B group stands midway. They are neither too expensive nor very cheap. These items require reasonable attention. The ABC analysis concentrates on important items and is therefore known as “Control by Importance and Exception”. It is also known as Proportion Value Analysis as items are classified according to the importance of their value. 72
  • 73.
    Advantages of ABCanalysis: It ensures closer control on costly items in which lies the greater part of company‟s resources. Clerical costs are greatly reduced as stocks are maintained at optimum level. It helps in achieving the main objective of inventory control at minimum cost. 3. Economic Order Quantity (EOQ) EOQ refers to the optimal order size that will result in the lowest ordering and carrying costs for an item of inventory based on its expected usage. The optimum level of inventory is referred to as the Economic Order Quantity. It is the economic lot size. EOQ is defined as level of inventory order that total cost associated with the inventory management. It is the level one unit beyond which is additional cost to the firm and one unit below may hamper production process. The model in inventory control.  Constant or uniform demand: The firm knows with certainty the annual consumption of a particular item of inventory.  Constant unit price: The EOQ model is based on the assumption that the per unit piece of material does not change and is constant irrespective of the order size.  Constant carrying costs: Unit carrying costs are known to vary substantially as the size of inventory increases or decreases. Firms derive economies of scale by increasing order size. However, the EOQ model assumes the carrying costs to be constant.  Constant ordering costs: Ordering costs are assumed to be constant whatever the numbers of orders are and whatever the size is. 73
  • 74.
    Economic Order Quantity: OptimumProduction Quantity 2AS/C The formula for EOQ model is Where A refers to the annual usage, S refers to ordering cost, C refers to cost of carrying inventory per unit per annum. Re-order Point In the EOQ model, it was assumed that there is no time lag between ordering and procuring of materials. Therefore the re-order point for replenishing the stocks occurs at that level when the inventory level drops to zero and because of instant delivery by suppliers, the stock levels bounce back. But rarely do we come across such situations in real life. There is always a lead time between ordinary data and receipt of materials. Due to this, the recorder level is always higher zero. Re-order point = Normal Consumption during lead time + Safety stock Recorder level = Average usage *Lead time 74
  • 75.
    Safety stock In orderto avoid a stock-out situation, the firms should maintain a safety stock which will act as a buffer or a cushion against a possible shortage of inventory. Safety stock may be defined as the minimum additional inventory to meet an unanticipated increase in usage resulting from an unusual high demand 4. FSN Analysis At GNFC FSN analysis is carried out for consumable items, which are used by multiuser. FSN means fast moving, slow moving and non moving items analysis. Norms established by GNFC for different items Fast moving items  It should have more than 5 issue transaction in a year.  There should be multi users. For fast moving items close watch is required and annual rate contracts are made to avoid stock outs. Here frequency of review is more. Slow moving items  Items should have transactions between 1 to 5 items in a year.  There should be multi users. For slow moving items consumption pattern is studied. Normally these items are for specific users and levels can be kept low but users should given their requirement or shutdown. Here frequency of review is less. 75
  • 76.
    Non moving items  Items have no issue transactions for last 3 years.  Items should have some quantity available in all the past 3 years. For non moving items reports are made at the closing of the financially year. The report is circulated to all concerned department. The departments study the use of equivalent materials against other similar material. After that the excess material is declared for disposal and that items are removed from the list. 5. HML Analysis HML analysis refers to high value, Medium value and low value items. In this analysis the unit value of the items is considered. Here the analysis is mainly focus to control the unit prices of high value items and negotiate the prices. This analysis is done for electrical, instrumentation and other items. At GNFC Items having value more than or equal to 100000Rs. Is called high value items. Items having value more than or equal to 25000Rs. and below 100000Rs. is called medium value items. Items having value less than25000Rs. is called low value items. 76
  • 77.
    Zero inventories GNFC ismaintaining the zero inventories for raw material like oil, gas etc. Zero inventories takes place when the company has made contract with suppliers to provide row material on demand. GNFC has contract with GAIL for providing gas as and when required. The supply of gas on demand help to save inventory and cost reduction also. For lubricants GNFC has done negotiation with IOC (Indian Oil Corporation). It has provided accommodation in the plant which is called IOC depot. IOC keeps the stock at the depot and GNFC use it when it is required. Till that GNFC does not need to pay anything for it. GNFC has to look after the material of depot. IOC pays charges for that to the company. This helps to reduce the transaction cost. Import substitution Import substitution refers to find out the domestic suppliers for the item which are imported. GNFC has done the same for the item which are imported. It has developed supplier connection in domestic market and market contracts with them. GNFC has positive experience by contracting with local vendors. It has obtained lots of saving and benefits by adopting import substitution technique. Pricing of inventories There are different ways of valuing inventories. Firms should choose that system which gives them the maximum benefit. Fist In Fist Out (FIFO): a firm adopting this method prices the raw material at that rate at which the material were received. The goods received first are issued first and once the first set of consignment is completely exhausted, the second set is not utilized. This is logical method of issues which is used by almost all companies. 77
  • 78.
    Last in firstout (FIFO): in the LIFO method, the consignment last received is first issued and if this is not sufficient, only then the previous set in the warehouse is utilized. This system is useful when the companies want to price their product on the basis of total cost incurred plus a percentage of profit. Weighted average method: the pricing of materials is done on weighted average method where in weights are assigned to the quantities held and accordingly priced. This is one of the most widely used methods as it gives importance to the balances in stores in their proportion of availability. Standard price method: under this method, the material is priced at a standard cost which is predetermined. When the material is purchased, the stock account will be debited with the standard price. The difference between the purchase price and the standard price will be carried to a variance account. Replacement or current price method: this method prices the issues at the value that is realizable at the time of issue. 78
  • 79.
    Receivable Management Businesses sellgoods on credit to increase the volume of sale. In the present era of intense competition, one way to improve sale deals is to offer relaxed payment conditions to customers. Finished goods get converted to receivables when sold on credit terms. Trade credit is a marketing tool that tries to bridge the gap between production and distribution of company‟s products. Trade credit creates receivables or book debts which the firm hopes to realize in the near future. The receivables are a very important component assets. Objectives The term „receivables‟ is defined as „debt owed to the firm by customers arising from the sale of goods or services in the ordinary course of business‟. The main objective of having receivables in the current assets is to promote and encourage sales which will lead to increased profits. In competitive situations, the firms will be forced to offer goods on credit keeping in line with competitor‟s strategies. All firms therefore grant credit to increase sales, profits and to meet competition. Costs Associated with Maintaining Receivables The following are the different costs incurred with the extension of credit and accounts receivable:  Capital cost: A firm offering goods on credit can surely expect higher sales but some of the firm‟s resources remain blocked in them as there is a time lag between a credit sale and cash receipt from customers. The 79
  • 80.
    cost of useof additional capital to maintain its obligations will definitely have an effect on the firm‟s profits.  Collection cost: These are the costs incurred in collecting receivables. They are administrative in nature and these costs include(a)additional expenses on the creation and maintenance of staff, stationery, postage, registers etc.  Delinquency cost: This cost arises out of the failure of customers to meet their obligations when payment on credit sales becomes due after the expiry of credit period. Additional costs in the form of reminders, legal charges etc. will be incurred.  Default cost: The firm may not be able to recover its dues because of its customers‟ inability to pay off their debts. Such dues are bad debts and go on to reduce the profits of the company. The size of the receivables is determined by the firm‟s credit policy and the level of its sales. 80
  • 81.
    Receivables management atGNFC At GNFC the receivables are approx. 35% of current assets. The company credit policy varies from 15 days to 90 days. On every 30 days company prepares the receivables list which shows the total receivables and due date for each bill. The list is prepared by accounting department. Account department co ordinates with marketing department for collection of receivables. Credit policy The credit policy of a company can be regarded as a tradeoff between increased credit sales leading to higher profits and the cost of having large cash locked up in receivables. The credit policy to be adopted in businesses largely depends upon competitors‟ strategies. If the competitors are grating a 15 day credit period and if the firm decides to extend the credit period to30days, the firm will be flooded with customers‟ demand for company‟s products. Firms average investment in account receivable 90days credit per month. The credit policy is a framework to determine (a) Credit standards, (b) Period of credit, (c) Cash discount to be offered and (d) Collection program. All these variables listed influence the amount of sales, the amount of sales, and the amounts locked up in receivables and the bad debts incidence. 81
  • 82.
    Credit Standards The term„credit standard‟ represents the criteria for extending credit to customers. The quantitative basis for setting credit standards are credit rating, references, average payment period and ratio analysis. Professional credit rating agencies‟ help may be sought to rate a customer‟s creditworthiness. After rating, the customers are rated as „excellent‟, „very good‟, „good‟,‟ average‟, „poor‟ , etc. The overall credit standards can be divided into (a) tight or restrictive and (b) liberal or easy-going. Credit period This refers to the time given to customers to pay for their purchase. It is generally expressed in days like 15 days or 30 days. Generally, firms give a discount if payments are made within a said period beyond which they will not lose on the benefit that can be availed. Increasing the credit period will bring in new sales and new customers decrease, which is not desirable. Cash Discounts Firms offer cash discount to induce prompt payment s. Cash discounts has implications on sales volume, average collection period, investment in receivables, incidence of bad debt losses and profits. Change in discount rate will bring in additional sales-granting a discount implies reduced pieces and this factor brings in new sales. GNFC is providing 14% discount on the total amount to the clients‟ if they pay before due date. 82
  • 83.
    Collection Program The successof a collection program will be depended on the collection policy. The objective of a collection policy is to achieve timely collection of receivables, thereby releasing funds locked up in receivables and minimize bad debts occurrence. The collection program consists of the following:  Monitoring receivables  Informing customers about the due date for payment  Initiating legal action to overdue customers after sending repeated notices Collection policy should be so formulated that it is not too rigorous as it acts as an irritant to customers, leading to bad relationship with them. Credit policy at GNFC  The company sales its product on both cash and credit basis.  Daily reporting of sales is done for organizations.  The Company follows a rigorous system of credit evaluation for both corporate client and dealers. The customers are required to make payments through cheques.  ICRA rating is the standard for selecting and granting credit to customer  Clients are required to give pre signed cheques to the GNFC for purchasing the product.  Company has non operative sales collection account at each sales office for cash collection.  If clients pay before due date then interest is charged @ 16% per year on total amount. 83
  • 84.
     If clientspay before due date then 14% discount is given on the total amount.  If the cheque bounces from the account then 0.75% of total amount or 5000 Rs. whichever is higher is charged to customer.  Prorate of quantity: if GNFC doesn‟t have quantity if product then it is entitled to follow all the conditions. Credit evaluation of client is done for the purpose of extending credit to them. GNFC has presently implemented credit rating model developed by ICRA rating agency for assessing the clients‟ credit worthiness. They want to change the credit rating agency from ICRA to CARE. In GNFC different monitoring technique of account receivable are used. It is to collection period and monitoring the top 10 customers of GNFC. 84
  • 85.
    FINDINGS  The valueof gross working capital is highest in 2006-07 i.e. 141029.06 Major proportion of investment is done into account receivables and inventories.  The value of net working capital is increasing and highest in 2006-07 i.e. 87060.32 which indicates good liquidity position of GNFC.  The inventory conversion period is on an average 37days during last 3 years. It means average 37days time is required for producing and selling the product.  Debtors‟ conversion period is highest in 2006-07 i.e.80days which goes down in 2007-08 i.e. 53days. Lower collection period is good for the company.  Gross operating cycle is highest in 2006-07 i.e. 118 days due to high inventory conversation period and debtor‟s conversation period.  Payable deferred payment is 2006-07 i.e. 38 days. It is 51 days in 2007- 08.  The net operating cycle is higher in 2006-07 due to higher collection period and lower payable deferred period.  Current assets to fixed assets ratio is higher in 2006-07 i.e. 1.27 GNFC is following average policy in which there is an equal level of risk and liquidity. 85
  • 86.
    CONCLUSION From the abovecalculation and information we can say that GNFC is managing its working capital very effectively. All three components of working capital i.e. cash management are operating very successfully at the company. Major transactions are done through cheque. Company has sound liquidity position. Its investing the major portion of surplus fund in FD only. The company has good inventory management. It is maintaining zero inventories. GNFC uses different techniques for monitoring receivables management. In short the all over working capital management of GNFC is proper. 86